HAL Id: hal-01640072
https://hal.archives-ouvertes.fr/hal-01640072
Submitted on 20 Nov 2017
HAL is a multi-disciplinary open access
archive for the deposit and dissemination of
sci-entific research documents, whether they are
pub-lished or not. The documents may come from
teaching and research institutions in France or
abroad, or from public or private research centers.
L’archive ouverte pluridisciplinaire HAL, est
destinée au dépôt et à la diffusion de documents
scientifiques de niveau recherche, publiés ou non,
émanant des établissements d’enseignement et de
recherche français ou étrangers, des laboratoires
publics ou privés.
Improving user interaction in mobile-cloud database
query processing
Chenxiao Wang, Jason Arenson, Florian Helff, Le Gruenwald, Laurent
d’Orazio
To cite this version:
Chenxiao Wang, Jason Arenson, Florian Helff, Le Gruenwald, Laurent d’Orazio. Improving user
in-teraction in mobile-cloud database query processing. Workshop on Scalable Cloud Data Management,
Dec 2017, Boston, United States. �hal-01640072�
Improving user interaction in mobile-cloud database query processing
Abstract—When running queries on a database, choosing an
optimal query execution plan to minimize query costs is crucial for the query optimizer. This is especially true in mobile-cloud database systems, where there are multiple costs to execute a query plan such as money, time and energy. In order to fulfill different cost objectives for different users, some query optimizers allow users to select the query execution plan from a Pareto Set based on Skyline queries. The users must select from a potentially large quantity of options, and these options present the values of costs. It is not straightforward to the users how to compare these values in such a way to choose the option that suits their needs best. This increases the possibility for users to choose in-optimal options, and the amount of time spent to make that choice. However, the existing user interaction model during multi-objective query processing is unable to solve this issue. To fill this gap, this paper presents a new user interaction model in multi-objective query processing. This model introduces the administrators, or super users, to the user interaction process, allowing them to preset Weight Profiles and their logical descriptions. Weight Profiles contain objective preferences for the users before the query is executed. By using this model, the users can select a Weight Profile that will obtain their optimal query execution plan, and the process of choosing will be more accurate and efficient.
Keywords-mobile-cloud; multi-objective; interaction
I. INTRODUCTION
In a mobile-cloud database environment, a user issues queries from a mobile device to obtain data from either the cloud database system or a cache on the mobile device. Fig. 1 shows the process flow of query processing in the mobile-cloud database system that we have developed [1]. In this architecture, the mobile device is for the user to access the database and input queries, the data owner is a server on site which contains private data, and the cloud providers own the cloud database system. Executing a query incurs three different costs: the monetary cost of query execution on the cloud, the overall query execution time, and the energy consumption on the mobile device where the query might be executed. These three costs constitute the multi-objectives that the query optimizer needs to minimize in order to choose the optimal query execution plan (QEP). Different QEPs are available due to the elasticity of the cloud which considers multiple nodes with different specifications. Meanwhile, different users have different preferences for choosing a suitable QEP for their purposes. In an application scenario where many queries are executed per day, organizations try to minimize the monetary cost spent for query execution to fit their budget. They also want to minimize query execution time to meet customers’ query response time requirements and to optimize employees’ working time. Furthermore, users also want to minimize energy consumption on their mobile devices where queries might be executed [10]. This optimization process is a stretch of contradicting propositions, especially when considering different cloud pricing models
Figure 1. Mobile - Cloud Database Environment [10]
Chenxiao Wang Jason Arenson Florian Helff Le Gruenwald Laurent d’Orazio
School of Computer Science University of Oklahoma Norman, Oklahoma, USA
{chenxiao, arensonjt, fhelff, ggruenwald}@ou.edu
CNRS, IRISA University Rennes F-22305, Lannion, France laurent.dorazio@univ-rennes1
[11]. Thus, selecting a QEP of Skyline queries from the users’ perspective becomes an issue. Due to the multi-objective scenario of the mobile-cloud database environment, the number of QEPs generated for the user to choose from in a Pareto Set based on Skyline queries will be very large and difficult to choose from efficiently.
There exist algorithms that have been proposed to answer Skyline queries [14][15][16][17]. Also, some extensive studies have made assumptions about the users’ purposes without explicit interaction [3][5][7][12]. There are some studies that have proposed to use users’ feedback as a parameter to guide the Skyline QEP selection [4][6][8][13][18]. However, none of these works aims at improving the time consumption and accuracy of the users to make such decisions. We have developed the Normalized Weighted Sum Model Algorithm (NWSA) which allows the user to make a decision for the QEP based on all objectives under a declarative preset guidance [1]. In this paper, we present a model in which the administrators [19] (or super users) customize the guidance for their system users by presetting the profiles of the objective preferences (Weight Profiles), allowing the users to efficiently process queries by choosing from a set of preset Weight Profiles.
The rest of the paper is organized as follows: Section 2 gives a summary of the NWSA algorithm; Section 3 presents the interaction model based on the NWSA algorithm; Section 4 gives an example and comparison of typical user interfaces that users will encounter under different interaction models; and Section 5 presents a user study to show the benefits of the preset Weight Profiles for the users.
II. NORMALIZED WEIGHTED SUM MODEL ALGORITHM
The Weighted Sum Model (WSM) is an existing optimization strategy which incorporates multiple objectives into its decision. Using a single number called score for each alternative, which includes all objectives, an alternative is rated and can be compared to other alternatives. The score aggregates the different objectives, stressed by individual weights on each objective. Ordering the alternatives by their scores allows the model to choose the best alternative: maximum score for utility functions and minimum score for cost functions. One problem of the WSM is the addition of multiple dimensions or units. To use the WSM in the context of different dimensions and unit objectives, we developed the Normalized Weighted Sum Model Algorithm (NWSA) [1], which uses the WSM as a basis but makes major changes to cover the weaknesses so that this problem can be resolved by normalizing the different parameters [20]. This normalization can be done in relation to a user-defined maximum of acceptance of each objective. The resulting values represent the fraction towards this maximum and do not contain a unit which makes them addable to each other. Additionally, the normalization to a user-defined maximum of parameters adapts another strategy called user-based decision [9]. Another advantage of this user-defined maximum of acceptance of each objective can be seen in the later implementation of the algorithm. Alternatives which violate those regulations can be taken out of consideration to keep the defined conditions.
The second adjustment is made for the weights. To include environmental factors, the used weight is composed of a user-defined weight and an automatically generated environmental weight. Environmental factors are, for example, the current battery status, an ongoing charging process or factors describing the currently used cloud. The environmental weight adjusts the user weight if, for example, a mobile device is being charged and energy consumption is obsolete, or a query is run overnight and execution time should be assigned a minor importance factor.
In conclusion, the Modified Weighted Sum Model Scoring Function can be expressed as in (1).
(1) Modified Weighted Sum Model Scoring Function
𝑎"# is the value of alternative i (the i-th QEP) for objective
j, n is the number of objectives, 𝑚# is the user-defined
acceptable maximum value for objective j, and 𝑤# the normalized composite weight of the user-defined weight and the environmental weight for objective j defined in (2).
(2) Composite Normalized Weight Factor
Equation (2) shows the computation of the composite weight where 𝑢𝑤# and 𝑒𝑤# describe the user-defined weight
and the environmental weight for objective j, respectively. Since the different objectives are representative of different costs, the algorithm chooses the alternative with the lowest score to minimize costs as shown in (3).
(3) Modified Weighted Sum Model Scoring Function: Optimal Alternative
III. INTERACTION MODEL WITH NORMALIZED WEIGHTED
SUM ALGORITHM
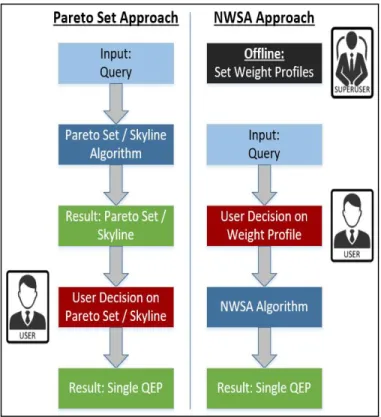
Fig. 2 shows the user-interaction models for Skyline queries (a) and NWSA (b), respectively. Both algorithms start with the query as their input. NWSA additionally requires the weight profiles to stress the objectives but eliminates the step of a user decision based on the results of the algorithm. This user decision is needed in the Skyline approach, since the selection of a single alternative has to be done manually if
𝐴")*+,-./01 = 4 𝑤 # 𝑎"# 𝑚# 5 #67
𝑤
#=
∑(89 ∗19)89: ∗19:𝐴)*+,-./01∗ = min " 4 𝑤# 𝑎"# 𝑚# 5 #67
taking the user’s preferences into account, which pauses the query processing. In the NWSA approach, this decision is made by the algorithm and does not require any interruptions or waiting for additional inputs. The final user decision on an alternative from the result of the Skyline query remains very complex. Research on the size of a Pareto Set already estimated its size to be Θ ln 𝑛 D,7 / 𝑑 − 1 ! for n data
objects and d objectives, assuming attribute independence [2].
Figure 2. User Interaction Models: Skyline (Pareto Set) Approach and NWSA Approach
To eliminate the disadvantage NWSA has in comparison to the Skyline query approach in that user preferences have to be known prior to execution, we propose to separate users into two groups: users that make the decision on weights (super users) and users that invoke the execution of a query (users). These preferences of weights are called Weight Profiles. A Weight Profile contains a set of weights that reflect preferences toward the multiple costs. Each Weight Profile with a different cost emphasis is associated with a label, which is an application-based logical description which uses natural language rather than numbers to describe the multiple weights. Several Weight Profiles are set up by the super user before the queries are submitted by the users. There are two aspects of this approach that benefit the users. First, the users do not have to be aware of the details of the Weight Profiles and can select Weight Profiles from their labels. This minimizes the decisions the users have to make. Second, due to how Weight Profiles are created, there will be fewer Weight Profiles than there would be QEPs in Skyline queries selection. Fewer options to pick between makes it easier for
the user to quickly make the decision correctly for them. Making the options declarative reduces the possibility of inaccurate selection and fewer options helps the user make faster decisions. This abstraction to a simpler user interaction reduces the complexity of the user’s decision on a weight profile.
IV. SUPER USER AND USER INTERFACE A. Example of Super User Interface
As mentioned above, to include a super user in the user interaction and making the decision simpler for users is an advantage, but still leaves the super users with their decision to set weights and label each weight with a description.
The super user interface we developed has the purpose of giving an easy tool to super users to set accurate Weight Profiles based on their application requirements for the users. The main feature of this interface is the graphical representation of all possible Weight Profiles in an interactive parallel plot [9]. The super users select a suitable subset from all the possible Weight Profiles and label each Weight Profile with a logical description. By doing this, the users are only required to select from a small number of labels, with each label representing a suitable QEP preset by the super users. Thus it is less likely for them to make a wrong choice on selecting the QEP. Parallel plots are used to show connections between high-dimensional objectives: a point of an n-dimensional space is represented by n vertices on n parallel dimensions which are connected by a polyline. The position of a vertex in any dimension corresponds to the coordinate of this point in this dimension.
Fig. 3 shows such a parallel plot with each line representing a Weight Profile (weights on monetary cost, execution time, and energy consumption in axes 2, 4, and 6) and its corresponding cost (axes 1, 3, and 5). The three different costs are calculated based on the historical average cost of a query using this specific Weight Profile to execute. Estimating a QEP is out of scope of this paper, while it is an important perspective in our project. The rectangle on the third axis shows there is a slider on cost axis and this slider applies to each axis. The super users are able to click a line to set the Weight Profile and attach a label to it, as well as use the sliders to set different cost constraints on according cost columns to filter out the QEP whose estimation costs exceed the constraints. For example, the super users can easily use the slider to set the maximum monetary cost according to their operation budget. When each constraint is set, the unavailable lines are filtered and vanish in the interface to indicate that these weights are not suitable for the given query constraints.
If the extreme constraints are chosen, it is possible that all the lines vanish which means there are no available weights for the query constraints. The remaining lines represent different profiles which can be saved and attached to a logical description for users to view when selecting Weight Profiles. An example of a Weight Profile would be 0.8 weight on monetary cost, 0.1 weight on execution time, and 0.1 weight on energy with its corresponding costs of $40000, 8100 s, and 220000 mAh. Assuming one million queries, the corresponding average costs per query are $0.04, 0.0081s, and 0.22 mAh when using these weights. If such costs are accepted by the super user, these weights can be saved and labeled with a description of “runs relatively slow but saves money and energy” which indicates that the query optimizer should choose the QEP with a lower monetary and energy cost. In addition, our study shows that it takes less time for an ordinary person to make decision with the help of the logical descriptions when there are more alternatives.
B. Example of User Interface
In order to show user make selection among presetting of the logical descriptions of the Weight Profiles compare to make selection among Skyline queries, we demonstrate two common interface for users.
Fig. 4 shows an example of an user interface used by a medical doctor where the Skyline queries approach is implemented. From Fig 4, we can see that the top part provides different query options for a doctor to select based on his/her purposes. The information that a doctor would like to obtain is displayed after the query has been answered, and the doctor is presented an option to choose how he/she would like to get the information. Notice that, without the Weight Profiles and the logical descriptions, the user has to make a choice from a large number of options produced by the
Skyline queries approach. Thus, this choice can easily be wrong and takes a significant amount of time.
Figure 3. Super User Interface for the super users to select weight profiles and attach logical descriptions
Fig. 5 shows a similar interface but with the presets made by the super user. The doctor is only required to choose from a few options and requires no knowledge of weights or the cost of how the data is queried. Only the description of each Weight Profile is visible for the user to select based on his/her preferences. This saves time and energy in the user’s decision-making process and reduces the chance for the doctor to make a wrong decision in QEP selection. NWSA has more overhead cost than Skyline, but that is compensated for by the time saved in the decision-making process. For example, if a doctor is working in the Emergency Room, the doctor selects the Weight Profile with the logical description “Fastest response time at any time and energy cost” in which the query is answered as soon as possible regardless of the monetary cost or how much energy the query will cost the devices. If the doctor is working on his/her medical research and needs a patient’s data, the doctor may choose the Weight Profile with the logical description “Saves money and energy, but takes longer time” to retrieve the data slower but with a lower monetary cost in order to save money. As long as there is a super user that created all the preferences prior to the query
execution, and these preferences are declarative to the user, this will significantly simplify the query processing interaction with the users.
V. USER STUDY
A preliminary user study was conducted in order to evaluate the difference between the user decision on a single QEP in the Skyline model and the weight profile selection process needed by the NWSA. There were three approaches that were compared: Skyline query selection, the selection of the weights for each objective in NWSA, and the selection of Weight Profiles described in natural language. The user study measured the accuracy of user decisions and the time necessary for the user to make their decision.
A. Study Model
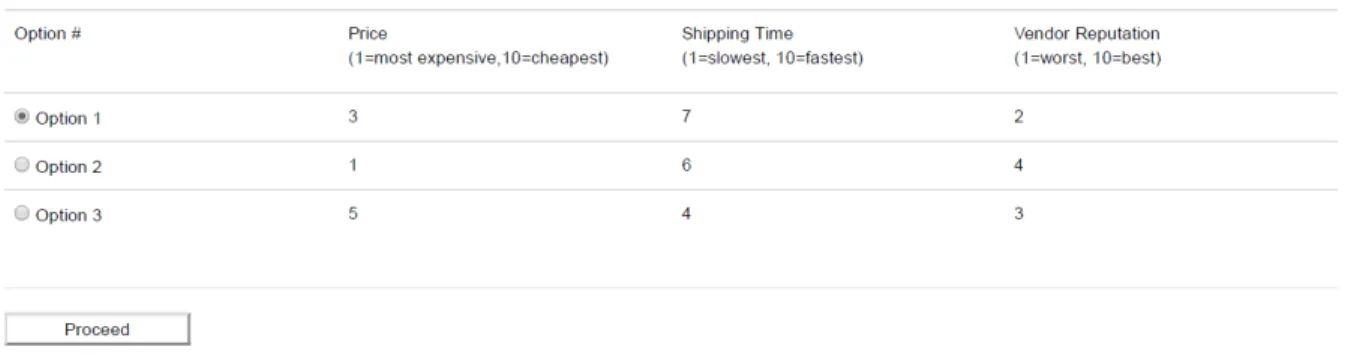
The participants of the study, volunteers with and without a background in computer science, were given three sets of questions representing the decision a user has to make in the three different approaches. The Skyline questions represent the selection of an alternative based on the given Pareto-Set in the Skyline approach (an example is shown in Fig. 6), the numerical Weight Profile questions represent the selection of weights for each objective in NWSA (an example is shown in Fig. 7), and the descriptive Weight Profile questions represent the selection of Weight Profiles set by the super user (an example is shown in Fig. 8).
The study is an equivalent multi-objective question such that no specific knowledge or excessive introduction to the field was necessary. In each question, users are asked to select
Figure 5. User Interface for Weight Profiles with Logical Descriptions
one alternative to buy a TV based on the given alternatives. In this transposition, a TV is equivalent to a QEP, the monetary cost to purchase a TV is equivalent to the monetary execution cost, the delivery time is equivalent to the execution time, and the vendor reputation is equivalent to the energy consumption. With each question in a set, users are presented with 3, 5, 7, and 9 options to choose from.
For the results, the two variables looked at for each question were the length of time taken to answer the question and the accuracy of the response. These results were analyzed in two groupings: by the type of options (Skyline, Weight Profiles, and Weight Profiles with logical descriptions), and by the number of options (3, 5, 7, and 9). For each user, the average time each user took on the questions within each group of questions was gathered, and the percent of questions each user responded to correctly within each group of questions was gathered. Then the results will be compared using statistical analysis in order to gain information about the reliability of the results.
B. Study Results
The number of participants from which results were gathered was 36. For the analysis of the data gathered, two-sample t-tests were used to compare the different groups of data. The t-test is a statistical hypothesis test in which the test statistic follows a Student's t-distribution under the null hypothesis [21]. The hypothesis being tested is if the true difference in the means of the two groups is zero, with the alternate hypothesis being that the difference is non-zero. A variance test was used to find whether or not a standard two sample t-test or a Welch two sample t-test was used to compare the two groups, with the former being used if the variances are plausibly equal.
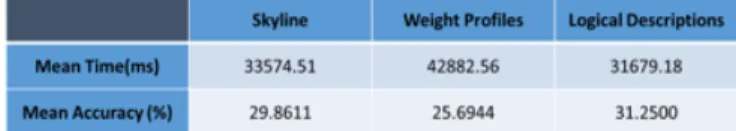
Fig 9. shows the average time and accuracy for users for the questions separated by type of options, and Fig. 10 shows the same when separated by the number of options. Fig. 11 and Fig. 12 show the p-values gathered by comparing the results used to produce the averages in Fig. 9 and Fig. 10.
In Fig. 11, we see that Skyline and Logical Descriptions are the two question types that are most likely to have true means that equal zero for time, with a p-value of 0.7071.
Figure 8. Example of User Study questions representing the NWSA approach with logical descriptions for 3 Options. Figure 7. Example of User Study questions representing the weight selection for the NWSA approach for 3 Options.
Weight Profiles and Skyline have a p-value equaling 0.1843 for time, while Weight Profiles and Logical Descriptions have a p-value of 0.06962 for time. While neither of these p-values are below 0.05, which means we cannot discard the hypothesis that the true means of the groups being compared are equal, the low value of the p-values implies that the Skyline and Logical Description results have a lower likelihood of having equal true means to the Weight Profile results.
For the accuracy of users for the question types, the distinction between the groups is more pronounced in the values. The t-test for Skyline and Weight Profiles has a p-value of 0.3792, which is greater than 0.05, but Logical Description has a p-value of 0.01409 and 0.004871 when compared to Skyline and Logical Descriptions respectively. Both of the p-values are below 0.05, which means that the hypothesis of the true difference in means being equal to zero can be rejected for the accuracy of responses to the Logical Description questions and other questions. From Fig. 9, we know that the Logical Descriptions were responded to more accurately than the other types of questions, even if not by a large amount.
The data gathered from the results of the users separated by the number of options given to them, as seen in Fig. 10, shows a clear pattern in accuracy, and has a similar result in time although certain parts are suspect.
For accuracy, the mean accuracy for the number of options decreases with more options, with a sharp drop in accuracy for the questions that present nine options to the users. The pattern of the p-values is logical, since the comparisons are done between the three option questions and the other numbers, and not between all the groups. The p-value decreases as the number of options being compared with three options increases, although the p-value for three options and nine options is the only p-value for accuracy that is below 0.05 where the hypothesis that the true difference in means being equal zero can be rejected.
For time, the results are less conclusive. The mean time for seven options is less than the mean time for five options, as well as having a higher p-value when compared to three options. In addition, the p-value for three options and nine options for time is not below 0.05 although it is close, meaning that the hypothesis of the true difference in means being equal
to zero cannot be rejected. However, the low p-value does imply a lower likelihood of the populations being equal.
VI. CONCLUSION AND FUTURE RESEARCH
This paper presented an algorithm, NWSA, and a user-interaction model that enable user user-interaction in database query processing with multiple cost objectives. This model was compared with the existing user interaction model of the Skyline approach. Additionally, this paper showed an interface to allow super users to construct and analyze Weight Profiles needed for users, and an interface to allow users to select a QEP based on the logical description labels of the Weight Profiles. The comparison shows that the user interaction of deciding on a Pareto optimal QEP, which is necessary while using the Skyline approach, can be eliminated by using NWSA.
The results of the user study presented imply that the weight selection for the NWSA approach results in users taking more time to choose the option they believe is correct, while the Skyline and Weight Profiles with logical descriptions are more likely to be the same in the amount of time they take. In terms of accuracy, the logical description seems to result in the users answering more accurately, although the average accuracies show that this higher accuracy is not a significant improvement over the other categories, especially given the low number of participants. The comparison between the number of options shows that from three to nine options, the time noticeably increases and the accuracy noticeably decreases for the users’ responses.
This survey is meant to show whether or not the Weight Profiles and Weight Profiles with logical descriptions would be an improvement over the Skyline approach, and the results seem to support that. While the Skyline results for time and accuracy are not much worse than the Weight Profiles with logical descriptions, the number of options shows that more options lead to more time taken and less accurate responses. The implementation of Weight Profiles is meant to create a smaller list of options for the user to pick from, and so the list of Weight Profiles will have fewer options than the Skyline approach. The fewer options, as supported by the results of the survey, has a high probability of resulting in more accurate and quicker choices by the users in order to fit their
Figure 9. Mean time and accuracy for an option selection in the three approaches
Figure 10. Mean time and accuracy for an option selection for different numbers of options
Figure 11. P-value of student Figure 12. Example of User Study questions representing the NWSA approach with logical descriptions for 3 Options.
preferences. In addition, the logical descriptions are useful for the Weight Profiles, as the logical descriptions took less time for users to answer than the Weight Profiles without logical descriptions, and were marginally more accurate as well.
Despite these results, the survey is preliminary and has some limitations that will need to be addressed in the future. The first issue is that of the ordering of the questions. The sections for the types of questions were randomized in order to prevent bias in the results from a specific ordering of the questions, but no such method was done for the number of questions. It is possible that users could have become more accustomed to answering the questions within each section, resulting in the questions with more options taking less time than they would have otherwise. In addition, the accuracy for all the groups recorded above is below 50 percent. This implies that there may be a problem with the survey resulting in users having difficulty answering questions correctly. If this is the case, future iterations of this survey will need to look closely at both the explanations and the options to ensure that the users are able to sufficiently find the right answer with the information provided. To obtain higher confidence results, a higher number of survey participants will also be needed..
ACKNOWLEDGMENT
This work is partially supported by the National Science Foundation Award No. 1349285.
REFERENCES
[1] Helff, Florian, Le Gruenwald, and Laurent d'Orazio, "Weighted Sum Model for Multi-Objective Query Optimization for Mobile-Cloud Database Environments," Proc. EDBT/ICDT Joint Conference Workshop, vol. 1558, March, 2016.
[2] D Papadias, Y Tao, G Fu, and B Seeger, "Progressive Skyline computation in database systems," ACM Trans. Database Syst. 30, 1 , March 2005, pp.41-82. doi:10.1145/1061318.1061320
[3] J. Chomicki, P. Godfrey, J. Gryz, and D. Liang, "Skyline with Presorting," Proc. IEEE International Conference on Data Engineering (ICDE’03), IEEE Computer Society, 2003, pp.717–816.
[4] W.-T. Balke, U. Güntzer, C. Lofi, "User interaction support for incremental refinement of preference-based queries," Proc. 1st IEEE International Conference on Research Challenges in Information Science (RCIS’07), 2007,pp. 209-220
[5] I. Bartolini, Z. Zhang and D. Papadias, "Collaborative Filtering with Personalized Skylines," Proc. IEEE Transactions on Knowledge and Data Engineering(TKDE’11), vol. 23, no. 2, Feb. 2011,pp.190-203, doi: 10.1109/TKDE.2010.86
[6] Donald Kossmann, Frank Ramsak, and Steffen Rost, "Shooting stars in the sky: an online algorithm for Skyline queries," Proc. 28th international conference on Very Large Data Bases (VLDB '02), VLDB Endowment, 2002, pp.275-286.
[7] Danupon Nanongkai, Atish Das Sarma, Ashwin Lall, Richard J. Lipton, and Jun Xu. 2010, "Regret-minimizing representative databases," Proc. VLDB Endow. 3, 1-2, September 2010, pp.1114-1124,doi: 10.14778/1920841.1920980
[8] Jongwuk Lee, Gae-won You, and Seung-won Hwang, "Personalized top-k Skyline queries in high-dimensional space," Inf. Syst. 34, 1 ,March 2009, pp.45-61, doi:10.1016/j.is.2008.04.004
[9] Alfred Inselberg, "Parallel Coordinates: Visual Multidimensional Geometry and its Applications," Springer-Verlag New York, Inc., Secaucus, NJ, USA, 2009.
[10] M. Perrin, Time-, Energy-, and Monetary Cost-Aware Cache Design for a Mobile Cloud Database System," Master’s Thesis, University of Oklahoma, School of Computer Science, May 2015.
[11] Amazon, Amazon EC2 Pricing, 2015. [Online].Available: https://aws.amazon.com/ec2/pricing/?nc1=h_ls. [Zugriff am 18 08 2015].
[12] Wanbin Son, Seung-Won Hwang, and Hee-Kap Ahn, "MSSQ: Manhattan Spatial Skyline Queries," Inf. Syst. 40, March 2014, pp. 67-83.
[13] Matteo Magnani, Ira Assent, Kasper Hornbæk, Mikkel R. Jakobsen, and Ken Friis Larsen, "SkyView: a user evaluation of the Skyline operator," Proc. 22nd ACM international conference on Conference on information & knowledge management (CIKM '13). ACM, 2013, pp.2249-2254, doi:10.1145/2505515.2505739
[14] Jongwuk Lee and Seung-Won Hwang, " Toward efficient multidimensional subspace Skyline computation," The VLDB Journal 23, 1 ,February 2014, pp.129-145, doi:10.1007/s00778-013-0317-y
[15] Dimitris Papadias, Yufei Tao, Greg Fu, and Bernhard Seeger, "An optimal and progressive algorithm for Skyline queries," Proc . the 2003 ACM SIGMOD international conference on Management of data (SIGMOD’03),ACM, pp.467–478, doi: 10.1145/872757.872814 [16] Ilaria Bartolini, Paolo Ciaccia, and Marco Patella, "Salsa: computing
the Skyline without scanning the whole sky," Proc. 15th ACM international conference on Information and knowledge management (CIKM'06), 2006, pp.405-414
[17] Parke Godfrey, Ryan Shipley, and Jarek Gryz, "Maximal vector computation in large data sets," Proc. 31st international conference on Very large data bases (VLDB'05), VLDB Endowment, 2005, pp.229-240.
[18] Ignacio Alvarez, Laura Rumbel, and Robert Adams, "Skyline: a rapid prototyping driving simulator for user experience," Proc. 7th International Conference on Automotive User Interfaces and Interactive Vehicular Applications (AutomotiveUI'15), 2015, pp.101-108, doi:10.1145/2799250.2799290
[19] Dong Young Yoon, Barzan Mozafari, and Douglas P. Brown, "DBSeer: pain-free database administration through workload intelligence," Proc. VLDB Endow. 8, 12,August 2015,pp.2036-2039.
[20] I. Kim and O. de Weck, "Adaptive weighted-sum method for bi-objective optimization: Pareto front generation," Structural and multidisciplinary optimization, 29 2,2005, pp.149-158, doi: 10.1007/s00158-004-0465-1
[21] Fay, Michael P.Proschan, Michael A., "Wilcoxon–Mann–Whitney or t-test? On assumptions for hypothesis tests and multiple interpretations of decision rules," Statistics Surveys. 4: , 2010, pp. 1– 39, doi:10.1214/09-SS051.
![Figure 1. Mobile - Cloud Database Environment [10]](https://thumb-eu.123doks.com/thumbv2/123doknet/12436820.335012/2.918.183.758.793.1084/figure-mobile-cloud-database-environment.webp)