HAL Id: hal-01740352
https://hal.archives-ouvertes.fr/hal-01740352
Submitted on 21 Mar 2018
HAL is a multi-disciplinary open access archive for the deposit and dissemination of sci-entific research documents, whether they are pub-lished or not. The documents may come from teaching and research institutions in France or abroad, or from public or private research centers.
L’archive ouverte pluridisciplinaire HAL, est destinée au dépôt et à la diffusion de documents scientifiques de niveau recherche, publiés ou non, émanant des établissements d’enseignement et de recherche français ou étrangers, des laboratoires publics ou privés.
Study of the activity of phosphorous acid as a
phosphorus plant fertilizer.
Stephane Adamowicz, José Fabre, Josiane Hostalery, Paul Robin
To cite this version:
Stephane Adamowicz, José Fabre, Josiane Hostalery, Paul Robin. Study of the activity of phosphorous acid as a phosphorus plant fertilizer.. [Contract] Rhône-Poulenc. 1996, pp.84. �hal-01740352�
Research contract between Rhône-Poulenc Agro-SA and INRA-ECHO Avignon
“STUDY OF THE ACTIVITY OF PHOSPHOROUS ACID AS A PHOSPHORUS
PLANT FERTILIZER“
Adamowicz S., Fabre J., Hostalery J., Robin P.
Abstract :
Phosphite's capacity to offset phosphorus deficiency was studied on tomato plants through four trials. Different application methods of phosphite (foliar or root) were studied in a nutrient film technique (NFT) disposal, providing optimum conditions for changes to feeding (starvation or nourishment). The ecophysiological approach aimed to characterise the growth and development of plants by the production of dry matter and the formation of the leaf surface, according to environmental conditions during the exponential phase.
The results obtained on leaf symptoms and aerial growth emphasize that phosphite is unable to replace phosphate as a phosphorus nutrient, when applied either as a foliar spray or by incorporation in the nutrient solution. What is more, its use on phosphorus deficient plants negatively affects root growth, which is detrimental in case of mineral deficiency. However phosphite does not affect aerial and root growth when plants are normally fed with phosphate.
Contents :
• Final report (9 pp);
• Preliminary report on trial N° 1 (15 pp); • Preliminary report on trial N° 2 (19 pp); • Preliminary report on trial N° 3 (17 pp); • Preliminary report on trial N° 4 (17 pp); • Report N° 5, plant phosphorus analysis (4 pp);
• Report N° 6, nutrient solution phosphate analysis (2 pp); • Appendix (1 p).
Unité de Recherche en
ECOPHYSIOLOGIE ET HORTICULTURE Domaine St
Paul - Agroparc - F84914 - Avignon cedex 9
Institut National de la Recherche Agronomique
Unité de Recherche en
ECOPHYSIOLOGIE ET HORTICULTURE Domaine St Paul - Agroparc- F84914-AVIGNON cedex 9
Research contract between Rhône-Poulenc Agro SA and INRA-ECHO Avignon "study of the activity of phosphorous acid as a phosphorus plant fertilizer"
Final report
Adamowicz S., Fabre J., Hostalery J., Robin P.
Objectives:
Phosphorus is a major element in mineral plant nutrition. It is a constituent of nucleic acids, of some lipids and sugars, and it is involved in energy transfer mechanisms1. In all cases, it
acts in the form of a phosphate. In agriculture, this element is also supplied in different forms of phosphates, whose availability is largely dependent on soil conditions (pH, presence of limestone, etc.). All studies on mineral nutrition conducted over the last fifty years using nutrient solutions also use it in this form at a concentration of approximately 1 millimolar. Phosphite is a more reduced form than phosphate, and is used as the active ingredient in a systemic fungicide. Its behaviour as a source of phosphorus for plants has been studied by soil application2,3. Results show either no effect or a slightly positive one which could be
explained by its gradual oxidation into phosphate by soil microflora4. Furthermore, a situation
of toxicity subsequent to accidental fertilisation with phosphite has also been reported5 on
maize. On avocado trees, the use of phosphite in the form of a foliar spray has been studied as a means to restore phosphorus nutrition6. According to its author, the results observed on the
biosynthesis of arginine alone are sufficient to justify phosphite's merit as a phosphate substitute. In fact, to our knowledge, there is only one recent existing publication7 on the
effect of phosphite as a replacement for phosphate when plants are grown hydroponically. It stresses the effects of increasing doses of phosphite, associated with phosphate or not, on protein content and activity of PEP phosphatase and phosphofructokinases (ATP-dependent and PPi-dependent). However, a clear negative effect is shown on growth in fresh weight of roots and aerial parts.
The contract's objective was to study phosphite's capacity to offset phosphorus deficiency using different application methods (foliar or root) and in conditions of growth where the
1Mengel K. and E. A. Kirkby, Principles of plant nutrition, International Potash Institute, 1989. 2Widdowson J. P., The use of red phosphorus as a fertiliser. N.Z.J. Sci., 1964, 7, 127-145.
3MacIntire et al., Fertilizer evaluation of certain phosphorus, phosphorous, and phospheric materials by means of
pot cultures. Agronomy Journal, 1950, 42, 543-549.
4Adams F. and J. P. Conrad, Transition of phosphite to phosphate in soils. Soil Sci., 1953, 75, 361-371. 5Lucas R. E. et al., Phosphite injury to Corn. Agronomy Journal, 1979, 7, 1063-1065.
6Lovatt C. J., A definite test to determine whether phosphite fertilization can replace phosphate fertilization to
supply P in the metabolism of Hass on Duke 7. California Avocado Society YearBook, 1990, 74, 61-64.
7Carswell C. et al., The fungicide phosphonate disrupts the phosphate-starvation response in Brassica nigra
2 oxidation of phosphite into phosphate could be deemed negligible. The principle of growth using nutrient film technique (NFT) was retained in order to eliminate all substrates and to provide optimum conditions for changes to feeding (starvation or nourishment). Tomato was chosen as a species rapidly showing the effects of different treatments. The proposed approach for analysis, of an ecophysiological type, aimed to characterise the growth and development of plants by the production of dry matter and the formation of the leaf surface, according to environmental conditions during the exponential phase. Four trials were carried out, and detailed information is available in the preliminary reports one to four.
Equipment and methodology:
Climate and mineral nutrition:
Tomato plants (Lycopersicon esculentum Mill.) were cultivated in Avignon in a heated glasshouse equipped with a misting system. Specifications for temperature were 25° C during germination and emergence (9 days), then 20° C as a minimum. Relative humidity was specified at 55%. Climatic measurements included temperature of the air under cover and of each of the nutrient solutions. Quantic photosynthetically active radiation (QPAR) was measured horizontally at crop level.
The NFT (Nutrient Film Technique) apparatus consisted of PVC tubes set up on 7 tables (6 tubes per table). Each table corresponded to one treatment and was linked to two 300 litre tanks of nutrient solution, allowing changes in phosphorus nutrition to be carried out without noticeably interrupting flow. The nutrient solutions were made-up with deionised water and pure salts and trace elements. According to treatments, phosphorus concentration (either as phosphate or phosphite) was 0.0, 0.1, 0.3 or 1.0 mmol.L-1 and special attention was paid to ensure a constant pH (5.5), conductivity (1.2 mS) and potassium concentration (3 mM). Foliar sprays were carried out with either a phosphite or a phosphate solution buffered to pH 6.3 at a final content of 24 or 12 mmol P L-1. Spraying was conducted to the point of run-off
of the solution on all leaves, so that they were completely wet. This operation always took place in the late afternoon, under the following conditions: separation of the tables with plastic curtains and use of separate sprayers for the phosphite and phosphate solutions, to avoid cross-contamination of treatments.
Harvests and measurements:
At each harvest (5 to 7 per trial), six plants were sampled from each table. Each plant was photographed in the vertical plane (focal length 100 mm) beside two 20-centimeter rulers at right angles positioned at the level of the largest leaves. After separation of the leaf blades, their total area was measured. The leaf blades and the other aerial parts were dried separately (105° C for 24 hours) and weighed. The SLA (Specific Leaf Area) was calculated as the relationship between the area and the dry matter of a leaf blade (cm2. g-1). Total phosphorus was determined by colorimetry with nitro-vanado-molybdate.
In order to lessen the effect of daily and seasonal climatic fluctuations in plotting the growth results, and also to allow comparison between different trials, the data is given as cumulative incident radiation (mol. m-2) instead of length of time passed.
Figures were created from photographs of plants whose total surface area corresponded to the average for the treatment depicted.
Symptoms:
In each of the four trials, a group of plants were submitted to phosphate starvation (8, 10 or 14 days after sowing). The characteristic symptoms of phosphorus deficiency8 (general
coloration of leaf blades turning to dark green and presence of mauvish spots) appeared 10 to 12 days later on plants receiving no phosphorus in any form, and on plants nourished with phosphite at concentrations from 0.1 mM to 1.0 mM in nutrient solution (trials 1 and 3). However, no symptoms appeared on the plants receiving phosphate (0.1 and 1.0 mM), nor on the plants receiving phosphite in combination with phosphate in nutrient solution. Foliar sprays with either phosphite or phosphate neither prevented nor delayed the appearance and the development of the visible symptoms of deficiency (trials 2 and 4).
Finally, it should be noted that roots presented specific symptoms when phosphite was used in nutrient solution or as a foliar spray. They became brownish and presented a "herring bone" appearance, probably attributable to an inhibition of the elongation of the lateral roots, whereas those of phosphate-starved and phosphate-fed plants were faintly coloured with a normal appearance.
Aerial growth:
phosphate-fed plants
In the four trials, the increase in dry matter and leaf area of the control treatments (1.0 mM phosphate) was mostly exponential in nature (cf. preliminary reports: fig. 1.2, 2.2, 3.2 and 4.2), and was only limited by incident radiation (trials 1 to 4), even when the phosphate level was lowered to 0.1 mM in the nutrient solution (cf. trial 3). In practice, the average daily increase in dry matter was of the order of 30%, which translates as a doubling of weight every 2.5 days. Total leaf area was in linear relation to total dry matter content of the plants throughout the observation periods (cf. preliminary reports: fig. 1.3, 2.3, 3.3 and 4.3). This behaviour, typical of the exponential growth phase, occurs when the various organs are in constant proportion and photosynthesis is the only limiting factor for the development of leaves.
The addition of 0.3 mM phosphite to the nutrient solution containing 1.0 mM phosphate (trial 3) or spraying 12 to 24 mM phosphite onto the leaves (trial 4) had no effect on leaf growth (cf. preliminary reports: fig. 3.5 a & b, 4.5-b).
phosphate-starved plants
For approximately 10 days following the beginning of phosphate starvation, growth was exponential and no differences appeared compared to control treatments. The slowing of growth corresponded well with the appearance of visible symptoms (cf. preliminary reports: fig. 1.5-a, 2.6-a, 3.5-a and 4.5-a). Later, the difference between control and deficient plants became more pronounced, the growth rate of the latter getting progressively slower. At final harvest, their leaf area was 6 to 28 times less than that of the control plants.
The addition of 0.1 to 1.0 mM phosphite to the phosphate-free nutrient solution (trials 1 and 3) or spraying 12 to 24 mM phosphite onto the leaves (trials 2 and 4) had no effect on leaf growth (cf. preliminary reports: fig. 1.5 a, 2.6-a, 3.5-a & b and 4.5-a). It should be noted that
8Atherton J. G. and J. Rudich, The tomato crop, a scientific basis for improvement, 1986. Chapman and Hall
4 the only means to restore a normal growth (ie no symptoms on newer leaves and normal growth rate) after 10 days of phosphate starvation, was to add phosphate to the nutrient solution (cf. preliminary report 1, fig. 1.5-b).
Specific leaf area (SLA):
The specific leaf area (SLA) is a sensitive indicator of the balance between photosynthesis and the metabolic activity responsible for growth9,10. High values are interpreted as revealing
a high use of photosynthetic products to accomplish growth and, inversely, low values reveal the existence of an inhibiting factor. The SLA value is dependent on genetic and numerous environmental parameters. In particular, mineral deficiencies lower its value11.
phosphate-fed plants
In all trials, except on very young plants (trial 3, harvest 1), the SLA values for the control plants were of the order of 500 cm2.g-1 (between 450 and 650, according to the trial) and were not affected by lowering phosphate concentration to 0.1 mM in the nutrient solution (cf. preliminary reports 3: fig. 3.6-a & b).
Spraying phosphite (12 and 24 mM) onto the leaves was also without effect. However, the addition of phosphite to the solution at 0.3 mM resulted in a slight (10-15%) increase of the SLA (cf. preliminary report 3: fig. 3.6-a).
phosphate-starved plants
Ten days after the beginning of phosphate starvation, the SLA appeared to be strongly depressed and reached low levels, around 300 cm2.g-1 (between 250 and 450, according to the
trial).
In three trials the depressive effect of phosphate starvation was accentuated by the use of phosphite in the nutrient solution or as a foliar spray (cf. preliminary reports: fig. 1.6-a, 3.6-b and 4.6-a). In trial 2 there was no effect of foliar sprays of phosphite. It must be pointed out that, inversely, the use of phosphate as foliar sprays (cf. preliminary reports 2: fig. 2.7-a & b) stopped the decrease of SLA at an intermediary level between control and starved plants and that its restitution in the nutrient solution of starved plants restored the SLA to the level of control plants within 5 days (cf. preliminary reports 1: fig. 1.6-b).
Root growth:
phosphate-fed plants
Root growth was not studied in the first trial, but was investigated in the three others. In the control plants (1.0 mM phosphate), root dry weight was in linear relation to aerial dry weight, which resulted in a near constant proportion (10%) of the roots (cf. preliminary reports: fig. 2.4, 3.4, 4.4). The consequence was that the root dry matter accumulation as a function of cumulative lighting presented the same characteristics as the development of leaf area (cf.
9Gary C. and N. Bertin, La surface spécifique foliaire comme indicateur de l'équilibre source-puits chez la
tomate. Bull. Soc. Ecophysiol., 1992, XVII, 121-127.
10Gary C., J. W. Jones, J. J. Longuenesse, Modelling daily changes in specific leaf area of tomato: the
contribution of the leaf assimilate pool. In Acta Horticulturae of ISHS, 1993, No. 328, 205-210.
11Dijkstra P., Cause and effect of differences in specific leaf area. In Causes and consequences of variation in
growth rate and productivity of higher plants, 1993, SPB Academic Publishing, The Hague, H. Lambers editor, 125-140.
In contrast to leaf surface, where no effect of 0.3 mM phosphite in the nutrient solution was observed in the presence of phosphate, the root biomass was lower (23%) than the control plants (cf. preliminary report 3: fig. 3.7-a & b). A similar effect was observed when phosphite was applied as a foliar spray (cf. preliminary report 4: fig. 4.7-b & 4.8-b). In relative value, roots represented 8% of total biomass.
phosphate-starved plants
In contrast to leaf expansion, elongation of the main root was only slightly affected by phosphate starvation (75 cm instead of 85 cm after 15 days of starvation in trial 4). On a root dry matter basis, phosphorus deficiency strongly favours root growth relatively to aerial growth. According to the trial, root proportion reached between 20% an 30% at final harvest, after 15 to 20 days of starvation, instead of 10% in control plants. Foliar sprays of phosphate did not noticeably change the root behaviour of starved plants.
Root biomass in plants receiving 0.1 mM to 1.0 mM phosphite in nutrient solution was consistently lower in absolute value than that of plants completely deprived of phosphorus (cf. preliminary report 3: fig. 3.7-a). As a consequence of this phosphite inhibition of root growth stimulation by phosphate starvation, after 22 days of phosphite application, the roots represented only 5% of the aerial dry matter. This effect was also observed when phosphite was applied by foliar spray, and was even more marked for root elongation which responded to phosphite concentration (cf. preliminary report 4: fig. 4.9-a). Furthermore, a decrease in the length of the main root was observed at final harvest, probably due to root death. This observation is linked to the visible symptoms on the roots.
Total phosphorus content:
phosphate-fed plants
In control plants, total phosphorus content was around 0.8% of leaf dry matter (cf preliminary report 5: fig 5.1-a & b). This content was not significantly affected either by phosphate concentration in the nutrient solution (0.1 mM or 1.0 mM), or by the phosphite addition (1.0 mM phosphate + 0.3 mM phosphite). The root phosphorus content was higher, around 1.4%, and, as for the leaves, was not affected by foliar sprays of phosphite (cf preliminary report 5: fig 5.2-a & b).
phosphate-starved plants
Phosphate starvation led to low levels of total phosphorus content in leaves, below 0.2%, and in roots, around 0.4% (cf preliminary report 5: fig 5.1-a & b, fig 5.2-a & b).
Application of phosphite in the nutrient solution, whatever its concentration (0.1 mM to 1.0 mM), maintained the total phosphorus content in the leaves of phosphate-starved plants at the same level as in the control plants (cf preliminary report 5: fig 5.1-a & b). Conversely, foliar sprays of either phosphate or phosphite were without effect on total root phosphorus content of phosphate-starved plants. After 10 days of phosphorus deprivation, the restitution of phosphite and phosphate, during 5 or 7 days, led to an increase of total leaf phosphorus content. However, if phosphite or phosphate was added at a similar concentration to the solution, the amplitude of the increase was completely different. Phosphite restitution led to a
6 lower level than control plants, and phosphate restitution to a higher level. This last observation is in concordance with published data12.
Conclusions:
The following table and figures summarize the results obtained from the four trials. They emphazise that phosphite is unable to replace phosphate as a phosphorus nutrient, when applied either as a foliar spray or by incorporation in the nutrient solution. What is more, its use on phosphorus deficient plants negatively affects root growth, which is detrimental in case of mineral deficiency. - PO4sol - PO4sol + PO4spray - PO4sol + PO3spray - PO4sol + PO3sol + PO4sol + PO3spray + PO4sol + PO3sol
leaf symptoms yes yes yes yes no no
root symptoms no no yes yes no yes
aerial growth reduced reduced reduced reduced no effect no effect root growth stimulated stimulated reduced reduced no effect no effect
12 Sanders F.E., Modelling plant growth responses to vesicular arbuscular mycorrhizal infection. Advances in
0 500 1000 1500 2000 2500 3000 0,0 0,1 0,2 0,3 0,4 0,5 0,6 0,7 0,8 0,9 1,0 1,1 1,2 1,3 m ea n t ot al le af a re a (c m 2. pl ant -1) phosphorus concentration (mM)
effect of phosphorus concentration and form (PO4 or PO3) in nutrient solution on
leaf area of 30 day old tomato plants (trial 3).
0 10 20 30 40 50 60 70 80 8 11 14 17 20 23 26 m ea n m ai n root le ngt h (c m ) time (days)
-PO4 sol -PO4 sol + 24 mM PO4 leaf -PO4 sol + 12 mM PO3 leaf -PO4 sol + 24 mM PO3 leaf
effect of phosphorous foliar sprays on mean main root length of tomato plants starved of phosphate from day 10 (trial 4).
8
Symptoms of phosphate deprivation since day 8, as observed on 22 day old tomato plants (trial 3). Notice the shorter length, the brownish colour and “herring bone“ appearance of the roots of
Research contract between Rhône-Poulenc Agro-SA and INRA-ECHO Avignon
“STUDY OF THE ACTIVITY OF PHOSPHOROUS ACID AS A PHOSPHORUS
PLANT FERTILIZER“
Preliminary report : trial N° 1
Adamowicz S., Fabre J., Hostalery J., Robin P.
Unité de Recherche en
ECOPHYSIOLOGIE ET HORTICULTURE Domaine St Paul - Agroparc - F84914 - Avignon cedex 9
Institut National de la Recherche Agronomique
Domaine St Paul - Agroparc- F84914-AVIGNON cedex 9
Research contract between Rhône-Poulenc Agro SA and INRA-ECHO Avignon "study of the activity of phosphorous acid as a phosphorus plant fertilizer"
Preliminary report on trial No. 1
Adamowicz S., Fabre J., Hostalery J., Robin P
Objectives:
Phosphorus is a major element in mineral plant nutrition. It is a constituent of nucleic acids, of some lipids and sugars, and it is involved in energy transfer mechanisms1. In all cases, it
acts in the form of a phosphate. In agriculture, this element is also supplied in different forms of phosphates, whose availability is largely dependent on soil conditions (pH, presence of limestone, etc.). All studies on mineral nutrition conducted over the last fifty years using nutrient solutions also use it in this form at a concentration of approximately 1 millimolar. Phosphite is a more reduced form than phosphate, and is used as the active ingredient in a systemic fungicide. Its behaviour as a source of phosphorus for plants has been studied in soil application2,3. Results show either no effect or a slightly positive one which could be
explained by its gradual oxidisation into phosphate by soil microflora4. Furthermore, a
situation of toxicity subsequent to accidental fertilisation with phosphite has also been reported5 on maize. On avocado trees, the use of phosphite in the form of a foliar spray has
been studied as a means to restore phosphorus nutrition6. According to its author, the results
observed on the biosynthesis of arginine alone are sufficient to justify phosphite's merit as a phosphate substitute. In fact, to our knowledge, there is only one recent existing publication7
on the effect of phosphite as a replacement for phosphate when plants are grown hydroponically. It stresses the effects of increasing doses of phosphite, associated with phosphate or not, on protein content and activity of PEP phosphatase and phosphofructokinases (dependant ATP and PPi-dependent). However, a clear negative effect is shown on growth in fresh weight of roots and aerial parts.
1Mengel K. and E. A. Kirkby, Principles of plant nutrition, International Potash Institute, 1989. 2Widdowson J. P., The use of red phosphorus as a fertiliser. N.Z.J. Sci., 1964, 7, 127-145.
3MacIntire et al., Fertilizer evaluation of certain phosphorus, phosphorous, and phospheric materials by means of pot cultures. Agronomy Journal, 1950, 42, 543-549.
4Adams F. and J. P. Conrad, Transition of phosphite to phosphate in soils. Soil Sci., 1953, 75, 361-371. 5Lucas R. E. et al., Phosphite injury to Corn. Agronomy Journal, 1979, 7, 1063-1065.
6Lovatt C. J., A definite test to determine whether phosphite fertilization can replace phosphate fertilization to supply P in the metabolism of Hass on Duke 7. California Avocado Society YearBook, 1990, 74, 61-64.
7Carswell C. et al., The fungicide phosphonate disrupts the phosphate-starvation response in Brassica nigra seedlings. Plant Physiol., 1996, 110, 105-110.
2
report trial 1 - phosphorous acid - Rhône-Poulenc agro SA - INRA ECHO - june 18th 1996
The contract's objective was to study phosphite's capacity to offset phosphorus deficiency using different application methods (foliar or root) and in conditions of growth where the oxidisation of phosphite into phosphate could be deemed negligible. The principle of growth using nutrient film technique (NFT) has been retained in order to eliminate all substrates and to provide optimum conditions for changes to feeding (starvation or nourishment). Tomato was chosen as a species rapidly showing the effects of different treatments. The proposed approach for analysis, of an ecophysiological type, aimed to characterise the growth and development of plants by the production of dry matter and the formation of the leaf surface, according to environmental conditions during the exponential phase. The first trial concerned the capacity for providing phosphorus through feeding by nutrient solution.
Equipment and methodology:
Climate:
The tomato plants (Lycopersicon esculentum Mill., cv Rondello F1, De Ruiter seeds, Bleiswijk-Holland) were cultivated in Avignon in a heated glasshouse equipped with a mist spray during the period from February 9 (sowing) to March 11 1996 (final harvest). Specifications for temperature were 25° C during germination and emergence (9 days), then 20° C. Relative humidity was specified at 55%.
Climatic measurements included temperature (platinum probes PT 100) of air under cover and of each of the nutrient solutions. Quantic photosynthetically active radiation (QPAR) was measured horizontally at crop level (quantum sensor type QS, DELTA-T DEVICES, wave band from 400 to 700 nm, sensitivity 10.0 mv per mmol.m-2.s-1). Measurements were taken every minute and the average recorded at set intervals on a data collection station (Delta-Logger, DELTA-T DEVICES).
Mineral nutrition and treatments:
The NFT (Nutrient Film Technique) apparatus consisted of PVC tubes (L 2m x diam. 3.2 cm) set up on 5 tables (6 tubes per table). Each tube was pierced with seven sets of three holes, evenly spaced, into which were inserted culture tubes in which the seeds were sown directly (one seed per pot). Twelve days after sowing, thinning was carried out to leave only one seedling per group of three holes. The plants to be retained in the apparatus were selected according to visible homogeneity criteria based on the length of the first leaf.
Each table corresponded to one treatment and was linked to two 300 liter tanks of nutrient solution, allowing changes in phosphorus nutrition to be carried out without noticeably interrupting flow. Flow was maintained by centrifugal pumps (one per tank) with a flow rate in the region of 0.6 L.mn-1 in each tube. During the changeover of nutrition, flow was interrupted for approximately 5 minutes while the growing tubes were drained of the old nutrient solution, then re-established from the new tank. The first thirty litres of solution were flushed into the drain in order to rinse the growing plugs and the roots with the new solution. The nutrient solutions were made-up with deionised water and the following pure salts: Ca(NO3)2 1.5 mM; CaSO4 2.0 mM; MgSO4 1.5 mM; EDTA-Fe 43 !M; trace elements
following Kanieltra formula 6 Fe (O.1 ml. L-1). In addition to the above elements, the following salts were added according to treatment: phosphorus-free solution K2SO4 1.5 mM;
solution with phosphate, K2SO4 1.0 mM and KH2PO4 1.0 mM; solution with phosphite,
K2SO4 0.83 mM and phosphite 1.0 mM in both mono- and di-potassic form. The final
• from the 14th day: table III was fed with a solution in which phosphate was replaced by phosphite, and tables IV, V and VI with a phosphorus-free solution;
• from the 24th: phosphorus was re-introduced in the form of phosphite for table V and in the form of phosphate for table VI.
Harvest and measurements;
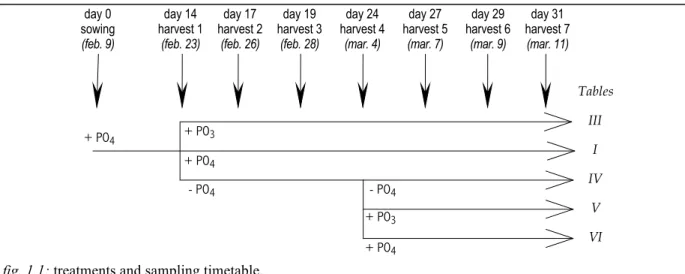
Seven harvests were carried out on the dates indicated in figure 1.1.
At each harvest, six plants were sampled from each table (one per culture tube). Each plant was photographed in the vertical plane (focal length 100 mm) beside two 20-centimetre rulers at right angles positioned at the level of the largest leaves. After separation of the leaf blades, their total area was measured (LI-3000A area meter with LI-3050A transparent belt conveyor, LI-COR, inc.). The leaf blades and the other aerial parts were put to dry separately in the drying oven at 105° C for 24 hours. The dry matter was determined by weighing to the nearest 0.1 mg (METTLER AE 260Delta Range scales, Serial No.: N57796). The SLA (Specific Leaf Area) was calculated as the relationship between the area and the dry matter of a leaf blade (cm2. g.-1). Dry matter per plant was counted as the sum of dry matter from the leaf blades and the rest of the aerial parts (g. plant-1).
In order to lessen the effect of daily climatic fluctuations in plotting the growth results, and also to allow comparison between different trials, the data is given as cumulative incident radiation (mol. m-2) instead of length of time passed.
Figures were created from photographs of plants whose total surface area corresponded to the average for the treatment depicted.
Results:
Characterisation of control treatment:
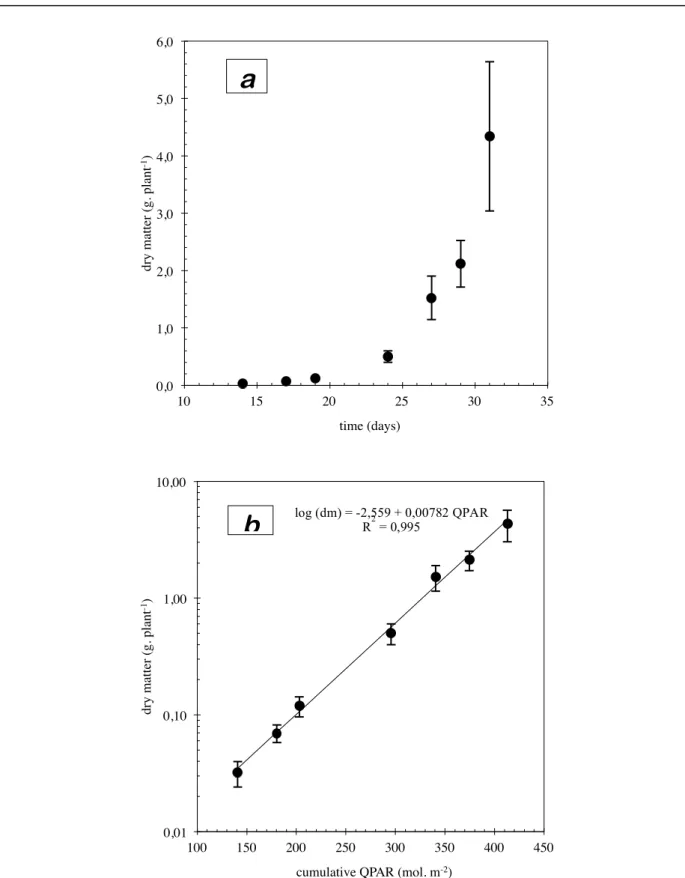
The plants grown in complete nutrient solution (with phosphate, table I) showed rapid growth (fig. 1.2-a) during the observation period. From the 14th to the 31st day of growth, total dry matter of aerial parts increased by a factor of 140 (from 0.03 to 4.34 g per plant). The increase in the dry matter logarithm (fig. 1.2-b) was a linear function of cumulative incident radiation. It shows that:
• a) this growth is exponential in nature. In practice, the average daily increase in dry matter was 29%, which translates as a doubling of weight every 2.4 days.
• b) incident radiation was the only factor limiting growth in these experimental conditions, and, in particular, no limitation caused by mineral nutrition was observed.
Total leaf area was in linear relation to total dry matter content of the plants throughout the observation period (fig. 1.3). This behaviour, typical of the exponential growth phase, occurs
4
report trial 1 - phosphorous acid - Rhône-Poulenc agro SA - INRA ECHO - june 18th 1996
when the various organs are in constant proportion and that photosynthesis is the only limiting factor for the development of leaves.
Growth is the end result of two successive functions, photosynthesis (producing sugars and increasing the weight of dry material) and the use of these sugars to increase the quantity and size of the organs. Later will be illustrated the effect of phosphorus treatments through the evolution of the total leaf area which provides an indication of growth. Furthermore, it is the objective criterion which best corresponds to the visual evaluation an observer can make of the crop.
Effects of phosphite and the absence of phosphate in nutrient solution:
Figure 1.4 shows the evolution of the total leaf area per plant on each cultivation table. Until the first harvest, on the fourteenth day, all the plants received the same nutrition, with phosphate. On this date, however, a difference in leaf area was recorded between tables. It was the result of a heterogeneous germination rate in the greenhouse attributable to the temperature gradient caused by the heating system. After germination, this gradient had little effect on growth, which depends mainly on radiation, and, here, on mineral nutrition. In a period of exponential growth, the effect of heterogeneous germination showed as a group of parallel lines in the semi-logarithmic representations of growth. Figure 1.4 shows that in fact, at the time of the first three harvests, the difference between the results for different tables stayed generally the same, which means that during this period the nutritional treatments produced no noticeable effect on the increase in leaf area.
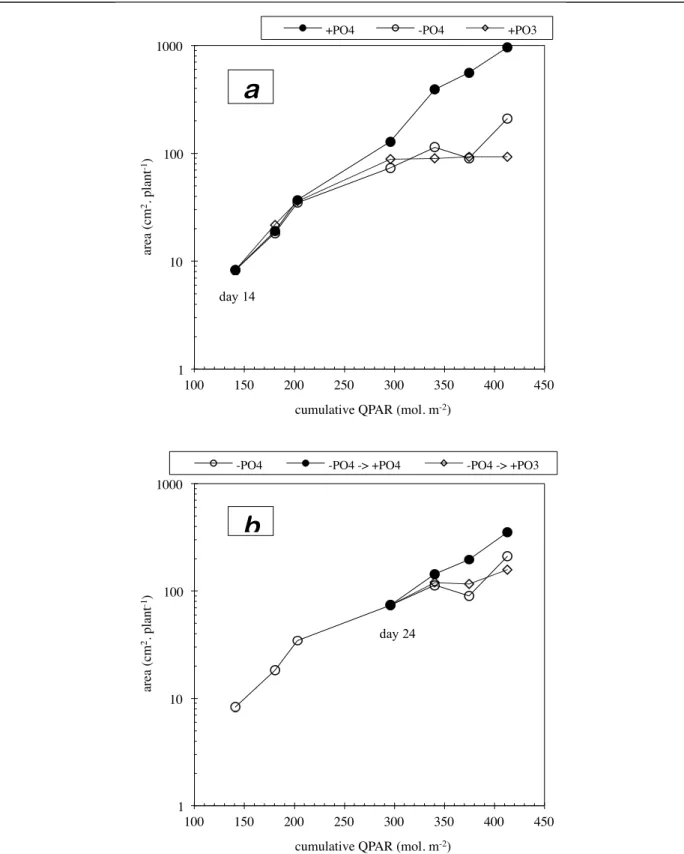
Figure 1.5 represents the evolution of leaf area against nutritional treatment. The bias mentioned for figure 1.4 has been corrected by carrying the difference measured between each table and the overall average at the first harvest, to all later harvest dates. This correction does not affect the shape of the growth curves. It can be seen that on the first three harvest dates (fig. 1.5-a), no difference appeared between the three treatments (with phosphate, without phosphorus, with phosphite). During this period, no visible symptoms of deficiency were shown. These symptoms, a general dark green coloration and numerous small mauvish spots characteristic of phosphorus deficiency8, appeared simultaneously in all phosphate-free
treatments, on March 2, two days before the fourth harvest. At that time, the two phosphate-free treatments (with and without phosphite) showed a diminished growth in leaf area compared to the control (fig 1.5-a and plate 1.I). Thus the appearance of visible symptoms corresponded well with a slowing of growth.
Later, from the fourth to the seventh harvest, the absence of phosphate and phosphite in the solution lead to an accentuated slowing of growth compared to the control, without however causing a complete absence of growth (figure 1.5-a). This shows that the plants had not yet completely exhausted their reserves of phosphorus. The fall in leaf area observed at the sixth harvest could be attributed to a problem in sampling (the variation coefficient was 29% instead of 15%). On the other hand, the presence of phosphite in the nutrient solution completely blocked growth from the fourth harvest onwards, i.e. from the appearance of symptoms of phosphorus deficiency. At the time of the last harvest, leaf area of the plants
8Atherton J. G. and J. Rudich, The tomato crop, a scientific basis for improvement, 1986. Chapman and Hall Ltd, New York.
deficiency spots multiplied, and their size continued to increase.
From the fourth harvest onwards (24th day of growth), two of the tables receiving phosphate-free treatment were given nutrition with phosphate and phosphite respectively, in order to ascertain the ability of these molecules to restore a normal phosphorus status in plants already deficient. Restoration by the phosphate ion showed at the fifth harvest by a) the appearance of new leaves showing no symptoms of deficiency, and b) a considerable increase in size, followed by the drying up of deficiency spots on old leaves that were already affected. The resumption of growth lead, at the seventh harvest, to a final leaf area 70% higher than that of deficient plants (fig 1.5-b). Between the last two harvests, the gradient was almost the same as that of the control plants, which shows that they resumed normal growth. These plants are only distinguished from the control by being delayed. In contrast to nourishment with phosphate, phosphite had no positive effect on leaf area (fig. 1.5-b). On the final harvest date, this treatment, on the contrary, produced a leaf area 33% lower than that of deficient plants receiving no phosphite. This could be the first sign of a blockage of growth by phosphite as described above.
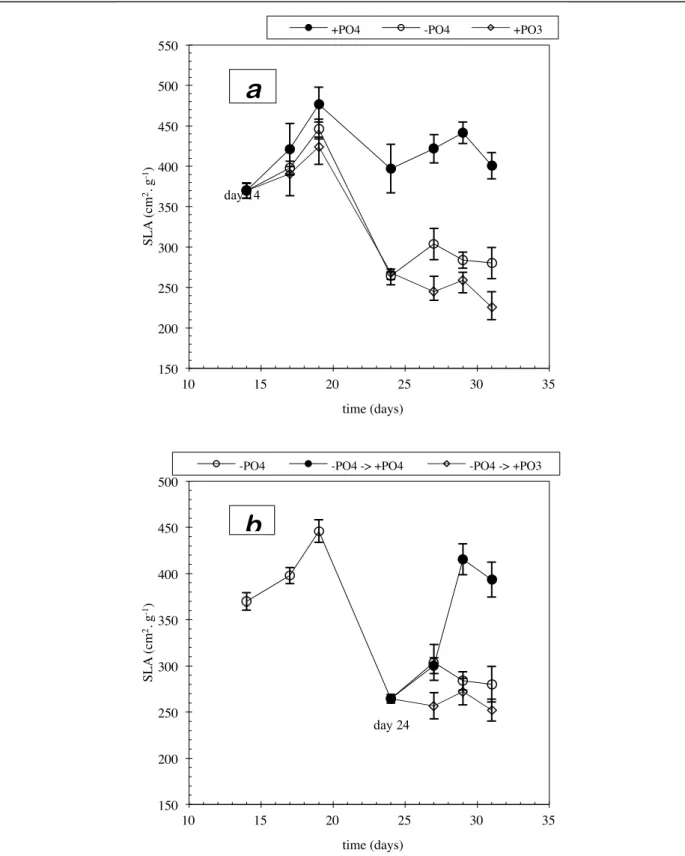
The specific leaf area (SLA) is a sensitive indicator of the balance between photosynthesis and the metabolic activity responsible for growth9,10. High values are interpreted as revealing
a high use of photosynthetic products to accomplish growth and, inversely, low values reveal the existence of an inhibiting factor. The SLA value is dependent on genetic and numerous environmental parameters. In particular, mineral deficiencies lower its value11. Figure 6
shows the evolution of the SLA against nutritional treatments. It shows that compared to the control (fig. 1.6-a), the absence of phosphate in the solution had a depressive effect on the SLA value from the second harvest, i.e. three days after the application of the treatment and five days before the appearance of visible symptoms. This depressive effect increased up until the fourth harvest when it bottomed out for all phosphate-free treatments, with or without phosphite (fig. 1.6-a). From the fourth harvest onwards, only the restoration of phosphorus status by phosphate allowed the SLA to rise (fig. 1.6-b). At the last harvest, the value had reached that of the control, which confirms that at that time the plants had resumed normal growth. In contrast, the restoration of phosphorus using phosphite maintained the SLA at its bottom value (fig. 1.6-b).
Conclusions:
The conditions under which this trial was conducted made it possible to compare the effect of phosphite to a control treatment whose nutrition had been verified as not limiting growth, and
9Gary C. and N. Bertin, La surface spécifique foliaire comme indicateur de l'équilibre source-puits chez la tomate. Bull. Soc. Ecophysiol., 1992, XVII, 121-127.
10Gary C., J. W. Jones, J. J. Longuenesse, Modelling daily changes in specific leaf area of tomato: the contribution of the leaf assimilate pool. In Acta Horticulturae of ISHS, 1993, No. 328, 205-210.
11Dijkstra P., Cause and effect of differences in specific leaf area. In Causes and consequences of variation in growth rate and productivity of higher plants, 1993, SPB Academic Publishing, The Hague, H. Lambers editor, 125-140.
6
report trial 1 - phosphorous acid - Rhône-Poulenc agro SA - INRA ECHO - june 18th 1996
to a phosphorus deficient treatment. Since a molecule's nutritional value is defined in terms of its effect on growth, measurements were taken of the production of dry matter (not shown here), the increase in leaf area, and the specific leaf area (SLA). On the basis of these criteria, phosphite proved incapable both of acting as a phosphate substitute and of relieving a phosphate deficiency (plates 1.I and 1.II). However, a supply of phosphate rapidly re-establishes normal growth in deficient plants. Equally, visible symptoms of phosphorus deficiency appeared simultaneously on all plants starved of phosphate, whether or not phosphite was present.
Not only was phosphite unable to relieve a phosphate deficiency, but it strongly inhibited growth. Finally, certain additional observations showed a specific effect of phosphite on plants:
• it inhibited root elongation, in contrast to a simple phosphate deficiency which stimulated it (plate 1.III).
• the roots presented a "herring bone" appearance, probably attributable to an inhibition of the elongation of the lateral roots.
• plants receiving phosphite were easily recognisable because of the oblique angle of their leaves throughout the day. In contrast, the plants deficient in phosphate and the control plants had slightly drooping leaves during the day, which is their normal appearance. Since the leaf angle results from the leaf's turgidity, it is probable that phosphite acts as a transpiration inhibitor.
fig. 1.1: treatments and sampling timetable. day 0 sowing (feb. 9) day 14 harvest 1 (feb. 23) day 17 harvest 2 (feb. 26) day 19 harvest 3 (feb. 28) day 24 harvest 4 (mar. 4) day 27 harvest 5 (mar. 7) day 29 harvest 6 (mar. 9) day 31 harvest 7 (mar. 11) III I IV V VI Tables + PO4 + PO4 + PO3 - PO4 - PO4 + PO3 + PO4
8
report trial 1 - phosphorous acid - Rhône-Poulenc agro SA - INRA ECHO - june 18th 1996
fig. 1.2: growth of dry matter in the control plants (table I, with phosphate). The bars represent the 95%
confidence intervals. • a) natural co-ordinates; • b) semi-logarithmic co-ordinates. 0,0! 1,0! 2,0! 3,0! 4,0! 5,0! 6,0! 10! 15! 20! 25! 30! 35! dry m at te r (g. pl ant -1)! time (days)! 0,01! 0,10! 1,00! 10,00! 100! 150! 200! 250! 300! 350! 400! 450! dry m at te r (g. pl ant -1)!
cumulative QPAR (mol. m-2)!
log (dm) = -2,559 + 0,00782 QPAR R2 = 0,995
a
fig. 1.3: logarithmic representation of the relationship between total leaf area * dry matter of control plants (table I, with phosphate). 1! 10! 100! 1000! 10000! 0,01! 0,10! 1,00! 10,00! tot al l ea f a re a (c m 2. pl ant -1)!
dry matter (g. plant-1)!
area = 292 dm0,97 R2 = 0,996
10
report trial 1 - phosphorous acid - Rhône-Poulenc agro SA - INRA ECHO - june 18th 1996
fig. 1.4: semi-logarithmic representation of the growth in leaf area as a function of the cultivation table.
• a) tables I, III and IV, with phosphate, phosphite and phosphate-less nutrition respectively, from day 14; • b) tables IV, V and VI, with phosphate-less nutrition from day 14 to 23. From day 24, phosphate-less,
phosphite, and phosphate nutrition respectively. 1! 10! 100! 1000! 10000! 100! 150! 200! 250! 300! 350! 400! 450! are a (c m 2. pl ant -1)!
cumulative QPAR (mol. m-2)!
I! III! IV! Tables :! 1! 10! 100! 1000! 100! 150! 200! 250! 300! 350! 400! 450! are a (c m 2. pl ant -1)!
cumulative QPAR (mol. m-2)!
IV! V! VI! Tables :!
a
b
day 14 day 24 day 14fig. 1.5: semi-logarithmic representation of the growth in leaf area as a function of nutritional treatment.
• a) phosphate, phosphate-less and phosphite nutrition from day 14;
• b) phosphate-less nutrion from day 14 to 23. From day 24, phosphate-less, phosphate and phosphite nutrition. 1! 10! 100! 1000! 100! 150! 200! 250! 300! 350! 400! 450! are a (c m 2. pl ant -1)!
cumulative QPAR (mol. m-2)!
+PO4! -PO4! +PO3!
1! 10! 100! 1000! 100! 150! 200! 250! 300! 350! 400! 450! are a (c m 2. pl ant -1)!
cumulative QPAR (mol. m-2)!
-PO4! -PO4 -> +PO4! -PO4 -> +PO3!
b
a
day 14
12
report trial 1 - phosphorous acid - Rhône-Poulenc agro SA - INRA ECHO - june 18th 1996
fig. 1.6: representation of the SLA (specific leaf area) by nutritional treatment. The vertical bars represent the
95% confidence intervals.
• a) phosphate, phosphate-less and phosphite nutrition from day 14;
• b) phosphate-less nutrion from day 14 to 23. From day 24, phosphate-less, phosphate and phosphite nutrition. 150! 200! 250! 300! 350! 400! 450! 500! 550! 10! 15! 20! 25! 30! 35! S L A (c m 2. g -1)! time (days)!
+PO4! -PO4! +PO3!
a
150! 200! 250! 300! 350! 400! 450! 500! 10! 15! 20! 25! 30! 35! S L A (c m 2. g -1)! time (days)!-PO4! -PO4 -> +PO4! -PO4 -> +PO3!
b
day 14
plate 1.I: photographs of plants on march 4th (harvest 4, day 24); a), b) and c) are plants grown with phosphate, phosphite, and without phosphorus respectively, from day 14.
14
report trial 1 - phosphorous acid - Rhône-Poulenc agro SA - INRA ECHO - june 18th 1996
plate 1.II: photographs of plants on march 11th (harvest 7, day 31); a), b) and c) are plants grown with phosphate,
phosphite, and without phosphate respectively, from day 14; d) and e) are plants grown without phosphate from day 14 to 24, and from day 14 to 31 with phosphite and phosphate respectively.
plate 1.III: photograph of plants on march 4th (harvest 4, day 24). Table I, full nutrient solution (with phosphate); Table IV, phosphorus-free solution; Table III, phosphite solution.
Research contract between Rhône-Poulenc Agro-SA and INRA-ECHO Avignon
“STUDY OF THE ACTIVITY OF PHOSPHOROUS ACID AS A PHOSPHORUS
PLANT FERTILIZER“
Preliminary report : trial N° 2
Adamowicz S., Fabre J., Hostalery J., Robin P.
Unité de Recherche en
ECOPHYSIOLOGIE ET HORTICULTURE Domaine St Paul - Agroparc - F84914 - Avignon cedex 9
Institut National de la Recherche Agronomique
Domaine S Paul - Agroparc- F84914-AVIGNON cedex 9
Research contract between Rhône-Poulenc Agro SA and INRA-ECHO Avignon "study of the activity of phosphorous acid as a phosphorus plant fertilizer"
Preliminary report on trial No. 2
Adamowicz S., Fabre J., Hostalery J., Robin P.
Objectives:
The second trial's objective was to study phosphite's capacity to restore phosphorus nutrition when sprayed onto the leaves of plants prepared in conditions similar to those for trial 1. Information characteristic of trial 2 is underlined in the text.
Equipment and methodology:
Climate:
The tomato plants (cf. trial 1) were cultivated under glass treated with shading during the period from March 28 (sowing) to April 15 1996 (last harvest). Climatic measurements were taken as in trial 1.
Mineral nutrition and treatments:
Cultivation by NFT was carried out on an apparatus comprising 7 tables. Sowing and thinning protocols were identical to trial 1.
The nutrient solutions were made-up in the same way as before with a common base of Ca(NO3)2
1.5 mM, CaSO4 2.0 mM, MgSO4 1.5 mM, EDTA-Fe 43 !M, trace elements following Kanieltra
formula 6 Fe (0.1 ml L-1). The following salts were added according to treatment: phosphorus-free solution K2SO4 1.5 mM; solution with phosphate, K2SO4 1.0 mM and KH2PO4 1.0 mM. The
final potassium content was 3 mM for all solutions, pH was 5.5 and conductivity 1.2 mS.
Foliar sprays were carried out with either a phosphite or a phosphate solution. The phosphite solution was produced through dilution (106 times) of a parent solution of phosphorous acid at 212 g L-1 buffered to pH 6.4 by KOH. The phosphate solution was obtained by dissolving 2.32 g mono-potassic phosphate and 1.53 g di-potassic phosphate per liter of de-ionised water. The two spray solutions had a final content of 24 mmol P L-1 and 33 mmol K L-1, and their final pH was 6.3. Spraying was conducted to the point of run-off of the solution on all leaves, so that they were completely wet. This operation always took place in the late afternoon, under the following conditions: separation of the tables with plastic curtains and use of separate sprayers for the
2
report trial 2 - phosphorous acid - Rhône-Poulenc agro SA - INRA ECHO - july 10th 1996
phosphite and phosphate solutions, to avoid cross-contamination of treatments; plugging of open holes in the culture tubes to prevent contamination of the nutrient solutions.
The treatment timetable (fig. 2.1) contained three phases:
• 1) from sowing to the 9th day: all tables were fed with a solution containing phosphate;
• 2) from the 10th day: tables I to VI were fed with a phosphorus-free solution, table III receiving foliar sprays of phosphate and table V foliar sprays with phosphite;
• 3) from the 22nd day: phosphorus was re-introduced in the form of phosphate in the solution on table II; from the 23rd day, it was provided by foliar sprays in the form of phosphate on table
IV and phosphite on table VI.
Harvest and measurements;
Seven harvests were carried out on the dates indicated in figure 2.1; measurements were taken according to the protocol for trial 1. The dry matter of the leaf blades, of the rest of the aerial parts and of the roots (sorted by table) were weighed to the nearest 0.01 mg (METTLER AE 163, Serial No.: D31302).
Results:
Characterisation of control treatment:
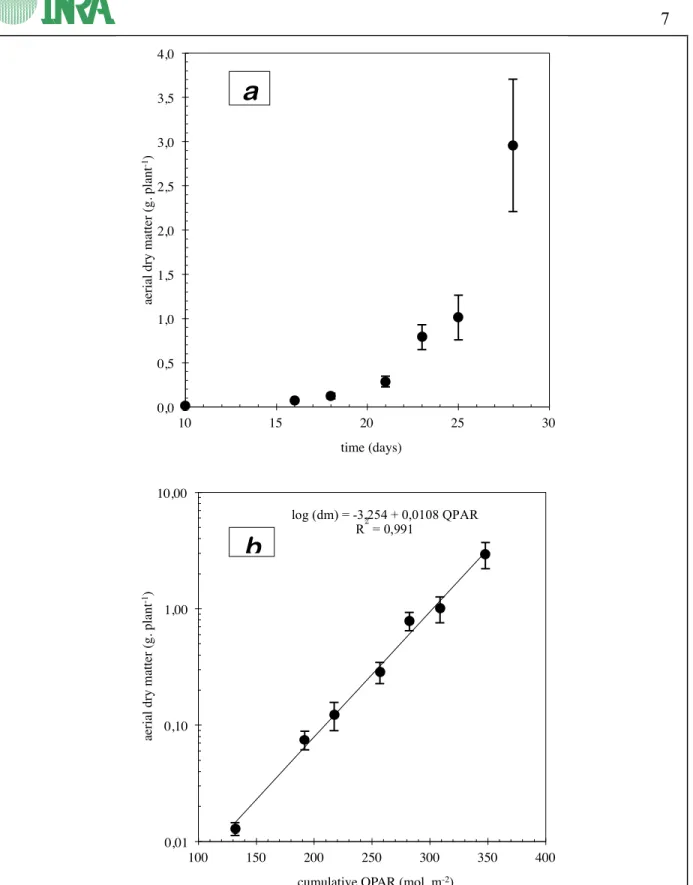
The plants grown in complete nutrient solution (with phosphate, table VII) showed rapid growth (fig. 2.2-a) during the observation period. From the 10th to the 28th day of growth, total dry matter of aerial parts increased by a factor of 230 (from 0.013 to 2.96 g per plant). The increase in the dry matter logarithm (fig. 2.2-b) is a linear function of cumulative incident radiation. It shows that:
• a) growth is still exponential in nature. In practice, the average daily increase in dry matter was 30%, slightly higher than for trial 1, which translates as a doubling of weight every 2.3 days.
• b) incident radiation is the only factor limiting growth under these experimental conditions, and, in particular, no limitation caused by mineral nutrition was observed.
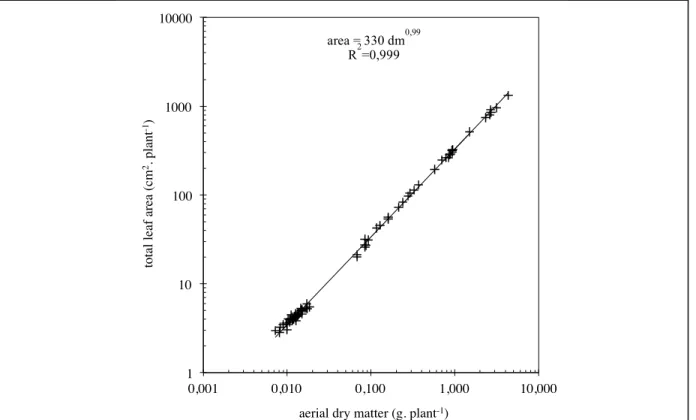
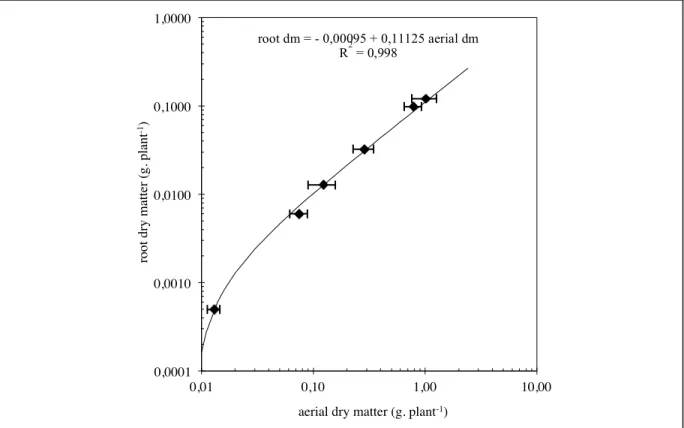
Total leaf area is as in trial 1, in linear relation to the aerial dry matter of the plants (fig. 2.3). Results obtained from roots in trial 2 show furthermore that their dry matter weight is also in linear relation to the aerial dry matter (fig. 2.4).
Heterogeneity:
Figure 2.5 shows that at the beginning of growth , heterogeneity between tables (variation coef. 19%), was lower than in trial 1 (variation coef. 23%). This being the case, to eliminate the bias due to initial heterogeneity, the leaf area data was adjusted using the same method as for trial 1. Discussion of leaf area results are therefore based on the standardized data.
Effect of treatments on leaf surface:
Effect of spraying conducted from day 10
Four different treatments were used from the 10th day of growth (fig. 2.6-a) in order to characterise the effect of phosphorus deficiency compared to standard phosphate nutrition and to assess the ability of foliar applications of phosphate or phosphite to maintain normal growth.
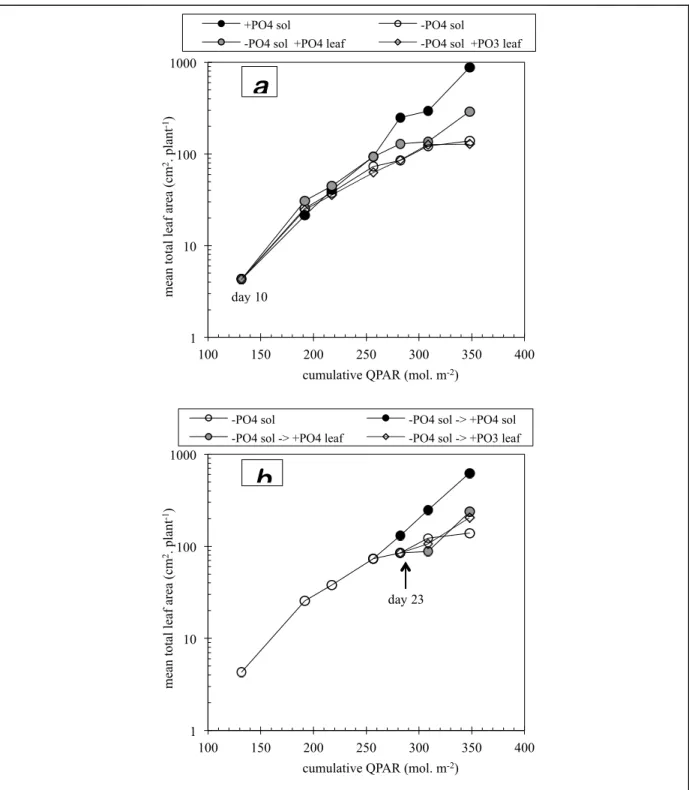
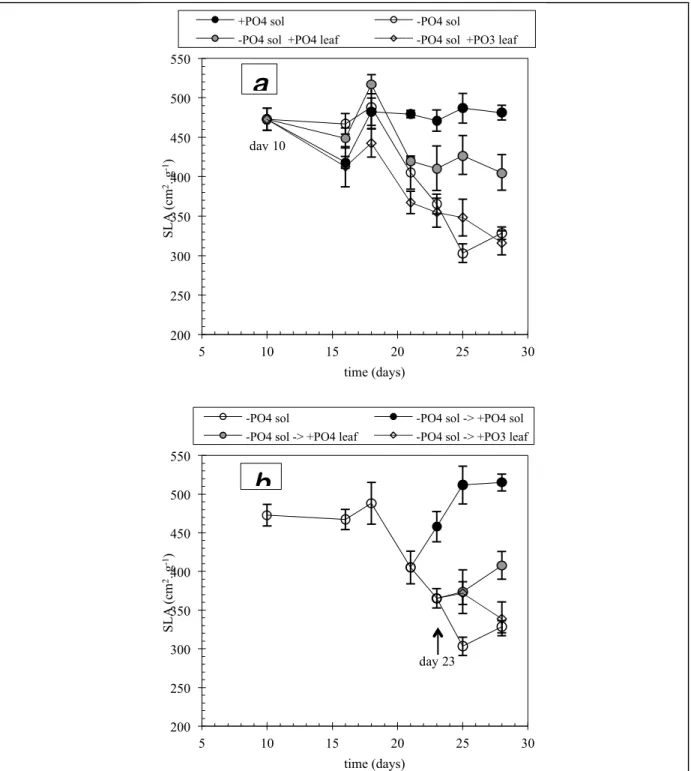
(day 22, cf. plate 2.I). Figure 2.6-a shows that phosphorus deprivation (i.e. no supply either through foliar treatment or solution) causes a slowing of growth only after the third harvest (day 21). On this date, the leaf area of the deficient plants is 28% lower than that of the control plants. As in trial 1, there is a good correlation between the slowing of growth and the appearance of visible symptoms. Later, the difference between control and deficient plants becomes more pronounced, the growth rate of the latter getting progressively slower. At final harvest, their leaf area is six times less than that of the control plants (with phosphate). Foliar spray with phosphite has had no effect on the leaf area of the plants deprived of phosphate in nutrient solution (fig. 2.6-a) and has not prevented the appearance nor the development of the visible symptoms of deficiency. In contrast to trial 1, both growth curves (without phosphate and with phosphite) are superposed. Contrary to its use in nutrient solution, the foliar application of phosphite did not block leaf area growth. However, additional growth resulted from foliar sprays of phosphate solution (fig. 2.6-a), without being able to maintain it at the level of the control plants (with phosphate in nutrient solution), nor to prevent the development of symptoms of deficiency. At final harvest, their leaf area was double that of plants receiving no phosphorus either in solution or on the leaves, and three times less than that of the control plants (plate 2.III).
Effect of spraying conducted from day 23
From the fifth harvest (day 23), two of the tables receiving the phosphate-less treatment were given either phosphate or phosphite foliar sprays (fig. 2.6-b). The objective was to evaluate the ability of these treatments to restore normal growth in plants already suffering from deficiency. The plants receiving phosphate or phosphite spray behaved in the same manner. At the end of the experiment, i.e. after two sprays with phosphite or phosphate, the leaf area was 47% and 71% respectively higher than plants receiving no phosphorus. To compare, phosphate restitution in the nutrient solution from day 22 restored leaf development from the fifth harvest (plate 2.IV). By the seventh harvest, the leaf area of restored plants was 4.5 times larger than that of deficient plants. New leaves appearing after phosphate restitution through nutrient solution showed no visible symptoms of deficiency.
Effect of treatments on specific leaf area:
Data for specific leaf area at harvest 2 (day 16) is not shown (fig. 2.7) or discussed. On this date, because of a technical breakdown, harvesting was carried out in the afternoon instead of in the morning. Furthermore, it lasted for a long period of time. As the SLA is a parameter that is affected by the time of harvest, it was deemed that the measurements from this date would be unreliable.
Effect of spraying conducted from day 10
Comparison of the development of specific leaf area between the four treatments initiated on the tenth day of growth (fig. 2.7-a) shows significant differences after the fourth harvest on day 21. As for trial 1, at the time when visible symptoms were appearing generally (day 22), the SLA proves to be a much more sensitive indicator of deficiency than leaf area. Phosphorus deprivation (i.e. no supply either by foliar application or in nutrient solution) provokes an important drop in the SLA reading up until final harvest (fig. 2.7-a). Plants receiving phosphite in foliar spray form also follow this pattern, unlike those receiving phosphate, whose SLA remains at an intermediate
4
report trial 2 - phosphorous acid - Rhône-Poulenc agro SA - INRA ECHO - july 10th 1996
level between the control and deficient plants. These observations confirm in every way the observations made on the growth of leaf area, i.e. the inability of phosphite (in spray form) to offset phosphorus deficiency, and the relative efficacy of phosphate.
Effect of spraying conducted from day 23
Foliar spray treatments of phosphite from day 23 (fig. 2.7-b) maintained the SLA value until the next harvest (day 25). This effect was short-lived, because at final harvest, this value was the same as that of deficient plants. However, spraying with phosphate increased the SLA value which, at final harvest, reached the same level as plants which had been receiving spray treatments since the beginning of growth (compare figures 2.7-a and 2.7-b). For comparison purposes, restitution of phosphate in solution (fig. 2.7-b) caused a much higher increase in SLA, which reached the level of the control treatment (cf. fig. 2.7-a). This information confirms that 1) as in trial 1, phosphate restitution in nutrient solution is the most effective way of restoring phosphorus state in plants; 2) foliar application of phosphate has a definite but limited efficacy. Furthermore, foliar application of phosphite seems to have a short-lived positive effect on growth, which might explain the stimulation observed in foliar growth (fig. 2.6-b). Additional harvests would have been necessary to confirm this.
Effect of treatments on root growth (plate 2.V):
Effect of spraying conducted from day 10
Figure 2.8-a represents root dry matter as a function of aerial dry matter (log-log co-ordinates). Phosphorus deficiency strongly favours root growth. For example, for aerial dry matter of 0.64 g (highest value obtained in deficient plants), root dry matter is 0.07 g in control plants (receiving phosphate in solution) and 0.22 in deficient plants. This increase in the proportion of root mass is a specific reaction to mineral deficiencies. Plants receiving foliar applications of phosphate follow the same ratio as deficient plants (fig. 2.8-a). Stimulation of root growth is therefore linked to the absence of phosphate in solution. However, foliar application of phosphite inhibits this stimulation, corroborating observations made during trial 1. Figure 2.9-a effectively confirms that, contrary to the effect observed on aerial growth (fig. 2.6-a), foliar application of phosphite strongly suppresses root growth in comparison with deficient plants.
Effect of spraying carried out from day 23
Foliar applications of phosphate from day 23 (fig. 2.8-b) have no marked effect on relative root growth compared to deficient plants. However, foliar applications of phosphite lower the proportion of roots. Phosphate restitution in solution has the same effect as foliar application of phosphite. These observations confirm the behaviour described in the previous paragraph in all points.
Conclusions:
The conditions in which this trial was conducted made it possible to measure and compare the effects of foliar applications of phosphite and phosphate solutions on tomato plants fed with a phosphorus-less nutrient solution. These foliar spray treatments were carried out before and after the appearance of visible symptoms of phosphorus deficiency.
foliar application of phosphate, which stimulates growth of leaf area (fig. 2.6 and plate 2.III) and of root biomass (fig. 2.9), as well as specific leaf area (fig. 2.7), the application of phosphite has no effect on either the leaf area (fig. 2.6 and plate 2.III) or the specific leaf area, and strongly inhibits root growth (fig. 2.9 and plate 2.V). Overall, for aerial growth under test conditions, after five foliar applications at 24 mmol P L-1, it was noted that the foliar application of phosphate is relatively effective, and the foliar application of phosphite is ineffective. Nevertheless, it is notable that foliar treatment with phosphate does not maintain aerial growth at the level observed in plants correctly fed with phosphate in a nutrient solution (fig. 2.6 and 2.7, plate 2.III). The most important observation is that of the stimulation of root growth in the absence of phosphate in solution, with or without foliar application of phosphate (Fig. 2.8), and its inhibition by the foliar application of phosphite. This inhibition is clear from the first application of phosphite and becomes more marked up until final harvest after five applications of phosphite (fig. 2.9 and plate 2.V, table V compared to tables III and I).
As a general conclusion, not only does phosphite solution not act as a substitute for phosphate but also, in conditions of phosphorus deficiency, it suppresses root development. This leads to a decreased ability of roots to intercept phosphorus in conditions of limited nutrition, and should discourage the use of phosphite in spray form in cases of phosphorus deficiency.
6
report trial 2 - phosphorous acid - Rhône-Poulenc agro SA - INRA ECHO - july 10th 1996
fig. 2.1: treatments and sampling timetable.
day 0 sowing (mar. 18) day 10 harvest 1 (mar. 28) day 16 harvest 2 (apr. 3) day 18 harvest 3 (apr. 5) day 21 harvest 4 (apr. 8) day 23 harvest 5 (apr. 10) day 25 harvest 6 (apr. 12) day 28 harvest 7 (apr. 15) VII II I IV VI Tables III V day 22 (apr. 9) foliar treatments days: 11 15 19 23 26 + PO4 + PO4 - PO4 - PO4 + foliar PO4 - PO4 + foliar PO3 + PO4 - PO4 - PO4 + foliar PO4 - PO4 + foliar PO3
fig. 2.2: growth of dry matter production in the control plants (table VII, with phosphate). The bars represent the 95% confidence intervals. • a) natural co-ordinates; • b) semi-logarithmic co-ordinates. 0,0! 0,5! 1,0! 1,5! 2,0! 2,5! 3,0! 3,5! 10! 15! 20! 25! 30! ae ri al dry m at te r (g. pl ant -1)! time (days)!
a
0,01! 0,10! 1,00! 10,00! 100! 150! 200! 250! 300! 350! 400! ae ri al dry m at te r (g. pl ant -1)!cumulative QPAR (mol. m-2)!
b
log (dm) = -3,254 + 0,0108 QPAR R2 = 0,991
8
report trial 2 - phosphorous acid - Rhône-Poulenc agro SA - INRA ECHO - july 10th 1996
fig. 2.3: logarithmic representation of the relationship between total leaf area * dry matter of control plants (table VII, with phosphate).
1! 10! 100! 1000! 10000! 0,001! 0,010! 0,100! 1,000! 10,000! tot al l ea f a re a (c m 2. pl ant -1)!
aerial dry matter (g. plant-1)!
area = 330 dm0,99 R2=0,999
fig. 2.4: logarithmic representation of the relationship between root dry matter * aerial dry matter of control
plants (table VII, with phosphate). 0,0001! 0,0010! 0,0100! 0,1000! 1,0000! 0,01! 0,10! 1,00! 10,00! root dry m at te r (g. pl ant -1)!
aerial dry matter (g. plant-1)!
root dm = - 0,00095 + 0,11125 aerial dm R2 = 0,998
10
report trial 2 - phosphorous acid - Rhône-Poulenc agro SA - INRA ECHO - july 10th 1996
fig. 2.5: semi-logarithmic representation of the growth in leaf area as a function of the cultivation table.
• a) from day 10 to 28: table VII on phosphate solution; tables I, III and V on phosphate-free solution without, with phosphate and with phosphite foliar sprays respectively;
• b) from day 10 to 22, tables I, II, IV and VI on phosphate-free nutrition: from day 22 to 28, table II on phosphate solution, tables I, IV and VI on phosphate-free nutrition, without, with phosphate and with phosphite foliar sprays respectively.
1! 10! 100! 1000! 100! 150! 200! 250! 300! 350! 400! m ea n t ot al l ea f a re a (c m 2. pl ant -1)!
cumulative QPAR (mol. m-2)!
I! II! IV! VI!
Tables :! 1! 10! 100! 1000! 100! 150! 200! 250! 300! 350! 400! m ea n t ot al l ea f a re a (c m 2. pl ant -1)!
cumulative QPAR (mol. m-2)!
VII! I! III! V!
a
b
fig. 2.6: semi-logarithmic representation of the growth in leaf area as a function of nutritional treatment.
• a) phosphate and phosphate-free solution from day 10 to 28, without or with foliar sprays of phosphate or phosphite;
• b) phosphate-less nutrion from day 10. From day 22, phosphorous restitution in nutrient solution, or by foliar sprays of phosphate or phosphite.
1 10 100 1000 100 150 200 250 300 350 400 m ea n t ot al le af a re a (c m 2. pl ant -1)
cumulative QPAR (mol. m-2)
+PO4 sol -PO4 sol
-PO4 sol +PO4 leaf -PO4 sol +PO3 leaf
a
1 10 100 1000 100 150 200 250 300 350 400 m ea n t ot al le af a re a (c m 2. pl ant -1)cumulative QPAR (mol. m-2)
-PO4 sol -PO4 sol -> +PO4 sol
-PO4 sol -> +PO4 leaf -PO4 sol -> +PO3 leaf
b
day 10
12
report trial 2 - phosphorous acid - Rhône-Poulenc agro SA - INRA ECHO - july 10th 1996
fig. 2.7: representation of the SLA (Specific Leaf Area) by nutritional treatment. The vertical bars represent the
95% confidence intervals.
• a) phosphate and phosphate-free solution from day 10 to 28, without or with foliar sprays of phosphate or phosphite;
• b) phosphate-free nutrion from day 10. From day 22, phosphorous restitution in nutrient solution, or by foliar sprays of phosphate or phosphite.
200 250 300 350 400 450 500 550 5 10 15 20 25 30 S L A (c m 2. g -1) time (days)
-PO4 sol -PO4 sol -> +PO4 sol
-PO4 sol -> +PO4 leaf -PO4 sol -> +PO3 leaf
200 250 300 350 400 450 500 550 5 10 15 20 25 30 S L A (c m 2. g -1) time (days)
+PO4 sol -PO4 sol
-PO4 sol +PO4 leaf -PO4 sol +PO3 leaf
a
b
day 10
fig. 2.8: logarithmic representation of the relationship between root dry matter * aerial dry matter as a function of
nutritional treatment.
• a) phosphate (smooth line, as in fig. 2.4) and phosphate-free solution from day 10 to 28, without or with foliar sprays of phosphate or phosphite;
• b) phosphate-free nutrition from day 10. From day 22, phosphorous restitution in nutrient solution, or by foliar sprays of phosphate or phosphite.
0,001 0,010 0,100 1,000 0,01 0,10 1,00 10,00 m ea n root dry m at te r (g. pl ant -1)
mean aerial dry matter (g. plant-1)
+PO4 sol -PO4 sol
-PO4 sol +PO4 leaf -PO4 sol +PO3 leaf
a
0,001 0,010 0,100 1,000 0,01 0,10 1,00 10,00 m ea n root dry m at te r (g. pl ant -1)mean aerial dry matter (g. plant-1)
-PO4 sol -PO4 sol -> +PO4 sol
-PO4 sol -> +PO4 leaf -PO4 sol -> +PO3 leaf
b
14
report trial 2 - phosphorous acid - Rhône-Poulenc agro SA - INRA ECHO - july 10th 1996
fig. 2.9: semi-logarithmic representation of the growth in root dry matter as a function of nutritional treatment.
• a) phosphate and phosphate-free solution from day 10 to 28, without or with foliar sprays of phosphate or phosphite;
• b) phosphate-free nutrition from day 10. From day 22, phosphorous restitution in nutrient solution, or by foliar sprays of phosphate or phosphite.
0,0001 0,0010 0,0100 0,1000 1,0000 100 150 200 250 300 350 400 m ea n root dry m at te r (g. pl ant -1)
cumulative QPAR (mol. m-2)
+PO4 sol -PO4 sol
-PO4 sol +PO4 leaf -PO4 sol +PO3 leaf
0,0001 0,0010 0,0100 0,1000 1,0000 100 150 200 250 300 350 400 m ea n root dry m at te r (g. pl ant -1)
cumulative QPAR (mol. m-2)
-PO4 sol -PO4 sol -> +PO4 sol
-PO4 sol -> +PO4 leaf -PO4 sol -> +PO3 leaf
day 10
day 23
a
plate 2.I: symptoms of phosphorus deficiency on second leaves (april 9, day 22): Table VII, full nutrient
solution; Table II, phosphorus-free solution; Table V, phosphorus-free solution and foliar sprays of phosphite; Table III, phosphorus-free solution and foliar sprays of phosphate.
16
report trial 2 - phosphorous acid - Rhône-Poulenc agro SA - INRA ECHO - july 10th 1996
plate 2.II: photographs of plants on april 9 (day 22): Table VII, full nutrient solution; Table I, phosphorus-free
solution; Table III, phosphorus-free solution and foliar sprays of phosphate; Table V, phosphorus-free solution and foliar sprays of phosphite.
plate 2.III: photographs of plants on april 15 (harvest 7, day 28): Table VII, full nutrient solution; Table I,
phosphorus-free solution; Table III, phosphorus-free solution and foliar sprays of phosphate; Table V, phosphorus-free solution and foliar sprays of phosphite.
18
report trial 2 - phosphorous acid - Rhône-Poulenc agro SA - INRA ECHO - july 10th 1996
plate 2.IV: photographs of plants on april 15 (harvest 7, day 28): Table I, phosphorus-free nutrient solution from
day 10; Table II, phosphorus-free nutrient solution from day 10 to 21, full nutrient solution from day 22; Tables IV and VI, phosphorus-free solution from day 10, foliar application of phosphate and phosphite respectively from day 23.
Research contract between Rhône-Poulenc Agro-SA and INRA-ECHO Avignon
“STUDY OF THE ACTIVITY OF PHOSPHOROUS ACID AS A PHOSPHORUS
PLANT FERTILIZER“
Preliminary report : trial N° 3
Adamowicz S., Fabre J., Hostalery J., Robin P.
Unité de Recherche en
ECOPHYSIOLOGIE ET HORTICULTURE Domaine St Paul - Agroparc - F84914 - Avignon cedex 9