O
pen
A
rchive
T
oulouse
A
rchive
O
uverte
(OATAO)
OATAO is an open access repository that collects the work of some Toulouse
researchers and makes it freely available over the web where possible.
This is an author’s version published in:
http://oatao.univ-toulouse.fr/
20512
Official URL:
https://doi.org/10.1016/j.ijfoodmicro.2016.06.018
To cite this version:
Rizk, Ziad and El Rayess, Youssef and Ghanem, Chantal and Mathieu, Florence and
Taillandier, Patricia and Nehme, Nancy Impact of inhibitory peptides released by
Saccharomyces cerevisiae BDX on the malolactic fermentation performed by
Oenococcus oeni Vitilactic F. (2016) International Journal of Food Microbiology, 233.
90-96. ISSN 0168-1605
Any correspondance concerning this service should be sent to the repository administrator:
Impact of inhibitory peptides released by Saccharomyces cerevisiae BDX
on the malolactic fermentation performed by Oenococcus oeni Vitilactic F
Ziad Rizk
a,b,c, Youssef El Rayess
d, Chantal Ghanem
a,d, Florence Mathieu
c,
Patricia Taillandier
e, Nancy Nehme
b,f,⁎
aLebanese Agricultural Research Institute (LARI), Fanar Station, P.O. Box 90-1965, Jdeidet El-Metn, Fanar, Lebanon bFaculty of Sciences, Holy Spirit University of Kaslik, P.O. Box 446, Jounieh, Lebanon
cLaboratoire de Génie Chimique, UMR CNRS 5503, INPT-ENSAT, UPS, Université de Toulouse, 1 Avenue de l'Agrobiopôle, F-31326 Castanet-Tolosan, France dFaculty of Agricultural and Food Sciences, Holy Spirit University of Kaslik, P.O. Box 446, Jounieh, Lebanon
eLaboratoire de Génie Chimique, UMR CNRS 5503, INPT-ENSIACET, UPS, Université de Toulouse, 4 Allée Emile Monso, F-31432 Toulouse, France fFaculty of Agricultural Engineering and Veterinary Medicine, Lebanese University, Dekwaneh, Lebanon
a b s t r a c t
A previous study has shown that the malolactic fermentation (MLF) was inhibited during sequential fermenta-tions performed with the pair Saccharomyces cerevisiae BDX/Oenococcus oeni Vitilactic F in synthetic grape juices. A yeast peptidic fraction with an apparent MW of 5–10 kDa was involved in the inhibition. In the present study, the MLF was also inhibited in Cabernet Sauvignon and Syrah wines. The inhibition due to the peptidic fraction was maintained despite high phenolic contents. Kinetic studies showed that the peptidic fraction was gradually released during the alcoholic fermentation (AF). Its highest anti-MLF effect was reached when isolated from late stages of the AF stationary phase. The peptidic fraction was tested in vitro on cell-free bacterial cytosolic extracts containing the malolactic enzyme in a pH range between 3.5 and 6.7. Results showed that it was able to directly inhibit the malolactic enzyme activity with an increasing inhibitory kinetic correlated to the AF time at which it was collected.
Keywords:
Saccharomyces cerevisiae Oenococcus oeni Malolactic enzyme
Antibacterial yeast peptidic compounds
1. Introduction
The production of most red wines and certain white and sparkling wine styles requires two consecutive fermentation steps. The first one is the alcoholic fermentation (AF) and is carried out by yeasts belonging mainly to the Saccharomyces cerevisiae species. During this step, the sugars of the grape must (D-Glucose andD-Fructose) are primarily
con-verted into ethanol and CO2. At the end of the AF, these wines are
spon-taneously or purposely taken through a malolactic fermentation (MLF) step mostly by indigenous or inoculated lactic acid bacteria belonging mainly to the Oenococcus oeni species. The MLF, an enzymatic decarbox-ylation ofL-malic acid intoL-lactic acid and CO2, reduces wine acidity
and improves its sensorial characteristics and its microbial stability (Bartowsky et al., 2002; Lonvaud-Funel, 1999, 2002). However, it is often difficult to trigger and accomplish because of the individual or synergistic antibacterial activity of several physical chemical wine pa-rameters and yeast inhibitory metabolites. Some of these factors have
been intensively investigated such as low pH (Britz and Tracey, 1990; Vaillant et al., 1995), inadequate temperature (Britz and Tracey, 1990), nutrient depletion (Patynowski et al., 2002; Remize et al., 2006; Saguir and Manca de Nadra, 2002; Terrade and Mira de Orduna, 2009), endog-enous and exogendog-enous SO2(Carreté et al., 2002; Henick-Kling and Park,
1994; Larsen et al., 2003; Osborne and Edwards, 2006), phenolic com-pounds (Reguant et al., 2000), high ethanol content (Britz and Tracey, 1990; Vaillant et al., 1995) and medium chain fatty acids (Capucho and San Romao, 1994; Edwards and Beelman, 1987; Lonvaud Funel et al., 1988).
While the anti-MLF role of the previous compounds is already well established, there are gradually growing evidences suggesting the in-volvement of yeast peptides/proteins in the inhibition of O. oeni growth andL-malic acid consumption. So far, few authors have demonstrated
the ability of certain S. cerevisiae strains to produce anti-MLF com-pounds of protein nature. Besides, the comcom-pounds found presented dif-ferent MW and were strain dependent.Dick et al. (1992)were the first to isolate two antibacterial cationic proteins produced by the yeast strain R107. One of them had the characteristics of lysozyme and the other one was a small protein with a high pI. Later on,Comitini et al. (2005)found that S. cerevisiae F63 was able to produce a proteinaceous compound with a MW N10 kDa that strongly inhibited the growth of O. oeni CHR as well as its MLF. Besides,Osborne and Edwards (2007),
⁎ Corresponding author at: Faculty of Agricultural Engineering and Veterinary Medicine, Lebanese University, Dekwaneh, Lebanon.
E-mail addresses:[email protected](Z. Rizk),[email protected](Y. El Rayess),[email protected](F. Mathieu),[email protected](P. Taillandier),
identified a 5.9 kDa peptide produced by S. cerevisiae RUBY. Ferm and inhibiting O. oeni Viniflora oenos.Mendoza et al. (2010)showed that S. cerevisiae mc2 released a proteinaceous compound presenting a MW between 3 and 10 kDa that inhibited the growth of O. oeni X2L
but not its ability to consumeL-malic acid. Finally,Branco et al. (2014)
showed that S. cerevisiae CCMI 885 secreted antimicrobial peptides (AMP) that were active against a wide variety of wine-related yeasts in addition to O. oeni. However, only the microbial growth was evaluat-ed. These AMP corresponded to different fragments of the C-terminal amino acid sequence of the S. cerevisiae glyceraldehyde 3-phosphate de-hydrogenase (GAPDH) enzyme. Among these AMP, two main fragments of 1.638 and 1.622 kDa were detected.
Most of the time, the impact of these compounds on the growth of O. oeni was the main parameter evaluated and few data concerning the malate consumption was given. The MLF inhibition was often consid-ered as a consequence of the bacterial growth inhibition. Besides, the di-rect effect of these compounds on the malolactic enzyme activity was never studied.
In a previous work (Nehme et al., 2010), we demonstrated that S. cerevisiae BDX (referred to as strain D) was able to produce a peptidic fraction with an apparent MW between 5 and 10 kDa responsible for the strong inhibition of O. oeni Vitilactic F (referred to as strain X) during sequential fermentations performed in synthetic grape juices. Sequen-tial fermentations simulate the natural winemaking process by starting the MLF after the accomplishment of the AF. In the present work, we intended to further characterize this peptidic fraction; first by showing its ability to inhibit MLF in natural wines despite high phenolic contents, second by determining the time of its release during AF and third by measuring its direct inhibitory effect on the malolactic enzyme activity. 2. Materials and methods
All culture media components were supplied by Sigma-Aldrich (Taufkirchen-Germany) except for the Yeast Extract and the peptone that were supplied by Oxoid (Hampshire-England).
2.1. Strains and storage conditions
S. cerevisiae BDX and CY3079 and O. oeni Vitilactic F used in this work were kindly provided by Lallemand Inc. (Blagnac, France). In previous works, BDX was referred to as strain D, CY3079 as strain A and Vitilactic F as strain X (Nehme et al., 2008, 2010). Yeast stock cultures were kept at 4 °C in YEPD (Yeast Extract Peptone Dextrose) agar slants composed of 10 g/L Yeast Extract, 20 g/L peptone, 20 g/LD-glucose and 20 g/L agar. The bacterial strain was kept frozen at −20 °C in MRS (De Man, Rogosa and Sharpe) broth containing 20% glycerol (v/v).
2.2. Growth media
2.2.1. Synthetic grape juice medium (SGJ medium)
The medium composition that simulated the natural grape juice consisted of:D-glucose 100 g/L,D-fructose 100 g/L, Yeast Extract 1 g/L, (NH4)2SO42 g/L, citric acid 0.3 g/L,L-malic acid 3 g/L,L-tartaric acid
5 g/L, MgSO40.4 g/L, and KH2PO45 g/L, pH adjusted to 3.5 using a
10 mol/L NaOH solution. The medium was autoclaved before use (121 °C, 20 min).
2.2.2. Cabernet Sauvignon and Syrah grape musts
Cabernet Sauvignon (CS) and Syrah grape varieties were provided by Clos Saint Thomas (Kab Elias, Lebanon) in September 2014. The grapes were destemmed and crushed then submitted to pre-fermenta-tion macerapre-fermenta-tions at 10, 60, 70 and 80 °C for 48 h. The grape musts were sulfitized at a dose of 5 g/hL. A solution of NaHSO3100 g/L was used for
this purpose. The sugar andL-malic acid concentrations were adjusted
to 200 g/L and 3 g/L respectively. The pH was also adjusted to 3.5 using an 85% orthophosphoric acid solution.
2.2.3. Modified MRS medium
The MRS medium was supplemented withL-malic acid (3 g/L) and Tween 80 (1 mL). After autoclaving (121 °C, 15 min), 10% ethanol (v/ v) were aseptically added through sterile filter membranes of 0.22 μm cut-off (Elvetec services, Meyzieu-France) and the pH was adjusted to 3.5 using an 85% orthophosphoric acid solution.
2.3. Sequential fermentations in natural grape musts
The Cabernet Sauvignon and Syrah grape musts were separately in-oculated either by S. cerevisiae BDX or by S. cerevisiae CY3079 at an ini-tial concentration of 3 × 10⁶cells/mL (Thoma counting chamber). The
AF was followed until total or cessation of sugar consumption (b2 g/ L). The yeast inoculum was beforehand prepared in two steps. First, a preculture of the yeast strain was obtained by reactivating the stock cul-ture in YEPD broth for 24 h. Second, the preculcul-ture was used to inoculate a low sugar concentration synthetic grape juice medium:D-Glucose
50 g/L and absence ofD-Fructose. This step was carried out for 24 h and provided the yeast inoculum.
After completion of the AF, the wines were subjected to different steps before inoculation of the lactic acid bacteria. First, yeast cells were removed by centrifugation (3000 rpm for 20 min at 4 °C) and the supernatants were recovered. Then, theL-malic acid concentration
was measured and readjusted to 3 g/L. Next, the pH was adjusted to 3.5 using a 10 mol/L NaOH solution. Finally, the wines were filtered aseptically through 0.22 μm membranes (Elvetec services) and were in-oculated with the malolactic bacteria at an initial concentration of 2 × 10⁶cells/mL (Petroff-Hausser counting chamber) corresponding
to an initial bacterial biomass of 0.0016 g/L. The MLF was followed until cessation ofL-malic acid consumption. The bacterial inoculum was prepared in two steps. First, a preculture of O. oeni Vitilactic F was obtained by reactivating the stock culture in MRS broth with 3% ethanol (v/v) added. After 24 h, the preculture was used to inoculate the low sugar concentration synthetic grape juice medium with 6% ethanol (v/ v) added. This step provided the bacterial inoculum after an incubation period of 24 h.
All fermentation steps for both AF and MLF were carried out at 22 °C with stirring at 150 rpm in Erlenmeyer flasks.
Yeast and bacterial growth were followed during AF and MLF re-spectively by measuring their cell concentration (cells/mL) and their dry weight (g/L).
Each sequential fermentation was performed in three independent replicates.
2.4. Timing of the release of the 5–10 kDa peptidic fraction produced by S. cerevisiae BDX during AF
The AF was carried out by S. cerevisiae BDX for 5 days (120 h) in 2 L of the SGJ medium. Each 24 h, a supernatant of 210 mL was collected and fractionated by ultrafiltration in order to isolate the corresponding 5– 10 kDa peptidic fraction. First, the sample was distributed into centrifu-gal filter units' presenting a cut-off of 10 kDa (Amicon® Ultra-15 with ultracel-10 membrane) and the ultrafiltration was performed at 3500 g for 45 min at 4 °C. Each unit can initially contain a volume of 15 mL. 14 units were filled and at the end of the ultrafiltration, a volume of 0.2 mL was retained by the membrane of each unit. A total retentate of 2.8 mL with a MW ≥ 10 kDa, 75 times concentrated, was obtained. The filtrate ≤10 kDa was then recovered and ultrafiltered using the centrif-ugal filter units presenting a cut-off of 5 kDa (Corning® Spin-X UF 20 Sigma-Aldrich). The principle was the same and 2.8 mL of a fraction with a MW between 5 and 10 kDa, 75 times concentrated, was obtained. Five fractions were finally collected at the end of the AF (after 120 h). They were referred to as D1 (24 h), D2 (48 h), D3 (72 h), D4 (96 h) and D5 (120 h). The fraction from each day (2.8 mL) was added to a modified MRS medium so as to obtain a final volume of 20 mL and was finally 10.5 times concentrated.
O. oeni Vitilactic F was then inoculated into these media at an initial concentration of 2 × 10⁶cells/mL and the MLF was carried out at 22 °C
with stirring at 150 rpm in Erlenmeyer flasks. The same modified MRS medium without the 5–10 kDa fractions was used as a control for this experiment. The MLF was followed by regular sampling until the cessa-tion of theL-malic acid consumption.
The timing experiment was performed in three independent replicates.
2.5. In vitro evaluation of the inhibitory effect of the 5–10 kDa fractions on the malolactic enzyme activity
2.5.1. Preparation of the cell-free bacterial enzymatic extract comprising the malolactic enzyme
The modified MRS medium was inoculated with O. oeni Vitilactic F at an initial concentration of 2 × 10⁶cells/mL and the bacterial culture was
followed for 5 days at 22 °C with stirring at 150 rpm. After a centrifuga-tion at 3500 rpm for 20 min at 4 °C, the supernatant was removed and 0.4 g of the bacterial pellet were weighed and suspended in 800 μL of an appropriate buffer (citrate buffer pH 3.5, phosphate buffer pH 6 or phosphate buffer pH 6.7, buffer concentration 0.1 M). The bacterial cells were then lysed by vortexing them with glass beads of 300 μm di-ameter (Sigma-Aldrich) in a FastPrep® FP120 bead-beater device (BIO 1010/Savant) at 6 m/s for 3 × 45 s at 4 °C. Between 2 consecutive runs, the cells were kept on ice for 1 min. The cell debris was removed by centrifugation at 14,000 g for 10 min at 4 °C (Larsen et al., 2006). The supernatant containing the cell-free enzymatic extract was recov-ered and the volume completed to 2 mL using the corresponding buffer. 2.5.2. Monitoring of theL-malic acid consumption in vitro
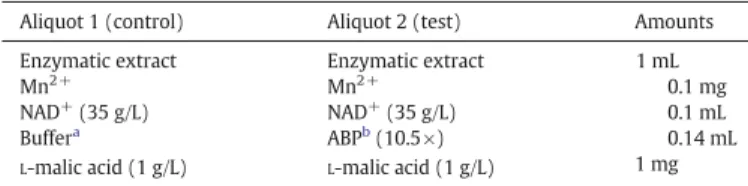
The 2 mL of the enzymatic extract were divided into 2 aliquots of 1 mL each. One was used as a control and the other as a test medium to which the 5–10 kDa fractions were added. The reaction mixture is given inTable 1. The reagents were added to each aliquot in the order listed in the table. The enzymatic reaction was performed at 30 °C for 30 min at pH 6, 40 min at pH 6.7 and 70 min at pH 3.5.
The inhibitory kinetic of the malolactic enzyme activity by the 5– 10 kDa fractions was evaluated. The 5 peptidic fractions of 5–10 kDa col-lected from D1 to D5 (Section 2.4) were tested separately. At the end of each assay, the concentrations of theL-malic acid consumed and theL
-lactic acid produced were measured in both aliquots (control and test) and compared.
The inhibitory effect of each 5–10 kDa fraction on the malolactic en-zyme activity was performed in three independent replicates. 2.6. Analytical methods
2.6.1.L-malic acid consumption
TheL-malic acid concentration was determined using an enzymatic assay (Boehringer Mannheim/R-Biopharm, kit. No 10139068035, Darmstadt-Germany) and the results were expressed in g/L.
2.6.2.L-lactic acid production
TheL-lactic acid concentration was determined using an enzymatic assay (Boehringer Mannheim/R-Biopharm, kit. No 10139084035, Darmstadt-Germany) and the results were expressed in g/L.
2.6.3. Total polyphenols
Total polyphenols in Cabernet Sauvignon and Syrah wines were evaluated at the end of the AF carried out by both yeast strains. The method used was based on the reduction of the Folin-Ciocalteu reagent by polyphenols as described byRibéreau-Gayon et al. (2006). The re-sults were expressed in mg/L equivalent gallic acid.
2.6.4. Dry weight of bacteria
The dry weight was determined using a thermobalance or moisture analyzer (Ohaus-UK). A correlation between the bacterial cell concen-tration (cells/mL) and the bacterial biomass (g/L) was established using high bacterial concentrations. The correlation obtained was the following:
yðg=LÞ¼ 8:10−10
$ðcells=mLÞ:
It was then used to determine the biomass of low concentrated samples.
2.7. Statistical analyses
Means and standard deviations of the assays were calculated using conventional statistical methods. Each experiment was performed in three replicates. Statistical analysis (ANOVA) was applied to the data to determine differences (p b 0.05). Means differences were made by using Tukey's HSD test. The statistical analysis was carried out using Statgraphics XV·I for windows.
3. Results and discussion
3.1. Impact of the 5–10 kDa peptidic fraction produced by S. cerevisiae BDX on MLF in natural winemaking conditions
It was previously shown that the growth of O. oeni Vitilactic F and its ability to consumeL-malic acid were strongly inhibited by S. cerevisiae BDX during sequential fermentations performed in synthetic grape juice (SGJ) media. The MLF inhibition was mainly due to a peptidic frac-tion presenting an apparent MW of 5–10 kDa working synergically with ethanol (Nehme et al., 2010). The SO2and medium chain fatty acids
concentrations produced by S. cerevisiae BDX were lower than the ones found in the literature to cease MLF and the nutrient depletion was excluded from inhibitory factors (Nehme et al., 2008, 2010). S. cerevisiae CY3079 produced similar amounts of ethanol, SO2and
medi-um chain fatty acids as S. cerevisiae BDX and presented the same nutri-tional behavior. MLF carried out by O. oeni Vitilactic F in SGJ media fermented by CY3079 was totally accomplished (Nehme et al., 2008). Besides, 5–10 kDa peptidic fractions isolated from SGJ media fermented by CY3079 did not inhibit O. oeni Vitilactic F (data not published). There-fore CY3079 was chosen as a reference yeast strain for this study.
Table 2shows the total phenolic content at the end of the AF carried out by S. cerevisiae BDX and S. cerevisiae CY3079 in Cabernet Sauvignon and Syrah wines. The corresponding grape musts were previously mac-erated at 10, 60, 70 and 80 °C for 48 h before AF. High phenolic contents were reached at maceration temperatures of 60, 70 and 80 °C because of a better phenolic extraction from the grape skin and seeds. Sequential fermentations were carried out in these wines by inoculating O. oeni Vitilactic F at the end of the AF. MLF was monitored for 3 months and was totally inhibited in wines fermented by S. cerevisiae BDX. Both the bacterial growth and the malate consumption were repressed regard-less of the phenolic content (Tables 2 and 3). Despite high phenolic
Table 1
Reaction mixture for the monitoring of theL-malic acid consumption in vitro by the malo-lactic enzyme of the enzymatic extract isolated from O. oeni Vitimalo-lactic F at different pH values with or without the 5–10 kDa peptidic fractions.
Aliquot 1 (control) Aliquot 2 (test) Amounts Enzymatic extract Enzymatic extract 1 mL Mn2+ Mn2+ 0.1 mg
NAD+(35 g/L) NAD+(35 g/L) 0.1 mL
Buffera ABPb(10.5×) 0.14 mL
L-malic acid (1 g/L) L-malic acid (1 g/L) 1 mg
aABP (10.5×): antibacterial peptides of the 5–10 kDa fractions 10.5 times concentrated. b Buffer: 0.1 mol/L of citrate buffer pH 3.5, phosphate buffer pH 6 or phosphate buffer
contents, MLF conducted by O. oeni Vitilactic F in wines produced by S. cerevisiae CY3079 was totally completed. In comparison to the pre-fer-mentation maceration at 10 °C, the higher phenolic content obtained at 60, 70 and 80 °C reduced the bacterial biomass produced and slowed down the MLF but malate was totally consumed (Table 3).
Therefore, MLF results were reproducible in both synthetic and nat-ural grape juice media with both yeasts/bacteria pairs tested.
The conservation of the inhibitory effect due to the 5–10 kDa yeast peptidic fraction in natural winemaking conditions despite the presence of phenolic compounds is an interesting finding. It is usually known that phenolic compounds are able to interact with proteins leading either to their precipitation or to changes of their bioactive properties (Sims et al., 1995; Yokotsuka and Singleton, 1995). Wine proteins derive mostly from grapes but also from yeasts during AF. Both reversible (van der Waals forces, hydrogen bonding and hydrophobic binding) and irre-versible (covalent bonds) interactions are involved. Proline rich pro-teins like collagen, gelatin and casein, which are commonly used as protein fining agents in wine, and some salivary proteins reported to be involved in astringency perception, are particularly prone to interact with phenolic compounds. The precipitation depends on the phenols and proteins type and concentration (McRae and Kennedy, 2011; Ozdal et al., 2013).
Few studies investigated the possible interactions between peptides of low MW and phenolic compounds in wine. Besides, no previous stud-ies dealt with peptides from wine origin.Yokotsuka and Singleton (1995)demonstrated that gelatin peptides (2, 5 and 10 kDa) and syn-thetic peptides of low MW (between 1.3 and 2.5 kDa) were very effec-tive for fining wines, at least at the same levels as whole gelatin (70 kDa) with high affinity for phenols. The affinity depended on the pH and tem-perature.Osborne and Edwards (2007)found that S. cerevisiae RUBY. Ferm was able to produce a peptide of 5.9 kDa that inhibited O. oeni Viniflora oenos during sequential fermentations in synthetic grape juice media lacking phenols. However,Larsen et al. (2003)who previ-ously used the same strains combination were able to successfully achieve MLF in Chardonnay wines. Therefore, it was suggested that the Chardonnay wine contained phenolic compounds that may have interacted with the 5.9 kDa peptide.
The 5–10 kDa peptides of this study may have not presented binding sites for phenolic compounds and thus were not removed. Regardless of the different types and concentrations of phenolic compounds, the
inhibition caused by the 5–10 kDa peptidic fraction released by S. cerevisiae BDX was preserved in natural winemaking conditions.
3.2. Timing of the release of the 5–10 kDa anti-MLF peptidic fraction pro-duced by S. cerevisiae BDX during AF
In order to assess the timing of the release of the 5–10 kDa peptidic fraction, the AF in the SGJ medium was followed until total sugar con-sumption. It lasted 120 h whereas the stationary growth phase started after 50 h. A peptidic fraction of 5–10 kDa was collected each 24 h of the AF. Five fractions were obtained and each one was tested in a mod-ified MRS medium where it was finally 10.5 times concentrated. The re-sults were compared with those obtained in a modified MRS control.
Fig. 1a shows that the growth kinetic profiles of O. oeni Vitilactic F in the presence of the fractions collected after 24, 48 and 72 h were very similar. Although the average specific growth rates were identical to that of the control (0.009 h−1
), the final biomass reached (0.072 g/L) was 10% less than the one obtained in the control (0.08 g/L) (Table 4). When the fractions collected after 96 and 120 h were tested, the specific growth rates were slightly higher (0.013 h−1
, p b 0.05), but the maxi-mum biomass reached (0.03 g/L) was reduced by 62.5% compared to the control (Table 4). Moreover, a decline phase was detected with these two fractions leading to the death of the whole population with the last fraction (120 h).
The malate was totally consumed in the presence of the fractions collected after 24 h (D1), 48 h (D2) and 72 h (D3) but with a gradual de-crease of the consumption kinetics (Fig. 1b andTable 4). The average specific rate of malate consumption in the presence of the fraction D1 was similar to that of the control (0.37 g g−1h−1
, p N 0.05). In the pres-ence of the fractions D2 and D3, the specific rates were 23% lower than in the control (p b 0.05). The fractions taken after 96 h (D4) and 120 h (D5) of AF were the most inhibiting ones as only 0.37 and 0.19 g/L of
L-malic acid were consumed reducing the control specific rate of 57
and 77% respectively (p b 0.05).
Therefore, we can conclude that the 5–10 kDa peptidic fraction was gradually released during AF and reached its maximum inhibitory con-centration at late stages of the yeast stationary phase (96 and 120 h). Its effect started to be detectable with the fraction D2 (48 h) which corresponded to the end of the AF exponential growth phase, reducing
Table 2
Total phenolic content (mg/L equivalent gallic acid) in Cabernet Sauvignon and Syrah wines at the end of the AF carried out by S. cerevisiae CY3079 and S. cerevisiae BDX.a
Pre-fermentation maceration temperature (°C) Cabernet Sauvignon wine Syrah wine Cabernet Sauvignon wine Syrah wine Phenolic content at the end of the AF carried out by
S. cerevisiae CY3079 (mg/L)
Phenolic content at the end of the AF carried out by S. cerevisiae BDX (mg/L)
10 513 ± 18 365 ± 7 868 ± 18 378 ± 32 60 2635 ± 21 2425 ± 106 2925 ± 7 2718 ± 117 70 3725 ± 21 3043 ± 88 3978 ± 11 3645 ± 170 80 2985 ± 21 2295 ± 35 3078 ± 11 2585 ± 42
aResults are mean ± SD values of three replications.
Table 3
Growth of O. oeni Vitilactic F and malate consumption during MLF performed in the Syrah and Cabernet Sauvignon wines obtained after AF by S. cerevisiae CY3079 or S. cerevisiae BDX.a
Pre-fermentation maceration temperature (°C)
AF carried out by S. cerevisiae CY3079 AF carried out by S. cerevisiae BDX
Cabernet Sauvignon wine Syrah wine Cabernet Sauvignon wine Syrah wine
10 60, 70 and 80 10 60, 70 and 80 10 60, 70 and 80 10 60, 70 and 80 Bacterial biomass produced (g/L) 0.120 ± 0.005 0.080 ± 0.004 0.120 ± 0.006 0.080 ± 0.004 0.0024 ± 0.0002 0.0004 ± 0 0.0044 ± 0.0002 0.0004 ± 0 ConsumedL-malic acid (g/L) 3.00 ± 0.06 3.00 ± 0.06 3.00 ± 0.06 3.00 ± 0.06 0 ± 0 0 ± 0 0 ± 0 0 ± 0 Experiment duration (days)b 30 45 30 45 90 90 90 90
aThe experiment was followed until total consumption ofL-malic acid (30 and 45 days) in wines produced by S. cerevisiae CY3079 (non-inhibitory strain). Although malate was not
consumed, it was followed for 90 days in wines produced by S. cerevisiae BDX (inhibitory strain).
mainly the rate of malate consumption. The same was noticed with the fraction D3 (72 h). The strong inhibition of malate consumption with the fractions D4 (96 h) and D5 (120 h) can somewhat explain the weak final biomasses formed. It is known that MLF produces ATP through a chemiosmotic mechanism thus enhancing the bacterial growth (Bouix and Ghorbal, 2015; Cox and Henick-Kling, 1995). The MLF is one of the main sources of energy for bacteria in winemaking conditions. Therefore, an inhibition of malate consumption can also af-fect the bacterial growth.
Information about the timing of the release of antibacterial peptides/ proteins is scarce and to our best knowledge no previous work has de-scribed simultaneously the kinetics of their production and the kinetics of their anti-MLF activity.Albergaria et al. (2010) showed that S. cerevisiae CCMI 885 started to secrete three antifungal peptides of about 6, 4.5 and 4 kDa at the end of the AF exponential growth phase (day 2) with a gradual increase of their concentration during the sta-tionary growth phase (days 4 and 7). Later on,Branco et al. (2014)
who used the same yeast strain demonstrated that these peptides were also active against the growth of O. oeni and corresponded to GAPDH-derived peptides of 1.6 kDa. They suggested that the peptides were released by apoptotic yeast cells during the stationary phase. In fact,Silva et al. (2011)showed that GAPDH is presumably a substrate of metacaspases during apoptosis. Our findings present some similari-ties with these conclusions since the most important antibacterial effect was detected with the fractions obtained from late stationary phase. However, further investigation must be carried out to see if any of the 5–10 kDa peptides is possibly a GAPDH fragment.
The timing results are in accordance with the co-culture results pub-lished byNehme et al. (2010)who demonstrated that the co-culture strategy improved the MLF output with the same pair (S. cerevisiae BDX/O. oeni Vitilactic F). During co-cultures, AF and MLF were conduct-ed simultaneously by inoculating yeasts and bacteria at the same time from the beginning in a membrane bioreactor using the same experi-mental conditions. The bacterial growth was twice better and 74% of the initial malate were successfully consumed in 3 weeks without any risk of increased volatile acidity or off-flavors. Although the 5–10 kDa peptides gradually appeared during the AF as demonstrated by the present study, the MLF was improved. More recently, co-inoculation was suggested as a worthwhile alternative for winemaking both for bet-ter malate consumption and sensorial characbet-teristics when compared with the traditional sequential inoculation (Cañas et al. 2015; Versari et al., 2015; Tristezza et al., 2016).
Information about the timing of the release of the inhibitory pep-tides is very useful for the determination of the best moment for bacte-rial inoculation and for an optimum extraction of the targeted molecules.
3.3. In vitro evaluation of the malolactic enzyme inhibition by the 5–10 kDa peptidic fractions
In this experiment, the malolactic enzyme of the cell-free bacterial enzymatic extract was directly exposed to the inhibitory peptides. The five fractions of 5–10 kDa collected each 24 h of the AF (D1 to D5) were tested as described inTable 1.Table 5shows the amounts ofL
-malic acid consumed,L-lactic acid produced and the inhibition
percent-age of malate consumption for each 5–10 kDa fraction tested at pH 6.7. For pH 6 and 3.5, only the values of the inhibition percentage of malate consumption are given.
The first set of experiments was conducted at pH 6.7 which is around the cytoplasmic pH of the majority of lactic acid bacteria. First, the re-sults clearly show that the 5–10 kDa fractions were able to reduce the amount ofL-malic acid consumed of 28% (D1) to 91% (D5) when com-pared to the control, thus exhibiting a direct inhibitory effect on the ma-lolactic enzyme activity (p b 0.05). The ethanol concentration in the five fractions was evaluated and a residual amount of 0.02 g/L was found in the 5–10 kDa fraction corresponding to D5. Therefore, all the fractions were ethanol free and the inhibition observed was only due to the pres-ence of the peptides. Second, the kinetic of the inhibition was in agree-ment with the results of the timing experiagree-ment (Fig. 1b) proving once again that the 5–10 kDa peptidic fraction was gradually released during the AF with the highest concentration reached at the end of the station-ary phase. Third, it is known that during the malolactic fermentation, each mole ofL-malic acid decarboxylated by the malolactic enzyme
re-leases one mole ofL-lactic acid and one mole of CO2. Therefore, the
mea-surement of the lactate produced was an additional indicator of the malolactic enzyme activity. The amounts ofL-lactic acid produced
were measured and found to be stoichiometrically equivalent to the amounts ofL-malic acid consumed. As an example, in the presence of the fraction D1, 0.72 g/L ofL-malic acid equivalent to 5.4 mmol/L were consumed and gave 0.48 g/L ofL-lactic acid which corresponded to
5.3 mmol/L. Consequently, the gradual decrease in the amount ofL -lac-tic acid produced proved that the 5–10 kDa peptidic fractions targeted
Fig. 1. Growth (a) and malic acid consumption (b) kinetics of O. oeni Vitilactic F in the control and in the presence of the 5–10 kDa inhibitory fractions collected at different intervals of the AF. (♦) Control: modified MRS medium, (■) 5–10 kDa collected after 24 h of the AF (D1), (▲) 5–10 kDa collected after 48 h of the AF (D2), (×) 5–10 kDa collected after 72 h of the AF (D3), (○) 5–10 kDa collected after 96 h of the AF (D4), (●) 5–10 kDa collected after 120 h of the AF (D5). Each value is the mean of triplicate experiments ± SD.
specifically the malolactic enzyme and not any other enzyme of the cy-tosolic extract.
5–10 kDa fractions isolated from the SGJ media fermented by S. cerevisiae CY3079 (reference strain or non-inhibitory strain) were also tested and gave results similar to the control (data not shown). In fact, the 1 g/L ofL-malic acid were totally decarboxylated by the malolactic enzyme in the presence of these fractions showing no inhibition. There-fore, the inhibition of the malolactic enzyme by the 5–10 kDa peptides of S. cerevisiae BDX was highly specific.
The same experiment was repeated by changing the pH (Table 5). The pH 6 was chosen because it is the optimum pH for activity of the malolactic enzyme of O. oeni (Schümann et al., 2013). The inhibition of malate consumption gradually increased in the presence of the 5– 10 kDa fractions leading to the same conclusions obtained at pH 6.7. However, the reaction was faster. 30 min instead of 40 min were re-quired to entirely decarboxylate 1 g/L ofL-malic acid intoL-lactic acid and CO2in the control. The pH 3.5 was also tested because it represents
the pH of wine at the beginning of the MLF in this study. At this extreme pH, similar results were also obtained. However, the reaction was the slowest and took 70 min in the control. Interestingly,Bouix and Ghorbal (2015)demonstrated that at low extracellular pH, O. oeni cells were able to drop their intracellular pH to values as low as 3.5 (equal to the extracellular pH). The MLF was then initiated indicating that the malolactic enzyme was active at this low pH. During MLF, the intracellular pH increased again due to the proton extrusion that accom-panied the release of lactate and CO2. It reached 6 at the end of the MLF
and dropped again to 3.5 when the malate was totally consumed. The results of the in vitro experiment performed at 3.5 showed that the en-zyme was indeed active at this low pH although the enzymatic reaction was 2.3 times slower than at pH 6 (Table 5).
From the previous results, it can be concluded that the peptides were able to exert their inhibitory effect in a pH range between 3.5 and 6.7.
The results also suggest that in vivo, the peptides of the 5–10 kDa fraction released by S. cerevisiae BDX would enter the bacterial cells by mechanisms yet to be identified and directly inhibit the malolactic en-zyme. The presence of cell receptors to these peptides could be suggested.
No previous works have shown the involvement of yeast proteina-ceous metabolites in the direct inhibition of the malolactic enzyme ac-tivity. Few have attempted to explain the mechanism of action of the yeast antibacterial peptides/proteins and evaluated mainly their impact on the bacterial growth. The proteinaceous compound ≥10 kDa found byComitini et al. (2005), was dose dependent and was able to reduce the bacterial growth with a typical saturation kinetic thus suggesting the presence of a receptor on the bacterial cell. Therefore its bacterio-static or bactericidal effect depended on its concentration and the MLF inhibition was correlated to its bactericidal effect. The 3–10 kDa peptidic fraction found byMendoza et al. (2010)inhibited the bacterial growth but not the malate consumption with a typical saturation kinetic similar to that suggested byComitini et al. (2005).Osborne and Edwards (2007)suggested that the antibacterial peptide of 5.9 kDa worked syn-ergically with SO2. The mechanism proposed was that of bacteriocins
Table 4
Determination of the average specific growth rates and the average specific rates of malate consumption during the MLF carried out by O. oeni Vitilactic F in the modified MRS media con-taining the 5–10 kDa fractions collected each 24 h of the AF as well as in the control.1
Control: modified MRS medium Modified MRS medium + D12 fraction Modified MRS medium + D22 fraction Modified MRS medium + D32 fraction Modified MRS medium + D42 fraction Modified MRS medium + D52 fraction X0: Initial biomass (g/L) 0.0016 ± 0.0002 0.0016 ± 0.0002 0.0016 ± 0.0002 0.0016 ± 0.0002 0.0016 ± 0.0002 0.0016 ± 0.0002 Xf: Final biomass (g/L) 0.080 ± 0.006 0.072 ± 0.006 0.073 ± 0.005 0.072 ± 0.006 0.031 ± 0.002 0.030 ± 0.002 dt1: Growth duration (h) 216 216 216 216 144 144
μ3: average specific growth rate (h−1)
0.009 ± 0.001a 0.009 ± 0.001a 0.009 ± 0.001a 0.009 ± 0.001a 0.013 ± 0.002b 0.013 ± 0.001b
S0: InitialL-malic acid (g/L) 3.25 ± 0.16 3.01 ± 0.16 3.03 ± 0.20 3.03 ± 0.15 3.04 ± 0.15 3.09 ± 0.12 Sf: FinalL-malic acid (g/L) 0 ± 0 0.03 ± 0 0 ± 0 0 ± 0 2.67 ± 0.12 2.90 ± 0.16 dt2: Duration of MLF (h) 216 216 288 288 144 144
Qs4: average specific rate of
malate consumption (g g−1h−1)
0.37 ± 0.02a 0.375 ± 0.020a 0.28 ± 0.02b 0.290 ± 0.015b 0.16 ± 0.01c 0.084 ± 0.006d 1 Results are mean ± SD values of three replications. In comparison to the control, values of average specific rates (growth or malate consumption) within the same row followed by
different letters are significantly different (p b 0.05) according to Tukey's HSD test.
2 μ (h−1) = (dX / dt1).1/X with dX = (Xf− X0) and X = (Xf+ X0) / 2. 3 Q s(g g −1h−1) = (dS / dt 2).1/X with dS = (S0−Sf) and X = (Xf+ X0) / 2.
4 D1 to D5 (day 1 to day 5): 5–10 kDa fractions collected at 24, 48, 72, 96 and 120 h of the AF performed by S. cerevisiae BDX.
Table 5
Amount ofL-malic acid consumed (g/L) andL-lactic acid produced (g/L) during the enzymatic reaction in vitro performed at different pH in the presence of the 5–10 kDa fractions (ABP) collected each 24 h of the AF.1
Sampling time of the 5–10 kDa fractions during the AF pH = 6.7 t = 40 min pH = 6 t = 30 min pH = 3.5 t = 70 min ConsumedL-malic acid (g/L) ProducedL-lactic acid (g/L) Inhibition % of malate consumption2 Inhibition % of malate consumption Inhibition % of malate consumption Control3(absence of ABP) 1.00 ± 0.02a 0.670 ± 0.013a 0 ± 0 0 ± 0 0 ± 0
After 24 h of the AF (D1) 0.720 ± 0.015b 0.48 ± 0.01b 28.0 ± 0.6 8.00 ± 0.16 7.30 ± 0.15
After 48 h of the AF (D2) 0.630 ± 0.013c 0.420 ± 0.009c 37.0 ± 0.8 15.0 ± 0.3 14.6 ± 0.3
After 72 h of the AF (D3) 0.560 ± 0.011d 0.380 ± 0.008d 44 ± 1 30.0 ± 0.6 32.30 ± 0.65
After 96 h of the AF (D4) 0.100 ± 0.002e 0.070 ± 0.002e 90 ± 2 90.4 ± 2.0 94 ± 2
After 120 h of the AF (D5) 0.090 ± 0.002f 0.060 ± 0.002f 91 ± 2 94 ± 2 100 ± 2
1 Results are mean ± SD values of three replications. In comparison to the control, values of malate consumed and lactate produced followed by different letters within the same column
are significantly different (p b 0.05) according to Tukey's HSD test.
2 Inhibition % of malate consumption = (consumedL-malic acid in the control − consumedL-malic acid in the presence of ABP) × 100 / (consumedL-malic acid in the control). 3 Absence of ABP: absence of antibacterial peptides.
forming membrane pores and facilitating the entry of SO2inside the
cells thus leading to the bacterial death and arrest of MLF. The mecha-nism of action of the GAPDH-derived peptides identified byBranco et al. (2014)and that inhibited the growth of O. oeni was not elucidated. In addition no data concerning the malate consumption was shown.
In conclusion, the results of the present work revealed that the anti-MLF peptidic fraction of 5–10 kDa produced by S. cerevisiae BDX was gradually released during AF with an increasing inhibitory effect mainly detected between the beginning and the late stages of the stationary phase. The MLF inhibition due to the peptidic fraction was maintained in natural winemaking conditions. It was shown for the first time that yeast proteinaceous compounds were able to inhibit theL-malic acid consumption by directly targeting the malolactic enzyme activity. Cur-rent work is carried out in order to purify and sequence the putative bio-active peptides of the 5–10 kDa fraction. Future work should investigate their antimicrobial range of action, their biochemical and inhibitory properties and the possibility of using them as natural alternative biopreservatives in food products.
Acknowledgments
The authors would like to thank LARI (Lebanese Agricultural Re-search Institute) for their financial support and Lallemand Inc. for pro-viding the strains.
References
Albergaria, H., Francisco, D., Gori, K., Arneborg, N., Girio, F., 2010.Saccharomyces cerevisiae CCMI 885 secretes peptides that inhibit the growth of some non-Saccharomyces wine-related strains. Appl. Microbiol. Biotechnol. 86, 965–972.
Bartowsky, E., Costello, P., Henschke, P., 2002.Management of malolactic fermentation-wine flavor manipulation. Aust. N. Z. Grapegrow. Winemak 461a (7–8), 10–12.
Bouix, M., Ghorbal, S., 2015.Rapid assessment of Oenococcus oeni activity by measuring intracellular pH and membrane potential by flow cytometry and its application to the more effective control of malolactic fermentation. Int. J. Food Microbiol. 193, 139–146.
Branco, P., Francisco, D., Chambon, C., Hebraud, M., Arneborg, N., Almeida, M.G., Caldeira, J., Albergaria, H., 2014. Identification of novel GAPDH-derived antimicrobial peptides secreted by Saccharomyces cerevisiae and involved in wine microbial interactions. Appl. Microbiol. Biotechnol.http://dx.doi.org/10.1007/s00253-013-5411-y. Britz, T.J., Tracey, R.P., 1990.The combination effect of pH, SO2, ethanol and temperature
on the growth of Leuconostoc oenos. J. Appl Bacteriol. 68, 23–31.
Cañas, P.M., Romero, E.G., Pérez-Martín, F., Seseña, S., Palop, M.L., 2015.Sequential inocu-lation versus co-inocuinocu-lation in cabernet franc wine fermentation. Food Sci. Technol. Int. 21 (3), 203–212.
Capucho, I., San Romao, M.V., 1994.Effect of ethanol and fatty acids on malolactic activity of Leuconostoc oenos. Appl. Microbiol. Biotechnol. 42, 391–395.
Carreté, R., Vidal, M.T., Bordons, A., Constanti, M., 2002.Inhibitory effect of sulphur diox-ide and other stress compounds in wine on the ATPase activity of Oenococcus oeni. FEMS Microbiol. Lett. 211, 155–159.
Comitini, F., Ferreti, R., Clementi, R., Mannazzu, I., Ciani, M., 2005.Interactions between Saccharomyces cerevisiae and malolactic bacteria: preliminary characterization of a yeast proteinaceous compound(s) active against Oenococcus oeni. J. Appl. Microbiol. 99, 105–111.
Cox, D.J., Henick-Kling, T., 1995.Protonmotive force and ATP generation during malolactic fermentation. Am. J. Enol. Vitic. 46, 319–323.
Dick, K.J., Molan, P.C., Eschenbruch, R., 1992.The isolation from Saccharomyces cerevisiae of two antibacterial cationic proteins that inhibit malolactic bacteria. Vitis 31, 105–116.
Edwards, C.G., Beelman, R.B., 1987.Inhibition of the malolactic bacterium, Leuconostoc oenos (PSU-1), by decanoic acid and subsequent removal of the inhibition by yeast ghosts. Am. J. Enol. Vitic. 38, 239–242.
Henick-Kling, T., Park, Y.H., 1994.Considerations for the use of yeast and bacterial starter cultures: SO2and timing of inoculation. Am. J. Enol. Vitic. 45, 464–469.
Larsen, J.T., Nielsen, J.C., Kramp, B., Richelieu, M., Riisager, M.J., Arneborg, N., Edwards, C.G., 2003.Impact of different strains of Saccharomyces cerevisiae on malolactic fermenta-tion by Oenococcus oeni. Am. J. Enol. Vitic. 54, 246–251.
Larsen, N., Boye, M., Siegumfeldt, H., Jakobsen, M., 2006.Differential expression of pro-teins and genes in the lag phase of Lactococcus lactis subsp. lactis grown in synthetic medium and reconstituted skim milk. Appl. Environ. Microbiol. 72, 1173–1179.
Lonvaud Funel, A., Joyeux, A., Desens, C., 1988.Inhibition of malolactic fermentation of wines by products of yeast metabolism. J. Sci. Food Agric. 44, 183–191.
Lonvaud-Funel, A., 1999.Lactic acid bacteria in the quality improvement and depreciation of wine. Ant. Van. Leeuw. 76, 317–331.
Lonvaud-Funel, A., 2002.Lactic acid bacteria—a survey. In: Verlag, T.S. (Ed.), Proceedings of the 13th International Oenology Symposium; 9–12 June 2002. International Asso-ciation of Oenology, Management and Wine Marketing, Montpellier-France, pp. 59–74.
McRae, J.M., Kennedy, J.A., 2011.Wine and grape tannin interactions with salivary pro-teins and their impact on astringency: a review of current research. Molecules 16, 2348–2364.
Mendoza, L., Manca de Nadra, M., Farias, M., 2010.Antagonistic interaction between yeasts and lactic acid bacteria of oenological relevance. Partial characterization of in-hibitory compounds produced by yeasts. Food Res. Int. 43, 1990–1998.
Nehme, N., Mathieu, F., Taillandier, P., 2008. Quantitative study of interactions between Saccharomyces cerevisiae and Oenococcus oeni strains. J Ind. Microbiol. Biotechnol.
http://dx.doi.org/10.1007/s10295-008-0328-7.
Nehme, N., Mathieu, F., Taillandier, P., 2010.Impact of the co-culture of Saccharomyces cerevisiae-Oenococcus oeni on malolactic fermentation and partial characterization of a yeast-derived inhibitory peptidic fraction. Food Microbiol. 27, 150–157.
Osborne, J.P., Edwards, C.G., 2006.Inhibition of malolactic fermentation by Saccharomyces cerevisiae during the alcoholic fermentation under low and high nitrogen conditions: a study in synthetic media. Aust. J. Grape Wine Res. 12, 69–78.
Osborne, J.P., Edwards, C.G., 2007.Inhibition of malolactic fermentation by a peptide pro-duced by Saccharomyces cerevisiae during alcoholic fermentation. Int. J. Food Microbiol. 118, 27–34.
Ozdal, T., Capanoglu, E., Altay, F., 2013.A review on protein-phenolic interactions and as-sociated changes. Food Res. Int. 51, 954–970.
Patynowski, R.J., Jiranek, V., Markides, A.J., 2002.Yeast viability during fermentation and sur lie ageing of a defined medium and subsequent growth of Oenococcus oeni. Aust. J. Grape Wine Res. 8, 62–69.
Reguant, C., Bordons, A., Arola, L., Rozes, N., 2000.Influence of phenolic compounds on the physiology of Oenococcus oeni from wine. J. Appl. Microbiol. 88, 1065–1071.
Remize, F., Gaudin, A., Kong, Y., Guzzo, J., Alexandre, H., Krieger, S., Guilloux-Benatier, M., 2006.Oenococcus oeni preference for peptides: qualitative and quantitative analysis of nitrogen assimilation. Arch. Microbiol. 185, 459–469.
Ribéreau-Gayon, P., Glories, Y., Maujean, A., Dubourdieu, D., 2006.Handbook of Enology Volume 2: The Chemistry of Wine, Stabilization and Treatments. second ed. Dunod, Paris.
Saguir, F.M., Manca de Nadra, M.C., 2002.Effect ofL-malic and citric acids metabolism on the essential amino acid requirements for Oenococcus oeni growth. J. Appl. Microbiol. 93, 295–301.
Schümann, C., Michlmayr, H., del Hierro, A.M., Kulbe, K.D., Jiranek, V., Eder, R., Nguyen, T., 2013. Malolactic enzyme from Oenococcus oeni. Heterologous expression in Escherichia coli and biochemical characterization. Bioengineered. 4 (3), 147–152.
Silva, A., Almeida, B., Sampaio-Marques, B., Reis, M.I.R., Ohlmeier, S., Rodrigues, F., Do Vale, A., Ludovico, P., 2011.Glyceraldehyde-3-phosphate dehydrogenase (GAPDH) is a specific substrate of yeast metacaspase. Biochim. Biophys. Acta 1813, 2044–2049.
Sims, C.A., Eastridge, J.S., Bates, R.P., 1995.Changes in phenols, color, and sensory charac-teristics of Muscadine wines by pre- and post-fermentation additions of PVPP, casein, and gelatin. Am. J. Enol. Vitic. 46, 155–158.
Terrade, N., Mira de Orduna, R., 2009.Determination of the essentiel nutrient require-ments of wine-related bacteria from the genera Oenococcus and Lactobacillus. Int. J. Food Microbiol. 133, 8–13.
Tristezza, M., di Feo, L., Tufariello, M., Grieco, F., Capozzi, V., Spano, G., Mita, G., Grieco, F., 2016.Simultaneous inoculation of yeasts and lactic acid bacteria: Effects on fermen-tation dynamics and chemical composition of Negroamaro wine. LWT Food Sci. Technol. 66, 406–412.
Vaillant, H., Formysin, P., Gerbaux, V., 1995.Malolactic fermentation of wine: study of the influence of some physico-chemical factors by experimental design assays. J. Appl Bacteriol. 79, 64–650.
Versari, A., Patrizi, C., Parpinello, G.P., Mattioli, A.U., Pasini, L., Meglioli, M., Longhini, G., 2015. Effect of co-inoculation with yeast and bacteria on chemical and sensory char-acteristics of commercial cabernet franc red wine from Switzerland. J. Chem. Technol. Biotechnol.http://dx.doi.org/10.1002/jctb.4652.
Yokotsuka, K., Singleton, V.L., 1995.Interactive precipitation between phenolic fractions and peptides in wine-like model solutions: turbidity, particle size, and residual con-tent as influenced by pH, temperature and peptide concentration. Am. J. Enol. Vitic. 46, 329–338.