O
pen
A
rchive
T
OULOUSE
A
rchive
O
uverte (
OATAO
)
OATAO is an open access repository that collects the work of Toulouse researchers and
makes it freely available over the web where possible.
This is a publisher’s version published in : http://oatao.univ-toulouse.fr/
Eprints ID : 19353
To link to this article : DOI:
10.1051/epjap/2017160451
URL : http://dx.doi.org/10.1051/epjap/2017160451
To cite this version :
Fetouhi, Louiza and Petitgas, Benoit and
Dantras, Eric and Martinez Vega, Juan Jorge Mechanical, dielectric,
and physicochemical properties of impregnating resin based on
unsaturated polyesterimides. (2017) The European Physical Journal
Applied Physics, vol. 80 (n° 1). pp. 10901/1-10901/10. ISSN
1286-0042
Any correspondence concerning this service should be sent to the repository
administrator: staff-oatao@listes-diff.inp-toulouse.fr
Regular Article
Mechanical, dielectric, and physicochemical properties
of impregnating resin based on unsaturated polyesterimides
★
Louiza Fetouhi1,2,3,*, Benoit Petitgas3, Eric Dantras4, and Juan Martinez-Vega1,2 1
Université de Toulouse, UPS, INP, CNRS LAPLACE (Laboratoire Plasma et Conversion d’Energie), Toulouse, France
2
CNRS, LAPLACE, 118 route de Narbonne, 31062 Toulouse Cedex 9, France
3 NIDEC Corporation, Bd Marcellin Leroy, 16915 Angoulême Cedex 9, France 4
Physique des Polymères, Institut Carnot CIRIMAT, Université Paul Sabatier, Toulouse, France
Received: 5 December 2016 / Received in final form: 23 May 2017 / Accepted: 7 August 2017
Abstract.This work aims to characterize the dielectric and the mechanical properties of a resin based on an unsaturated polyesterimide diluted in methacrylate reactive diluents used in the impregnation of rotating machines. The broadband dielectric spectrometry and the dynamic mechanical analysis were used to quantify the changes in dielectric and mechanical properties of the network PEI resin, as a function of temperature and frequency. The network characterizations highlight the presence of two main relaxations, a and a0, confirmed by
the differential scanning calorimetry analysis, showing the complexity of the chemical composition of this resin. The dielectric spectroscopy shows a significant increase in the dielectric values due to an increase of the material conductivity, while the mechanical spectroscopy shows an important decrease of the polymer rigidity and viscosity expressed by an important decrease in the storage modulus. The PEI resin shows a high reactivity when it is submitted in successive heating ramps, which involves in a post-cross-linking reaction.
1 Introduction
The resins based on polyesters are widely used in the impregnation industry to provide mechanical and electrical insulating support to the windings of rotating machines. Unsaturated polyesters (UP) are used because of their good mechanical and electrical properties, as well as high temperature resistance [1]. With the technical develop-ments of recent decades, the constraints applied to electrical devices (especially rotating machines such as motors) have increased substantially. The components subjected to increasing temperatures involve the use of varnishes, which are increasingly resistant to heat. This requirement has led to the establishment of thermal classes corresponding to the maximum operating temperature of insulating systems. This performance is meant to develop products of higher thermal classes and has led to the development of new resins’ families, such as polyester-imide based ones. The challenge is to improve the heat resistance of the impregnating resins while considering the implementation aspect. In particular, the final product must be a single component with a viscosity at room temperature less than 2000 mPa·s. They must also be cross-linked according to an industrially applicable thermal cycle. Because of energetic costs, the thermal cycle is preferably of a few hours, with a temperature around
150 °C. In addition, environmental constraints require the reduction of the volatile organic compounds (CoVs) to agree with the new REACH’s standards.
Among the methods used to provide more resistance to polyester resins (UP) is the addition of imide functions, either at the end of the molecules or in the backbone. In the first case, unsaturated polyesterimide oligomer disfunc-tionalized imide is diluted in styrene, resulting in unsaturated polyester resins with terminal functions of imide. In this case, the UP structures are partially modified to improve their properties. The unsaturations located on the end chains do not participate in the copolymerization reaction with the reactive diluent. Consequently, these end chain unsaturations do not take part in building the 3D network, providing few improvements to the resin proper-ties. The other method is the modification of unsaturated polyester chains by incorporating imide structures in the backbone, thus using directly unsaturated polyesterimide prepolymers. This method provides many more improve-ments in thermal and mechanical properties, but then an issue of imide homopolarization occurs. The formation of polyester-imide blocks with high molar masses tends to increase the viscosity of the resin that constitutes a problematic implementation.
The syntheses of polyesterimide resins are generally performed in three steps [2,3]. The first step consists of the synthesis of the unsaturated polyester-imide prepolymer, which involves a polycondensation reaction between hydroxylamine and a heated anhydride. This is followed by a radical copolymerization reaction between the unsaturations of the prepolymer and those of the reactive ★
Contribution to the topical issue “Electrical Engineering Symposium (SGE 2016)”, edited by Adel Razek
* e-mail:fetouhi@laplace.univ-tlse.fr
Eur. Phys. J. Appl. Phys. 80, 10901 (2017) ©EDP Sciences, 2017
DOI:10.1051/epjap/2017160451
T
HEE
UROPEANP
HYSICALJ
OURNAL APPLIEDPHYSICSdiluent, which is generally styrene or vinyl toluene [4]. This copolymerization step is needed to form the 3D cross-linked network, which consists of transition of the polymer from a liquid state to a viscoelastic one. This phenomenon of gelation formation occurs in two successive steps: forma-tion of microgels followed by their coalescence, resulting in the formation of macrogels.
Since the development of unsaturated polyester resins, styrene is the most commonly used reactive diluent, mainly because of its high diluting capacity and its ability to radically copolymerize with the unsaturations of polyes-ters. Because of its high volatility and its hazardous, carcinogenic [5], and pollutant [6] nature, replacing the styrene became a major issue in the impregnating resins industry. Therefore, other reactive diluents have been identified as potentially interesting [7,8]. They can be grouped into three distinct families: styrenic, (meth) acrylic, and allylic diluents. Although researches have shown that acrylic or methacrylic diluents are both used in the resin formulation as a reactive diluent (alone or as a mixture with styrene) [9,10], they are not well studied. Due to its compatibility with polyesters, as well as low viscosity and low volatility during polymerization (1–3%), the BDDMA (1,4-butanediol dimethacrylate) [11,12] can replace styrene as reactive diluent. The choice of BDDMA appears to be potentially interesting because it produces resins with equivalent or better properties to those made in styrene. This is either in terms of implementation or thermal and mechanical resistance.
The resistance of varnishes to mechanical and electrical stresses depends not only on the operating temperature parameter, but also on a solicitation frequency, such as vibration or AC voltage frequencies. Therefore, the study of the characteristic relaxations based on the stress frequency is one of the keys to understand the behavior of these electrical insulators under severe thermal and stress constraints. In this study, we analyze the dielectric and mechanical properties of a thermal class H resin, which has a high operating temperature of 180 °C. This resin is based on an unsaturated polyester-imide precursor and BDDMA and another methacrylate monomer, as reactive diluents. The different characterizations are performed under a wide range of temperatures and frequencies in order to assess the network behavior of the polymer.
2 Experimental
The sample used in dielectric analyses is prepared by coating liquid varnish on Polyimide film (Kapton®). The coated films are then formed using a hydraulic press under a curing cycle usually applied in industry. Two heating ramps are used. The first one is soft and reaches an initial temperature of 130 °C in order to eliminate volatiles and avoid trapping bubbles in the sample. In this step, a copolymerization mechanism between unsaturated polyes-ter-imide prepolymers and the reactive diluent starts and the resin transitions from a liquid state to a viscoelastic one. This is called the gelation process [13]. The second temperature ramp is steeper and involves a cure of 3 h to obtain a solid sample. In the second step, the cross-linking
progresses and tends to be completed. The disk-shaped samples obtained have a radius of 15 mm and a thickness of 0.3 mm. They are then coated with gold by sputtering on each face before measurements. The sample used in mechanical spectroscopy is obtained by curing a block of varnish using the previous curing cycle. The final sample has a bar shape with 0.5 mm thickness, 50 mm length, and 1 mm width and is obtained by mechanical polishing of the varnish block.
The dielectric properties are measured by broadband dielectric spectroscopy (BDS) using a Novocontrol® spectrometer with a ZGS testing cell. Dielectric measure-ments are performed under a nitrogen gas jet by applying a low voltage of 1 V in a temperature range from "50 °C to 210 °C with a ramp of 3 °C min"1. The frequency range is from 0.1 Hz to 106Hz. The data have been obtained in the form of the dielectric complex permittivity (e#= e0" ie00), where e0 and e00 are the permittivity and the dielectric losses, respectively. The loss factor (tan (d)) is derived from the ratio between the imaginary (e00) and the real (e0) parts of the complex permittivity.
The mechanical properties are measured by dynamic mechanical analysis (DMA) using an ARES TA® device. Mechanical spectroscopy measurements are also performed under a nitrogen gas by applying a sinusoidal shear stress of 0.1 Hz to the parallelepiped sample in the same temperature ramp and range conditions as the dielectric spectroscopy. The data are obtained in the form of the shear complex modulus (G#= G0" iG00), where G0and G00are the storage and the dissipative modulus, respectively. The loss factor (tan (d)) is derived from the ratio between the imaginary (G00) and the real (G0) parts of the complex shear modulus. The differential scanning calorimetry (DSC) analysis is performed using a TA Instruments Q2000 DSC to find the resin Tg. A specimen of 9 mg is taken from PEI resin
obtained using the same curing cycle showed above. Two successive scans have been performed by DSC in a temperature range from "50 °C to 210 °C with a ramp of 10 °C min"1.
The samples were characterized by dielectric and mechanical spectroscopies in their solid form. They were previously subjected to 4 scans under temperature ramps and frequency. We initially present the results obtained in the first scan by DMA and in the second scan by BDS to avoid dealing with surface capacitance that generally happens in the first scan of dielectric spectroscopy. Afterwards, we discuss the obtained results by analyzing the four successive performed scans, which allowed preceding the post-cross-linking reaction of the resin.
3 Dielectric and mechanical results
3.1 Mechanical spectroscopy results
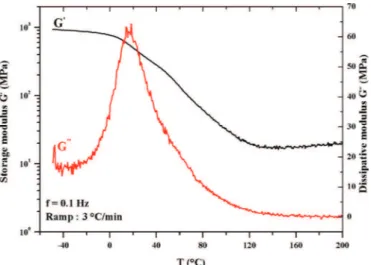
The a relaxation associated to the manifestation of the glass transition temperature could be pointed out using the DMA technique. Three different methods could be used: the extrapolated onset of the sigmoidal change in storage modulus, the peak of the loss modulus signal, or the peak of the tangent delta signal.Figure 1shows the evolution of the storage G0(in black) and the loss modulus G00(in red) of the
PEI resin as function of temperature in the first run of dynamic mechanical analyses. Figure 2 shows the corre-sponding loss factor (tan (d)).
InFigure 1, we can see a significant drop in the storage modulus (G0) over a wide temperature range, from 20 °C to 140 °C. The initial vitreous modulus with a value of almost 1 GPa decreases by about two decades to reach a value of 20 MPa. This strong drop in the polymer rigidity involves an important change in the material viscosity. This shows a significant decrease in the polymer viscosity when it crosses the glass transition temperature domain. According to the simplified Eyring model of viscous fluids [14], the polymer viscosity is proportional to the storage modulus and is inversely proportional to temperature.
The complex modulus (G00) has a maximum of 60 MPa at 20 °C. This peak is related to the network chains mobility located and comforting the presence of a Tgsample in a low
temperature domain.
The tan (d) spectrum shows two peaks inFigure 2. The first one is located at 20 °C and the second one is at about 80 °C. This finding could be related to the presence of two distinct mechanical relaxations, therefore showing the presence of two distinguished phases in the polymer blend. A study conducted by Cousinet et al. [15] highlighted the presence of two peaks on tan (d) spectrum at 70 °C and 165 °C, on UP resins dissolved in methacrylate compounds such as BDDMA and IBOMA (isobornyl methacrylate). The first peak at about 70 °C is from the UP-BDDMA part and is more specifically the phase rich in polyester resin. The second peak at about 165 °C is relative to the phase of IBOMA, whose intensity increased with the concentration of this compound in the overall mix.
3.2 Dielectric spectroscopy results
In this section, we present the dielectric results obtained in the second run of the BDS performed on the PEI resin.
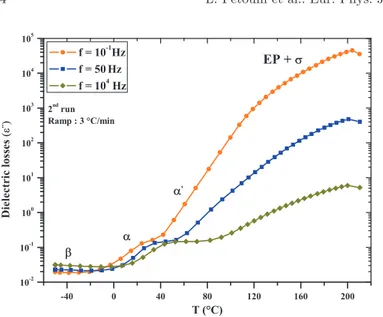
Figures 3and4 present respectively the real (e0) and the imaginary (e00) parts of the complex dielectric permittivity as function of temperature obtained for the isofrequencies of 0.1, 50, and 104Hz.Figure 5displays the corresponding loss factor (tan (d)).
Firstly, one can see that the permittivity (Fig. 3) increases very slightly from "50 °C to 0 °C. Then, this increase begins to be more pronounced from 0 °C and seems to take place two times. Indeed, for the isofrequency of 0.1 Hz, the permittivity increases and reaches the value of 6 at 40 °C and exceeds a value of 10 at 100 °C. These could correspond to the presence of two main relaxations (a and a0), which are related to the increase in polarized dipoles mobility. According to the Adams-Gibbs theory [16], the mobility of these dipoles is allowed by the cooperative segments motions, which is activated at the glass transition temperature (Tg). The possible presence of two dielectric
main relaxations (a and a0) stays in good agreement with the DMA results (Fig. 2) that showed also the presence of two distinguished main relaxations also called a and a0. Polymers with immiscible blends usually show several
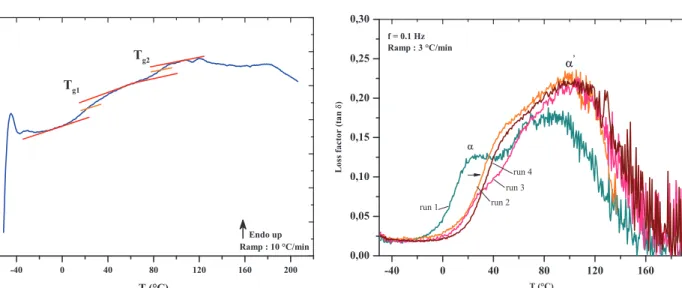
Fig. 2. Loss factor (tan (d)) of the PEI resin as function of temperature obtained at the 1st run of DMA at 0.1 Hz.
Fig. 3. Real part of the complex permittivity (e0) as function of
temperature and frequency obtained in 2nd run by BDS. Fig. 1. Storage (G0) and dissipative (G00) modulus of the PEI
resin as function of temperature obtained at the 1st run of DMA at 0.1 Hz.
main a-relaxations, where each relaxation is related to a glass transition of each component [17,18]. On the same frequency spectrum of 0.1 Hz and from 100 °C, the real part of the complex permittivity continues to increase rapidly and reaches the maximum value of 1050 at 160 °C. This could be related to the electrode polarization (EP) phenomenon, generally observed at low frequencies, which is superimposed to the conduction phenomenon [19,20]. At this lowest frequency (0.1 Hz), a phenomenon of electrode polarization (EP) contributes to the important increase in values, thereby masking the real dielectric response of the material. The molecular origin of the EP phenomenon is the partial blocking of charge carriers at the sample/electrode interface. This leads to a separation of positive and negative charges, which give rise to an additional polarization. The increase in temperature makes it possible for the ionic charges to move from the bulk to the interface between the electrodes and the insulator [21,22]. One can observe a slight decrease in permittivity from 160 °C for the same isofrequency spectrum of 0.1 Hz. This could come from chemical changes in the polymer network rather than from polarization dipoles phenomena. The measurement of the sample thickness after the second run of the dielectric spectroscopy confirms the nonvariation of the sample thickness. It can, therefore, be concluded that the decrease in the observed permittivity could be related to a post-cross-linking process or chemical species removal such as residual humidity.
For the spectra obtained at 50 and 104Hz, the permittivity shows, until 80 °C, a similar behavior than the spectrum of 0.1 Hz. Above 80 °C, it seems that the increase in the permittivity values are less important at high temperatures for these scanning frequencies. This is certainly due to the less pronounced or absence of electrode polarization at higher frequencies. In addition, one can observe the classical shift of the dielectric phenomena to higher temperatures with the increasing frequency.
The imaginary part of the complex permittivity (e00) (Fig. 4) and the loss factor (tan d) (Fig. 5) display four different dielectric processes. The first one is located below 0 °C for the isofrequency of 0.1 Hz. One can observe a slight
drop of the dielectric losses and the loss factor values with the increasing temperature. This could correspond to the end of a relaxation peak, and more precisely to a secondary b-relaxation, which generally occurs at low temperatures. The b-relaxation is due to the motion of local noncooperative dipoles in the condensed phase. In the second temperature domain, located between 0 °C and 100 °C, one can observe a more pronounced increase in both the dielectric losses (e00) and the loss factor (tan d) values. We can observe the first relaxation (a) peak located at 40 °C in both e00 and tan d magnitudes. Around 80 °C, the loss factor spectrum shows the presence of a second peak that could be related to the second main a0relaxation. On the dielectric losses spectrum, it is more difficult to observe the second relaxation peak a0. Indeed, the high temperature conduction overlaps to the polarization electrode (EP) that contributes to mask the dielectric response of the resin, and thus the second relaxation a0. The last temperature domain is located above the main relaxation area (beyond 100 °C). There, one can see an important increase in the dielectric losses and loss factor values. Several phenomena are superimposed, highlighting the complexity of the mechanisms associated with each different magnitude. Indeed, e00and tan (d) increase rapidly and reach the maximum values of 2 $ 105 and 20 respectively, for the lowest frequency of 0.1 Hz. This behavior is typically due to an EP phenomenon overlapped to the high temperature s-conduction. The electrode polarization is induced by the relaxation of extremely mobile space-charge layers in the polymer. Above the Tgregion, the free volume is
increased and makes it possible for the ionic charges to move [16]. This finding is widespread to other frequencies (50 and 104Hz); however, the value of both magnitudes increase less
than for the scanning frequency of 0.1 Hz.
4 Discussion
4.1 Relaxation spectra
The results obtained by mechanical and dielectric spectros-copies show the presence of two distinguished relaxations a and a0 in the studied range [20–140 °C]. The first
Fig. 4. Imaginary part of the complex permittivity (e00) as function
of temperature and frequency obtained in 2nd run by BDS.
Fig. 5. Loss factor (tan (d)) as function of temperature and frequency obtained in 2nd run by BDS.
relaxation (a) is around the room temperature (20 °C) in the mechanical spectroscopy, whereas it is located around 40 °C in the dielectric spectroscopy. The second relaxation (a0) is around 80 °C, taking into account the relaxations observed on each loss factor spectrum obtained by DMA and BDS at the scanning frequency of 0.1 Hz. The presence of two distinguished phases is comforted by the continuous decrease in the storage modulus G0 (cf. Fig. 1). The continuous decrease in viscosity over the range [20–140 °C] could cover both relaxations observed at 20 °C and 80 °C. The presence of two relaxations in the polymer network of the resin suggests the existence of two possible glass transitions. PEI resin is a mixture of at least two polymers with varying levels of miscibility. The studied resin is composed of a polyesterimide precursor present in a reactive diluent of BDDMA and another methacrylate monomer. The partial miscibility of the polyesterimide in the reactive diluent, the homopolymerization of meth-acrylates, or secondary reactions that take place during the synthesis can induce the phase segregation in material [17]. The most commonly used method to evaluate the miscibility of components in a mixture is the analyses of the glass transition temperatures. The presence of two Tg
indicates the presence of two phases in the polymer system. The presence of a single Tgis often attributed to perfectly
miscible polymer blends [18]. The results obtained during a second scan of DSC on the PEI resin are presented in
Figure 6. The DSC spectrum displays two endothermic variations. The first one is at about 25 °C and the second one is at 90 °C.
The measured Tgs on the resin based on PEI and
methacrylate monomers diluent are relatively low (25 °C and 90 °C). The polyester-imide monomers are known for their high glass transition temperature thanks to the imide functions, which increase as a function of the number of imide functions in the polyester matrix. As mentioned in
Section 1, unsaturated polyester resins with terminal imide functions are assumed to provide few improvements to the resin properties. This is because the end chain unsatura-tions do not take part to build the 3D network. In addition,
in this case, the Tgis related to the concentration of the
reactive diluent based on methacrylate, especially the BDDMA that is in contrary known to have a low Tg. The
analysis of the Tgsgives an idea of the methacrylate diluent
content. Studies show that the increase in styrene content shifts the Tgto a higher temperature and stiffens the UP
resin [23]. The use of methacrylate diluent in order to replace styrene seems to be not only for health and environmental interest, but also to reduce the glass transition temperature of the PEI resin. This decrease in the Tgresin is advantageous in the impregnating field. This
suggests that the resin operates in a viscous state, which allows for absorbing vibrations better and mechanical stresses during rotating machine operation.
4.2 Post-cross-linking effects on mechanical properties To study the effect of the PEI resin cross-linking rate on the dielectric and mechanical properties of the resin, we carried out additional scans on samples, those had previously been submitted to two dynamic mechanical and dielectric scans.
The peaks of tan (d) initially observed in the first run tend to extenuate and homogenize in the 2nd, 3rd, and 4th scans (Fig. 7). This suggests that the two distinct relaxations, a and a0, previously highlighted tend to merge as the system advances in its cross-linking. The heteroge-neity of the polymer network is characterized by the increase in the half-depth of tan (d) [24]. However, we observe in the case of PEI resin shrinkage of the area under the curve of tan (d), as the successive scans under a ramp temperature are performed. This leads to two hypotheses. At first we can assume that the blends contained in the PEI resin become increasingly miscible as the cross-linking reaction proceeds. Then, as we mentioned in the introduction, the radical copolymerization between the reactive diluent and the functional units of polyesterimide precursor leads to the formation of 3D chemical gel that rigidify under the influence of heat. During the
polymeri-Fig. 6. Heat flow spectrum as function of temperature obtained by DSC.
Fig. 7. Comparison of the factor of losses (tan (d)) obtained in each run by DMA as function of temperature and for a frequency of 0.1 Hz.
zation, the cross-linked infusible network is formed. Then in continuing the cross-linking of the network, the copolymerization would continue [25].
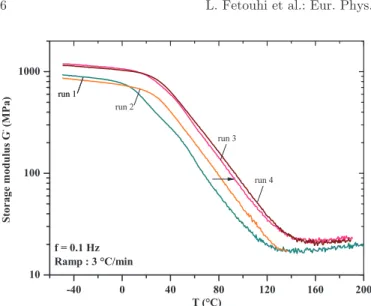
The storage modulus (G0), shown inFigure 8, evolves progressively with the performed scans under temperature ramps. We observe an increase of this modulus on the 4th run of about 5 MPa in a rubbery state. This is directly related to the post-cross-linking phenomenon effect [23]. Indeed, this irreversible phenomenon allows the polymer density to increase and consequently increases its rigidity. This results in the recovery of the cross-linking reaction initiated by the heating ramps.
In Figure 9, we observe a shift of the dissipative modulus (G00) peaks to higher temperatures as the successive runs are performed. However, the maximum of the 3rd scan that appears to be shifted slightly to lower temperatures than the 2nd one is probably due the interval of time between the two scans. The amplitude of G00 decreases on the 2nd and 3rd transitions due to a
post-cross-linking effect. As mentioned above, the loss modulus G00 characterizes the chain network mobility of the polymer. The post-cross-linking of the network during successive scans under temperature has resulted in increased network density and thus reduced the chains mobility. However, the dissipative modulus G00 shows an increase in amplitude of 20 MPa in the last scan. This increase of mobility of the chains might be explained by the initiation of the chemical degradation mechanisms of the polymer network (chain scission), because the network becomes more rigid and denser. The application of four ramping temperature of 3 °C min"1in a temperature range to 210 °C could induce the scission of certain chemical functional groups, such as the covalent band C–O–C, which are known to be the weak point of ester functions. Montaudo and Puglisi [26] located the initial degradation temperatures of polyesters between 230 °C and 300 °C under inert atmosphere.
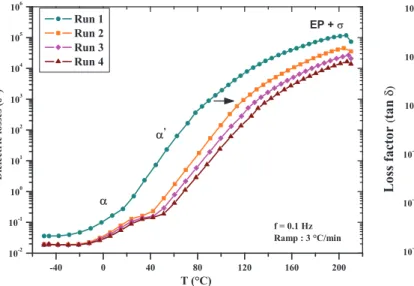
4.3 Post-cross-linking effects on dielectric properties The dielectric properties of the PEI resin obtained in the 3rd and 4th runs are significantly reduced. The permittivi-ty (e0) and the dielectric losses (e00), shown inFigures 10and
11respectively, decrease by about one decade between the first and the last runs for the scanning frequency of 0.1 Hz. Both the number of dipoles and the conduction phenomena due to the electronic and ionic charges motions are significantly reduced on the annealed sample. This reduction in charge carrier mobility and density could be related to the increase in the density network. Indeed, one can observe in bothFigures 11and12a shift of the main a-relaxations initially located at 20 °C and 80 °C to higher temperatures of 40 °C and 120 °C, respectively. The slight fluctuation of the signal intensity, related to the main a relaxations, is attenuated as the heating scans are performed. This is also related to the post-reticulation that occurs in the PEI resin during the different measure-ments, which provides less mobility to the polymer
Fig. 8. Comparison of storage modulus (G0) obtained in each run
by DMA as function of temperature and for a frequency of 0.1 Hz.
Fig. 9. Comparison of dissipative modulus (G00) obtained in each
run by DMA as function of temperature and for a frequency of 0.1 Hz.
Fig. 10. Real part of the complex permittivity (e0) as function of
temperature obtained on the 4 successive runs for the frequency of 0.1 Hz by BDS.
network. In addition, processed polymers are usually in a nonequilibrium state at the end of the shaping process; thus, heating occurs during measurements operates as an annealing that allows the network tending toward an equilibrium state with a structural recovery [27]. The macroscopic properties of the thermosets depend on the cross-link density [15]. The heating increases the average number of cross-links and reduces the average length between them, thus increasing the polymer density.
The increase in dielectric values is partly explained by a decrease in viscosity shown by the mechanical spectrosco-py. In general, the material conductivity is considered to be inversely proportional to its viscosity. Consequently, the post-cross-linking reactions should affect the polymer conductivity directly. In order to analyze more precisely the s-conduction obtained in each dielectric-scanning run, the AC conductivity is presented as function of frequency using equation (1) for temperatures above the glass transition domain (>120 °C) for each run. We consider the measured real part of the AC conductivity (s0
AC) following the universal power law given by:
sAC0 ¼ ve0e00ðvÞ ¼ s þ Avs; ð1Þ where v is the angular frequency, e0 is the vacuum
permittivity, e00 is the measured dielectric losses, A is a temperature-dependent parameter, and s is the exponent of the “universal” power law. s is considered as the DC conductivity obtained at the lowest frequency of 0.1 Hz through the AC conductivity (s0
AC). The angular frequency exponent s is 0 < s <1 and is related to a non-ohmic conductivity [28].
This representation (cf. Fig. 13) allows a plateau to disclose independently on frequency and that corresponds to the DC conductivity magnitude (s). The DC conductivity (s) is calculated by extrapolating the conductivity curves to zero frequency for different temperatures. In the higher frequency region, conductivity sACbecomes dependent and
increases linearly with frequency exhibiting a slope close to 1.
In the first run, one can observe a progressive shift of the plateau toward high frequencies when the temperature increases. These changes correspond not only to the thermally activated character of the AC conductivity but also to the increase of the DC bulk conductivity in the PEI. The sAC value around 10"8V"1cm"1at 210 °C in the
first run decreases to about 10"9V"1cm"1in the last 4th run. As far as the scanning heat is performed, the conduction magnitude is reduced. The annealing allows the resin to improve its dielectric behavior, showing the reduction of the s-conduction of nearly one order of magnitude between the first and the last runs. The Tg
increases with the annealing and allows to better control the free volume expansion responsible of charges motions in the bulk. The material is more stable and the charge carriers are trapped in the thermosetting polymer network. Furthermore, one can see that the reduction in s-conduc-tion after the first run is more important. This comes from not only from the residual water and volatiles elimination and the reduction in the surface capacity, but also from the postlinking progression that happens during the first scanning heat. In the 2nd, 3rd, and the 4th scans, these phenomena tend to be completed.
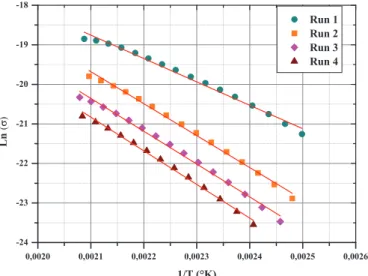
Figure 14 presents the reciprocal temperature depen-dence of the DC conductivity (s) extracted from the AC conductivity values obtained at the lowest frequency of 0.1 Hz for each scanning run. The conductivity being a thermoactivated process, the Arrhenius model written by the following form, fits well DC conductivity (s) values versus the inverse of the temperature:
s¼ s0exp "Ea
kBT ! "
; ð2Þ
where s is the extrapolated DC conductivity from the AC form, s0is the pre-exponential factor, Eais the activation
energy, T is the temperature, and kB is the Boltzmann
constant (kB= 8.62 $ 10"5eV K"1).
Fig. 11. Imaginary part of the complex permittivity (e00) as
function of temperature obtained on the 4 successive runs for the frequency of 0.1 Hz by BDS.
Fig. 12. Loss factor (tan (d)) as a function of temperature obtained on the 4 successive runs for the frequency of 0.1 Hz by BDS.
Above the second Ta0 region, the mechanisms follow the Arrhenius law. The Ta0 region is shifted to higher temper-atures, which is explained by a cross-linking reaction progression resulting in the different sample’s annealing.
The activation energies (Ea) extracted from the
Arrhenius fit are reported in Table 1. The activation energy increases from 0.51 eV obtained in the first run to reach 0.734 eV obtained in the last run of the dielectric spectroscopy. This clearly shows that the physicochemical mechanisms are different between the first and last runs.
Fig. 13. AC conductivity (sAC) as function of the frequency obtained in each dielectric run for each temperature of measurements.
Fig. 14. Extrapolated DC conductivity (s) of PEI resin extracted from the low frequency AC conductivity as function of the inverse of temperature obtained for each run above the Tgregion. The red lines
represent the linear fits using the Arrhenius law.
Table 1. Activation energies obtained for each dielectric scan under ramping temperature.
Scanning run Ea(eV)
1st run 0.510
2nd run 0.697
3rd run 0.716
The activation energy increases with the applied heating. Moreover, this indicates an increase in the potential barrier that the charge carriers have to overcome to jump between sites [29]. The thermal heating induces the post-cross-linking of the polymer network that could stabilize the structures of the PEI resin.
5 Conclusion
This work has highlighted a complementary relationship between the mechanical and dielectric properties of PEI resin conducted by dielectric and mechanical spectros-copies and correlated to its physicochemical characteristics obtained by DSC. The different spectroscopies allow analyzing the polymer network. That gives us precious information on the miscibility of blends contained in the resin. In addition, this study allows evaluating the determining role of curing on the functional properties of the PEI resin.
Both DMA and BDS identify two main relaxations on the PEI resin at about 40 °C and 80 °C. DSC analyses show endothermic jumps associated with the presence of Tgin
the neighboring of these temperatures and in a wide range of temperature [20–140 °C]. The presence of two glass transitions in the polymer network suggests the existence of blends with varying levels of miscibility. This implies a nonmiscibility or a nonperfect compatibility between the precursor polyesterimide with the reactive diluent consist-ing of BDDMA and another methacrylate monomer. However, it is important to note that the peaks associated with relaxations observed on the 3rd and 4th runs on the tan (d) spectrum obtained by DMA seem to homogenize (cf. Fig. 9). This initially implies an increase in the miscibility of the polyesterimide in the BDDMA. On the other hand, the post-cross-linking phenomenon observed on successive runs appears to continue the radical copolymerization reaction between the reactive diluent and polyesterimide. This could improve the different blends miscibility and avoid the previous phase segregation observed in the first run.
The post-cross-linking phenomenon was observed in both mechanical and dielectric properties of the PEI resin. This pointed out by both T0
gsshifts to higher temperatures and the increase in the viscous modulus. The post-cross-linking seems to also improve the insulating properties of the resin with reference to the decrease in dielectric and conductivity values. Otherwise, even the evolution of the dissipative modulus (G00) in the first three runs comforts the post-cross-linking progression in the polymer network. Its increase in the 4th run of mechanical spectroscopy assumes the initiation of chains polymer. This gives a general idea of the several problems that are related to the cure reaction, where copolymerization and degradation reactions are competing. Many publications [30–32] deal with these issues and still do not completely elucidate all aspects of formulation and cure of the impregnating resins. The continuous and significant reduction in the conservative mechanical modulus (G0) observed in a wide temperature range, in the Tgs domain, indicates a
significant dilatation of the material above the Tg. This
could induce two distinct effects. The first effect is related to the decrease of the rigidity of the material, which gives to the material more flexibility and could help to absorb the different vibration and/or mechanical stresses to which the varnish is subjected during operation. The second is related to the presence of the polymer Tgsin the temperature range
of the machine operation, that is 20–140 °C. This involves a continuous transition of the material between the vitreous and the rubbery states [25]. Therefore, the material is constantly subjected to internal stresses of expansion and compression, due to the important dilatation of the resin, which could then contribute to ageing acceleration of the resin and potentially induce microcracks. Many studies deal with microcracking induced by mechanical fatigue (mechanical cycling) [33–36] at the origin of increase in the DP probability of occurrences.
This study shows that a thermal treatment of the resin improves the electrical insulation properties of the resin. The resin appears to be stabilized with the application of thermal annealing to complete its cross-linking and to evacuate the volatile compounds responsible for the reactivity of the resin. Industrially, the application of annealing requires input energy, which would require considerable financial support.
The authors acknowledge the Leroy-Somer Company for their financial support and their co-supervision in the PhD project. The authors are also thankful to the ANRT France for their financial support.
References
1. K.-W. Lienert, Poly(ester-imide)s for Industrial Use (Beck Elektroisolier-Systeme, Hamburg, 1999)
2. H.V. Boenig, Polyesters, unsaturated, in Encyclopedia of Polymer Science and Technology(1964), Vol. 11, pp. 129–168 3. K. Schmidt, D. Wille, U.S. Patent 3,562,219, 1971
4. Anonymous (Dow Chemicals Co.), Vinyltoluene-unsaturat-ed interpolymers and methods of making the same, GB731111, 1952
5. Environmental Protection Agency (2003), Vol. 68
6. US Department of Health and Human Services, Public Health Services, Report on Carcinogens, National Toxicology Program, 12th edn. (2011)
7. P.B. Zetterlund, R.G. Gosden, W. Weaver, A.F. Johnson, New aspects of unsaturated polyester resin synthesis. Part 2. Reactant sequence distribution and its effects on cure kinetics, Polym. Int. 52, 749 (2003)
8. Anonymous (Wyandotte Chemical Corp.), Polyester, GB1062756, 1962
9. Anonymous (General Electric), Improvements relating to electrical insulating structures, GB818038, 1954
10. E.N. Peters, Z. Lin (General Electric), Method for electrical insulation and insulated electrical conductor, US20070066710, 2005
11. J.J. Bozell, G.R. Petersen, Green Chem. 12, 539 (2010) 12. Top value added chemicals from biomass: vol I – results of
screening for potential candidates from sugars and synthesis gas, US Department of Energy, Technical report office of scientific and technical information, N.R.E.L., 2004 L. Fetouhi et al.: Eur. Phys. J. Appl. Phys. 80, 10901 (2017) 9
13. Y.S. Yang, L. Suspene, Curing of unsaturated polyester resins: viscosity studies and simulation in pre-gel state, Polym. Eng. Sci. 31, 321 (1991)
14. H. Eyring, The activated complex in chemical reactions, J. Chem. Phys. 3, 107 (1935)
15. S. Cousinet et al., Toward replacement of styrene by bio-based methacrytes in unsaturated polyester resins, Eur. Polym. J. 67, 539 (2015)
16. J.H. Gibbs, E.A. DiMarzio, Nature of the glass transition and the glassy state, J. Chem. Phys. 28, 373 (1958)
17. E.M.S. Sanchez, C.A.C. Zavaglia, M.I. Felisberti, Unsaturated polyester resins: influence of the styrene concentration on the miscibility and mechanical properties, Polymer 41, 765 (2000) 18. L. Xian, R.A. Weiss, Relationship between the glass transition temperature and the interaction parameter of miscible binary polymer blends, Macromolecules 25, 3242 (1992)
19. S. Diaham, M. Locatelli, Novel high glass transition polyam-ide-imide: Tg influence on electrical conductivity at high
temperature, IEEE Trans. Dielectr. Electr. Insul. 22, 3053 (2015)
20. A.K. Jonscher, Dielectric relaxation in solids, J. Phys. D: Appl. Phys. 32, R57 (1999)
21. P.B. Ishai, M.S. Talary, A. Caduff, E. Levy, Y. Feldman, Electrode polarization in dielectric measurements: a review, Meas. Sci. Technol. 24, 102001 (2013)
22. S. Diaham, M.-L. Locatelli, Time and frequency domains dc conductivity analysis in thin dielectric films at high temperature, J. Phys. D: Appl. Phys. 44, 105402 (2011) 23. N.M. Alves et al., Viscoelastic behavior of poly(methyl
methacrylate) networks with different cross-linking degrees, Macromolecules 37, 3735 (2004)
24. R. Ley, Structural heterogeneities and mechanical properties of vinyl/dimethacrylate networks synthesized by thermal free radical polymerisation, Polymer 43, 4375 (2002)
25. L. Fetouhi, B. Petitgas, E. Dantras, J. Martinez-Vega, Dielectric and mechanical properties correlated to physico-chemical characteristics of a polyester-imide resin used in rotating machines insulations, in International Conference on Dielectric ICD 2016, July 3–7, Montpellier, France (2016) 26. G. Montaudo, C. Puglisi, Thermal degradation mechanisms in condensation polymers, Dev. Polym. Degrad. 7, 48 (1987) 27. J.R. White, Polymer ageing: physics, chemistry or
engineer-ing? Time to reflect, C. R. Chimie 9, 1396 (2006)
28. G.W. Bak, Dielectric relaxation in p-terphenyl crystals, Mater. Sci. Eng. 80, L37 (1986)
29. A. Bouzidi, K. Omri, L. El Mir, H. Guermazi, Preparation, structural and optical investigations of ITO nanopowder and ITO/epoxy nanocomposites, Mater. Sci. Semicond. Process. 39, 536 (2015)
30. K. De La Caba, P. Guerrero, A. Eceiza, I. Mondragon, Kinetic and rheological studies of two unsaturated polyester resins cured at different temperatures, Eur. Polym. J. 33, 9 (1997) 31. A. Yousefi, P.G. Lafleur, R.J. Gauvin, The effects of cobalt
promoter and glass fibers on the curing behavior of unsaturated polyester resin, J. Vinyl Addit. Technol. 3, 157 (1997) 32. Y.S. Yang, L.J. Lee, Rheokinetic studies of unsaturated
polyester resins, Polym. Proc. Eng. 5, 327 (1987–1988) 33. F. Awaja, S. Zhang, M. Tripathi, A. Nikiforov, N. Pugno,
Cracks, microcracks and fracture in polymer structures: formation, detection, autonomic repair, Prog. Mater. Sci. 83, 536 (2016)
34. J.C. Radon, Fatigue crack growth in polymers, Int. J. Fract. 16, 533 (1980)
35. A. Wöhler, Wöhler’s experiments on the strength of metals, Engineering 2, 160 (1867)
36. E.H. Andrews, Cracking and crazing in polymeric glasses, in The Physics of Glassy Polymers, edited by R.N. Haward (Springer, Netherlands, 1973), pp. 394–453
Cite this article as: Louiza Fetouhi, Benoit Petitgas, Eric Dantras, Juan Martinez-Vega, Mechanical, dielectric, and physicochemical properties of impregnating resin based on unsaturated polyesterimides, Eur. Phys. J. Appl. Phys. 80, 10901 (2017)