The Review of Regional Studies
The Official Journal of the Southern Regional Science AssociationLocation Theories and Business Location Decision: A Micro-Spatial
Investigation of a Nonmetropolitan Area in Canada
*Jean Dubé,a,c Cédric Brunelle,b and Diègo Legrosc
aÉcole Supérieure d’aménagement du territoire et de développement régional (ÉSAD), Université Laval, Canada bInstitut National de la recherche scientifique (INRS), centre Urbaninsation, Culture et Société (UCS), Canada
cLaboratoire d’économie de Dijon (LEDi), Université de Bourgogne, France
Abstract: This paper draws on location theories to statistically identify the relationship between the location of individual business establishments and the characterization of their local economic environment. Taking a micro-spatial perspective, the paper develops indicators from distance-based measures (DBM) to serve as independent variables in a discrete choice model (DCM). Using a 2006 database of individual business establishments in the Lower-St-Lawrence region—a coherent, nonmetropolitan subsystem of cities in the province of Québec, Canada— we provide an empirical analysis of the determinants of individual establishments’ location decisions in relation to their main economic activity within a random utility model (RUM) framework. The results show that distance to nearby centers, co-location (specialization), and the size of establishments are statistically related to location decisions. However, unlike previous studies, it is also found that discrete location choices of business establishments in service industries are not necessarily influenced by economic diversity or co-location, whereas manufacturing firms’ location decisions are not impacted by distance to markets. All told, we believe the results provide further evidence of the importance of scale in the study of business location decisions.
Keywords: location decision, spatial distribution, regional development, spatial analysis JEL Codes: C21; R11; R12
1. INTRODUCTION
The location decisions of firms and the distribution of economic activity have long been a central concern in economic geography. From von Thünen (1842) to Krugman (1991), theorists have sought to understand what types of economic activities are located at a given point in space, and why? From the outset, location theory has emphasized the role of distance, economies of agglomeration, and rent seeking in the location of firms and industries.
Most of the theories are developed explicitly from a microeconomic perspective: individual firms or establishments seek to reach an optimum, usually defined as a profit-maximizing or cost-minimizing function. The empirical pattern of the spatial distribution of firms or establishments is treated as a result of this optimum, with the implicit assumption that observed patterns of industrial location are the outcome of spatial sorting at the firm level. However, empirical applications looking at the spatial distribution pattern of economic activities are rarely addressed from a micro
* This research is funded by the Social Sciences and Humanities Research Council of Canada (SSHRC).
Dubé is a Professor of Urban & Regional Economics at Université Laval, Québec, Canada. Brunelle is an Associate Professor of Economic Geography at Institut national de la recherche scientifique (INRS), Centre-Urbanisation Culture Société, Montréal, Québec, Canada; Legros is a senior lecturer in Econometrics at Université de Bourgogne, Dijon, France. Corresponding Author: Jean Dubé—e-mail: [email protected]
© Southern Regional Science Association 2016.
perspective. Moreover, there is no clear consensus about the optimal scale at which such theories hold or the geographical scale at which such effects operate (Shearmur, 2012).
The aim of this paper is twofold. First, it sets out to develop a conceptual framework within which to analyze individual location decisions at a micro-geographic scale, based on (i) a discrete choice model (DCM) derived from a random utility model (RUM) framework and on (ii) the development of individual spatial indicators using distance-based measures (DBM) inspired by the co-agglomeration literature (Marcon and Puech, 2003, 2010; Duranton and Overman, 2005, 2008; Leslie and Kronenfeld, 2011). Second, it aims at testing (i) whether the classical factors underlined by location theories, such as agglomeration economies, are statistically related to individual establishments’ location choices, and (ii) whether the conclusions drawn from such analyses are sensitive to the choice of geographical scale used to define local individual spatial indicators.
An empirical investigation is conducted on an exhaustive list of 9,831 individual business establishments in the Lower-St. Lawrence (LSL) region (Québec, Canada), a nonmetropolitan isolated subsystem of cities. The results indicate that establishments’ location decisions are, overall, in line with predictions from classical location theories. That is, establishments in primary (resource) sectors located away from agglomeration centers in relatively isolated areas, whereas advanced services tend to agglomerate and are prone to co-location. But we find that the location decision for manufacturing establishments is not influenced by the presence of economies of agglomeration, co-location, and diversity. More strikingly, diversity does not necessarily appear to be a key variable for location decisions, while the concentration of economic activities is revealed to be a more important factor at the local scale. These are the key findings in this paper. Insofar as we could detect, they have to date gone unnoticed in the literature on business location decisions, probably because previous studies have not investigated location patterns in a nonmetropolitan context.
The paper is divided into five sections. The first describes factors associated with location, bid-rent theories, and economies of agglomeration, while presenting recent studies on individual firm location decisions using spatial micro-data. The second section sets out the method that we used to establish the possible partial correlations between individual characteristics and location decisions of economic sectors. In the third section, we describe the data used in the course of the analysis and place particular emphasis on our choice of research approach as it relates to the economic sector aggregations, the construction of local indicators, and the underlying hypotheses to be tested. In the fourth section, we present our results and discuss interpretations of them. The fifth section concludes the paper.
2. BUSINESS LOCATION DECISION 2.1 Location Decision
Location theories aim to explain why a firm chooses to locate at one location and not another. In an optimization process that involves either maximizing profit or minimizing cost, a firm’s ultimate location decision necessarily selects the best possible place among a given set of choices and constraints. Economic geography has long been interested in explaining the rationale behind such a location process.
One of the earliest models designed to explain industrial location originated with the work of von Thünen (1842). According to this early model, the distribution of economic activities around a center (the market) is related to the rent that firms derive from being somewhere close to
the center (Capello, 2014). The rent function depends on the characteristics of the establishments and is assumed to be homogenous across establishments engaged in the same main economic activity, partly because prices and costs are assumed to be identical for each product. Thus, for an establishment, , active in the economic sector, , the rent is given by the difference between the sale price and the cost of production, including the shipping cost as follows: .
(1) ∀ 1, … ,
where is the value of the rent for an establishment engaged in economic activity and located at distance from the center, is the sale price of the production of one unit of the good,
is the cost of producing this unit, is the transportation cost for one unit, and is the total production of establishment engaged in economic sector .
This simple model concludes that the rent, which is assumed to be homogenous within the same economic sector , depends on the transportation cost ( ) and the profit per unit ( ). Establishments with high transportation costs and high profits per unit will locate closer to the center because they are willing to pay a higher rent to be there. In the end, the sum of the individual establishments’ location decisions will give the usual concentric spatial distribution of economic activity around a center, with a specific activity within each ring ranging from the economic activity with the highest rent to the economic activity with the lowest rent.
This model was extended with the work of Alonso (1964) to take into account a more complex relationship between rent and distance to the center. According to this model, rent is still a function of distance to the center, , but the relation is more complex; distance can influence cost (in general) and production as follows:
(2) , ∀ 1, … ,
where the cost, , explicitly accounts for different forms of spatial friction, which include opportunity costs, transaction costs, cultural costs, border effects, communication costs, and transportation costs, while production, , is also related to distance to the center, which explicitly accounts for possible agglomeration economies.
2.2 Agglomeration Economies
These predictions are broadly consistent with the vast literature on agglomeration externalities, which provides a sound rationale for the co-location and clustering of economic activities within regions or cities. It has long been argued that certain industries benefit from economic specialization (co-location within an industry), which occurs as a result of the competitive advantages that stem from the pooling of skilled labor, the sharing of inputs, or technological spillovers. In fact, there is plenty of evidence that the proximity of economic activities plays a central role in fostering the competitive advantage of firms and regions. Over time, various types of agglomeration externalities have been identified, broadly referred to as the benefits arising from the co-location and concentration of firms and individuals (Parr, 2002). These are traditionally divided into three categories (Hoover, 1937; Gleaser, 1992; Rosenthal, 2004): economies of scale, localization economies, and urbanization economies.
Economies of scale are cost benefits that firms may gain in relation to serving a particular size of market; cost per unit of output decreases as output increases. Scale economies are not inevitably tied to localized externalities, but they often involve specific benefits that are localized,
© Southern Regional Science Association 2016.
such as a greater local specialization and division of labor, the spreading of fixed costs over larger outputs, or cost reduction through bulk purchase.
Localization economies derive from specific types of economies of scale that are linked to the concentration of activities within a particular industry. Also known as MAR externalities in honor of the seminal works by Marshall (1890), Arrow (1962), and Romer (1968), they describe a set of positive economic externalities that arise from the concentration of activities belonging to the same industry, such as sharing a global labor pool, reducing transportation time (and costs) from suppliers, sharing infrastructures and equipment, and benefiting from knowledge spillovers. Urbanization externalities point in the opposite direction (Jacobs, 1969). Localized spillovers do not arise from specialization, but from advantages gained through the clustering of a variety of sectors and economic activities. Jacobs’s externalities suggest that local competitiveness and innovation may be fostered through the exchange of information or knowledge spillovers between different sectors (Glaeser et al., 1992; Quigley, 1998). Because diversity is generally found in larger cities, these externalities have also been associated with urbanization economies, which are the benefits arising from urban size and density. Rather than spatial externalities generated through the local presence of a diversity of sectors, urbanization economies arise from the sharing of infrastructures, institutions, or other benefits associated with being located in a larger city, such as better access to financial services, information technology services, and the availability of public infrastructures.
Overall, these different possible effects can be reflected through cost or production structure and can influence the final location decision of individual establishments, depending on the type of production or economic sector in which the establishments are engaged. The extended (Alonso-Muth-Mills) model encompasses the different dimensions of agglomeration economies underlying the final location decisions, and to some extent generalizes the theory of Weber (1909). But these models have seldom been tested using individual spatial data: empirical applications have relied largely on aggregated geographic entities (e.g., administrative areas, regions, or municipalities). This is so because agglomeration economies, as argued by some scholars (see Shearmur, 2012), operate at this scale.
2.3 Studies of Location Decisions using Individual (Micro) Data
While key variables influencing the location of individual establishments have been identified in the literature, studies have also frequently produced conflicting empirical results about the relative impacts of agglomeration externalities (Melo et al., 2009; De Groot et al., 2009; Beaudry and Schiffauerova, 2009). One explanation is that the scale at which spatial sorting actually takes place may have been neglected in previous studies. It is only recently that researchers have started to stress the importance of the spatial scale for estimation outcomes (Briant et al., 2010; Andersson et al., 2012). Most studies, however, still rely on aggregations of individual choices for either macro or meso scales (e.g. regions or municipalities), even when empirical analyses aim at explaining discrete business location decisions at the establishment level. This spatial aggregation has the implicit direct consequence of neglecting the uniqueness of location, hence eliminating the heterogeneity existing within the region or city and assuming a homogenous urban-rural gradient for externalities.
When geocoded at fine geographical scales, business micro data can provide valuable information about the economic characteristics of each establishment, allowing the economic landscape to be described within a continuous framework (Dubé and Brunelle, 2014).
Investigations based on spatial micro data have so far focused largely on the location decision of manufacturing plants (Suarez-Villa and Walrod, 1997; Rosenthal and Strange, 2001; Lee, 2008; Lopez and Sudekum, 2009; Ellison et al., 2010; Albert et al., 2011; Fu and Hong, 2011; Rizov and Walsh, 2011; Nguyen et al., 2013), the location of knowledge-intensive firms (Acosta, 2009; Fischer et al., 2009; Ibrahim et al., 2009; Antonietti and Cainelli, 2011; Shearmur, 2012), or on entrepreneurial dynamics (Heebels and Boschma, 2009; Mayer, 2013).
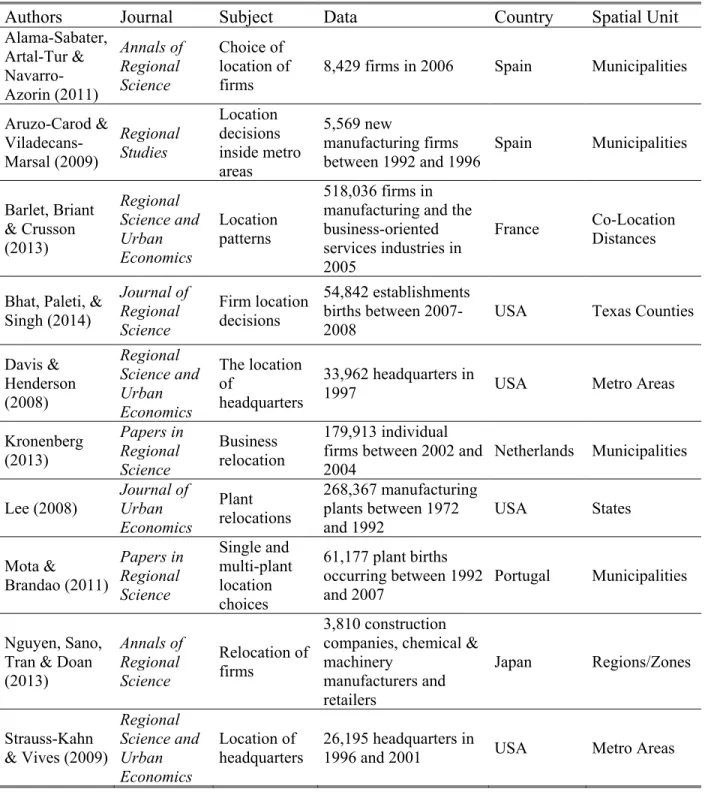
Recently, location choice models have also been proposed at the firm level ( Aruzo-Carod and Viladecans-Marsal, 2009; Alamá-Sabater et al., 2011; Rizov et al., 2012), with studies exploring location decisions for establishments in relation to their main economic activity (Kolko, 2010; Kolko and Neumark, 2010; Barlet et al., 2013; Kronenberg, 2013). The existing empirical studies based on micro-spatial data have so far emphasized the role of agglomeration economies, market size, land cost, and regional endowments in explaining business location decisions (see Table 1 for a summary of the relevant studies). For Spain, Jofre-Monseny et al. (2014) found that most firms in knowledge-intensive industries choose to locate in municipalities with diversified economic environments, while manufacturing and manual labor tends to co-locate in more specialized clusters—results that are in line with those of Bhat et al. (2014) for Texas. Kronenberg (2013) similarly found that knowledge-intensive firms relocating in the Netherlands are predominantly attracted by densely populated municipalities, with own-sector specialization playing an important role for services. Mota and Brandao (2013) further showed that the size of the local markets and accessibility to the main markets play a significant role in the location choice of single plants in Portugal—results that are analogous to other studies looking at the location choice of headquarters (e.g., Davis and Henderson, 2008; Strauss-Kahn and Vives, 2009). Conversely, Shearmur (2012) showed how the KIBS innovator location decision in Montreal (Québec, Canada) does not necessarily display any particular spatial patterns.
Without proposing a new theory, this paper puts forward a novel and original framework for identifying the relationship between the location of individual establishments and the characterization of their local economic environment at fine and continuous geographical scales, i.e., within and between cities. Ultimately, the proposed framework offers a flexible way of testing location theory, co-location dynamics, and agglomeration effects found at a fine geographical scale that is applicable to any particular region, whether metropolitan or not.
3. CONCEPTUAL FRAMEWORK
The precise location decision process of establishments is rarely fully documented or observed. This is the case for some key economic variables such as profit or location rent. Unless this information is directly asked for, through surveys for example (Shearmur, 2012), the only available information about the final location decision is: (i) where exactly an establishment is located; and (ii) what its main economic activity (and output) is. The conceptual framework should thus take into account the available information, while providing a way to link it to the latent variables by assuming that the actual location site implicitly reveals the optimal decision (i.e., where the establishment is located reveals that this is the best possible place to be among a given set of alternatives).
© Southern Regional Science Association 2016.
Table 1: Papers that Address the Location Decision using Individual (Firms) Data
Authors Journal Subject Data Country Spatial Unit
Alama-Sabater, Artal-Tur & Navarro-Azorin (2011) Annals of Regional Science Choice of location of firms
8,429 firms in 2006 Spain Municipalities
Aruzo-Carod & Viladecans-Marsal (2009) Regional Studies Location decisions inside metro areas 5,569 new manufacturing firms between 1992 and 1996 Spain Municipalities Barlet, Briant & Crusson (2013) Regional Science and Urban Economics Location patterns 518,036 firms in manufacturing and the business-oriented services industries in 2005
France Co-Location Distances
Bhat, Paleti, & Singh (2014) Journal of Regional Science Firm location decisions 54,842 establishments births between 2007-2008
USA Texas Counties
Davis & Henderson (2008) Regional Science and Urban Economics The location of headquarters 33,962 headquarters in
1997 USA Metro Areas
Kronenberg (2013) Papers in Regional Science Business relocation 179,913 individual firms between 2002 and
2004 Netherlands Municipalities Lee (2008) Journal of Urban Economics Plant relocations 268,367 manufacturing plants between 1972 and 1992 USA States Mota & Brandao (2011) Papers in Regional Science Single and multi-plant location choices 61,177 plant births occurring between 1992 and 2007 Portugal Municipalities Nguyen, Sano, Tran & Doan (2013) Annals of Regional Science Relocation of firms 3,810 construction companies, chemical & machinery manufacturers and retailers Japan Regions/Zones Strauss-Kahn & Vives (2009) Regional Science and Urban Economics Location of headquarters 26,195 headquarters in
1996 and 2001 USA Metro Areas
Based on the random utility maximization (RUM) framework (Alama-Sabater et al., 2011), we posit that a given establishment, , having its main economic activity in economic sector, , decides to locate where it achieves the optimum profit, i.e., where the rent paid for being in a given place reflects the best choice among the set of alternatives. Although profit and location rent depend on individual establishments’ characteristics, they are also broadly related to the main economic activity of the establishments, as proposed by the von Thünen and Alonso-Muth-Mills
models. The form of the profit function and the rent should reveal the location of similar economic activities around a given point, leading to agglomeration and co-location patterns.
In all cases, the location decision should reflect an optimization process where the profit of an establishment is maximized (or is at least satisficed).1 Profit is a function of the costs and
prices of the market, but also of distance to the markets, , and of the location rent, (Equation (3)). The location rent itself turns out to be a function of the distance to the main centers, , as well as the concentration of activities influencing potential scale economies, , localization economies, , and urbanization economies, (Equation (4)).
(3) , , , , ∀ 1, … ; 1, … ,
(4) , , , ∀ 1, … ; 1, … ,
Ultimately, the location decision is the outcome of a trade-off based on: (i) minimizing production costs (including transportation costs); (ii) minimizing the distance cost to the markets; (iii) maximizing the potential scale economies and agglomeration economies; and (iv) minimizing the price paid for a location (rent).
Since the individual rent functions, , are not observable (latent), we posit that the actual location of an establishment engaged in a given economic activity, ∗, is the location where the rent maximizes the profit of the establishment among all the other possible locations, subject to the other constraints. Therefore, the probability that a given establishment engaged in the economic sector ∗, ∈ ∗ , is located at a particular point ( ; ) is given by the probability
that its profits are at least superior to profits that would be obtained if the establishment were located elsewhere, or profits that would be obtained from this location through being engaged in another economic sector (Equation (5)). This means that the profit for an establishment reflects an optimum location, i.e., where the rent that the establishment is willing to pay is optimized, but also where the economic activities in the direct surroundings (economic landscape) afford the greatest advantages to the establishment and where the distance to the centers is optimized.
(5) ∈ ∗ ∗ ∀ 1, … ; 1, … ,
To simplify, assume that (i) prices are exogenous (and constant) for individual establishments2 and (ii) that the general functions, ∙ and ∙ . This suggests that Equations (3)
and (4) can be expressed as a function linear in the parameters as follows:
(6) , , , , ; ; ,
where is a matrix containing a list of independent variables, , describing the environmental characterization of the establishments as well as the characteristics of the establishments themselves, and is a vector of parameters to be estimated. The parameters express the effect of each variable (or indicator) on the location decision of the establishments according to their main economic activity.
The conceptual framework gives the opportunity to obtain a multiple discrete choice model (Greene, 2005; McFadden, 1984) linking location decisions of individual establishments to their own characteristics and also to the characteristics of their surrounding environment. By assuming
1 Since total maximization is rarely entirely achieved in practice, establishments (or firms) usually try to find a place that generates
enough satisfaction rather than strictly maximizing its profit.
© Southern Regional Science Association 2016.
a particular distribution of the error term in (6), one can obtain a multinomial logit model shown in Equation (7).
(7) ∈ ∗ ∗ ∗ ∗
∑
This model is relatively easy to estimate since no integral needs to be solved (Greene, 2005). Thus, the RUM can be used to identify the factors that are statistically related to the location of the individual establishments, assuming that the effects of the economic variables, , are homogenous within a given economic sector. Drawing on location theories, we should then be able to identify the (average) correlation among the different location decisions, or the economic land-use vocation, as measured by the main economic sector of individual establishments, and the function of the economic landscape surrounding a given establishment. The final location decision of a given establishment should thus be related to what is around that establishment (surrounding economic landscape) and should be a function of the distance to the main centers.
The multinomial logistic model is usually estimated using a category of reference. In the present case, the choice of such a category implies choosing a given economic sector as being the comparative category for latent economic rent. In such a case, the coefficients related to this sector are normalized to one ( 1) and the coefficients in the other categories need to be interpreted by taking into account the reference category. Another interpretation is possible if one decides to report the marginal effect, evaluated with respect to the mean value of the independent variables instead of basing the analysis on the estimated coefficients alone. In such a case, it is possible to retrieve the effect of the individual independent variables for all values of the dependent variable, thereby making interpretation easier.
4. EMPIRICAL APPLICATION
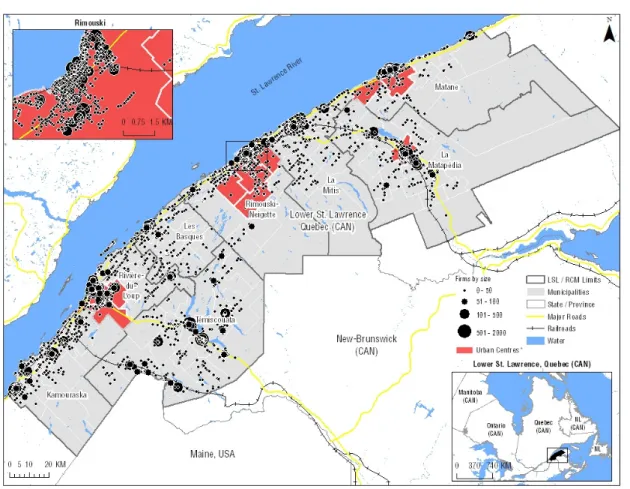
The proposed empirical analysis is carried out using micro data for Québec’s Lower St. Lawrence (LSL) region, a remote, nonmetropolitan area. The region is a reasonable test site for the analysis of establishments’ location decisions outside large metropolitan areas. It stands as both a coherent and isolated subsystem of cities and municipalities located between a ninety minute to five hour drive from the closest metropolitan area (Québec City), while large enough to provide sufficient levels of spatial and industrial heterogeneity. The region comprises a total of 133 cities and municipalities, divided into seven Regional County Municipalities (RCM), and includes four urban centers of varying densities: Rimouski (pop. 50,912), Rivière-du-Loup (pop. 27,734), Matane (pop. 18,368), and Amqui (pop. 6,322) (see Figure 1). The region covers twenty-two thousand square kilometers (22,404 km2) along a 320-kilometer stretch of the St. Lawrence
River, making population densities relatively low. The density of jobs and number of firms per square kilometer in 2006 were, respectively, 4.269 and 0.439.
4.1 Choice of Industrial Classification
It is assumed that the location rent is related to the main economic activity of a given establishment, thus imposing the requirement to make a choice about the definition of the class of main economic activities. The classification of the economic activities needs to be loose enough to capture the location patterns of establishments with homogenous activities, but not so loose that it fails to ensure a minimum number of observations in each class.
Figure 1: Map of the Location of Establishments in the Lower St. Lawrence Region, 2006
* Agglomerations of more than 6,000 inhabitants
Although the spatial micro-data offer the possibility of directly testing the modifiable areal unit problem (MAUP), the empirical analysis nevertheless rests on the aggregation of economic activities into general classes, which are themselves subject to the same problem. This aggregation is meant to identify the main economic vocation of the individual establishments and necessarily assumes that the classes include establishments that operate in similar activities, or at least that the location decisions of the establishments are comparable across the same economic activities. This choice necessarily implies a potential problem similar to the classical MAUP: choosing to define the economic sectors differently may return different results.
The analysis should then allow for this potential weakness in the results. The aggregation bias is not, in this case, related to the spatial dimension, but to the aggregation of economic activities. For this exercise, the classification has been inspired by the recent work of Kolko (2010) and relies on the main economic activity, as defined by the North American Industry Classification System (NAICS) codes. A decomposition of the economic activities into 14 economic sectors is proposed (Table 2).
4.2 The Establishments Database
The database is derived from the List of Industries and Trade (LIT) from the Québec Ministry of Employment and Social Security (MESS). This source offers data compiled at the establishment level for the entire population of establishments in the LSL region. Information is gathered through local partners, where collection methods may be comparable to an annual census
© Southern Regional Science Association 2016.
Table 2: Structure of the Dependent Variable According to the Definition of the Economic Activity (or Sectors)
Aggregated Disaggregated Economic activities NAICS code Primary
activities
Agriculture Crop production, Animal production and aquaculture and
support activities
111; 112; 1151; 1152
Resources & Extraction
Forestry, logging, fishing, hunting, mining, quarrying & oil/gas extraction
113; 114; 1153; 21 Manufacturing Manufacturing Manufacturing 31; 32; 33 Trade &
Transport
Wholesale trade Wholesale trade 41
Retail trade Retail trade* 44; 45
Transport Transportation and warehousing 48; 49
Local activities
Construction Construction 23
Proximity Retail Services
Food and beverage stores; Health and personal care stores; Gasoline stations
445; 446; 447 Accommodation
& Food
Accommodation & food
services 72
Other services Other services (except public administration) 81
Services
FIRE Finance & Insurance; Real estate and rental and leasing 52; 53
KIBS
Professional, scientific &
technical services; Management; Administrative support & waste and remediation services
54; 55; 56
Arts & Media
Information & cultural
industries; Arts, entertainment
& recreation 51; 71 Public services Public services Education; Health & Public administration 61; 62; 91 *Excluding NAICS 445, 446 & 447
by economic sector where partners try to contact all legal firms listed in their territory during the year. This results in data coverage in particular economic sectors being of better quality than others.
Spatial observations (establishments) are provided with their exact address, which allows geocoding and retrieval of the exact geographical coordinates (Figure 1). The number of jobs is given for each establishment, corresponding to the number of employees at the company’s busiest period during a full year. The database also reports the main economic activity of the firm by using the NAICS code at the six-digit level.
Yet, a comparison with official data sources such as census data and labor force surveys yields a similar distribution once aggregated (Brunelle et al., 2013). Despite the fact that the
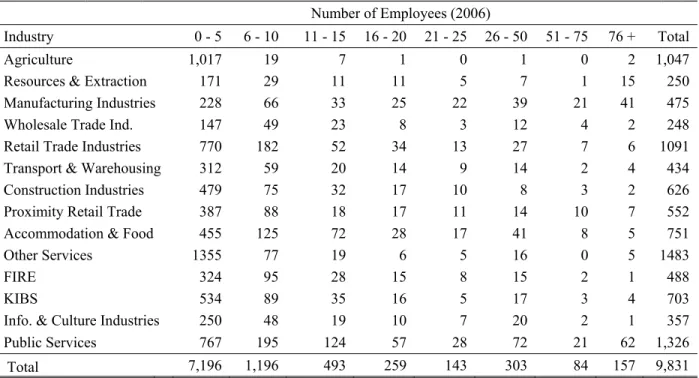
Table 3: Distribution of the Total Number of Firms According to Size (Total Employment) and Main Economic Activity, 2006
Number of Employees (2006)
Industry 0 - 5 6 - 10 11 - 15 16 - 20 21 - 25 26 - 50 51 - 75 76 + Total
Agriculture 1,017 19 7 1 0 1 0 2 1,047
Resources & Extraction 171 29 11 11 5 7 1 15 250 Manufacturing Industries 228 66 33 25 22 39 21 41 475 Wholesale Trade Ind. 147 49 23 8 3 12 4 2 248 Retail Trade Industries 770 182 52 34 13 27 7 6 1091 Transport & Warehousing 312 59 20 14 9 14 2 4 434 Construction Industries 479 75 32 17 10 8 3 2 626 Proximity Retail Trade 387 88 18 17 11 14 10 7 552 Accommodation & Food 455 125 72 28 17 41 8 5 751
Other Services 1355 77 19 6 5 16 0 5 1483
FIRE 324 95 28 15 8 15 2 1 488
KIBS 534 89 35 16 5 17 3 4 703
Info. & Culture Industries 250 48 19 10 7 20 2 1 357 Public Services 767 195 124 57 28 72 21 62 1,326 Total 7,196 1,196 493 259 143 303 84 157 9,831
frequency and methods for updating the database vary among different local partners, the organization estimates that nearly thirty percent of establishments on the list are in fact continuously updated on a day-to-day basis, while the remainder is updated once a year. In 2006, the total number of firms (excluding firms in utilities—NAICS 223) was 9,831, with most of the
firms having fewer than five employees (Table 3).
The main advantage of the spatial micro-data is that they can be used to test for the MAUP. However, as previously mentioned, this test can be made for a given economic aggregation and the results should be correctly interpreted for that aggregation. A different classification of economic activities can be proposed and the MAUP can then be tested using this alternative proposition, which is beyond the scope of the paper.
4.3 Constructing Local Indices to Characterize the Local Environment
As theory suggests, an establishment’s optimal location depends on a given number of factors reflecting the spatial concentration or dispersion of economic activities, as well as the distance to city centers (or markets). Apart from the establishments’ characteristics, we are also interested in describing the local economic environment of the establishments to fill the matrix with independent variables calculated using distance-based measures (DBM).
Assuming that the individual establishments are denoted by 1,2, … , and that the exact location of each establishment is given by its geographical coordinates ( ; ), it is possible to calculate the (Euclidian) distance separating all the establishments. The distances between establishments can be summarized into a square (distance) matrix of dimension . Introducing a cut-off criterion (or a critical radius of influence), this matrix can be used to calculate
© Southern Regional Science Association 2016.
the number of firms (or total employment) located in the direct vicinity of each establishment using a simple (connectivity) matrix calculation (Dubé and Legros, 2014, 2015; Dubé and Brunelle, 2014).
By varying the definition of the radius of influence, we can retrieve a variety of indices commonly used in the literature to account for different types of localized externalities around each establishment. This is simply done by counting the number of establishments and employees in the different economic sectors within a given radius. According to this approach, the indices are unique to each business establishment, leading to 9,831 values of a given indicator, while the values change according to the choice of the radius selected to calculate what is around a given establishment.
In all cases, an interesting feature of the approach is that varying the radius of influence (or cut-off distance value) allows one to define different variables, thus providing a different definition of the independent variables (the indices). This property means we can formally test whether the choice of a distance threshold influences the estimations performed through econometric analysis. This approach thus explicitly and formally allows us to test for the modifiable areal unit problem (MAUP).
From another perspective, the possibility of defining a different radius of influence enables one to search for a possible “optimal” way of defining such a radius and test for differences in such values among regions, knowing that any value of the radius of influence can paint a different picture, thus allowing us to test for the MAUP, but not to solve the problem. Moreover, the analysis can be extended to the search for an optimal distance cut-off value for each indicator (diversity, concentration, etc.) by considering the different sets of combinations. This can be done by keeping a fixed cut-off distance to calculate the diversity index, while varying the cut-off distance used to calculate the concentration indices, and so on.
Finally, it is possible to calculate, for each establishment i, the Euclidian distance that separates it from the different markets (i.e., large agglomerations centers4), using the geographical
coordinates ( ; ). The four main cities that were selected in our particular case study are Rimouski, Rivière-du-Loup, Matane, and Amqui, as well as Québec City, the second largest city of the province.
All of these variables are included as independent variables to test whether or not there exists a statistical link between the local economic environment derived from the spatial distribution of firms and the location choices (economic activity) of individual business establishments.
Ultimately, the models include a list of 21 independent variables that characterize firms and the economic environment within their local vicinity: the total employment size of the establishment (in log form) ( ), measuring the importance of the scale economies; the total number of jobs around the establishment (in log form) ( ); a list of 14 location quotients (one for each economic sector) ( to ), measuring the degree of concentration of economic activities (agglomeration economies); the Herfindahl index ( ), measuring the importance of the diversity of economic activities (urbanization economies); and the logarithmic transformation of the distance (in meters) to the different markets corresponding to the largest nearby cities ( to ), measuring the impact on the rent of the distance to the main centers.
4.4 The Hypothesis to be Tested
Generally, it is expected that the size of the establishments should have a positive impact in industries that are prone to benefit from within-firm scale economies (e.g., resource extraction, manufacturing, finance and insurance companies, or public services). Agglomeration economies, as provided by the size of activities in the surroundings of the establishment (economic environment), are, on the other hand, projected to positively influence the location of firms in retail, accommodation and food, and public services.
It is also expected that own-sector co-location (specialization), measured by the location quotient, will positively impact the location choices of establishments. These effects should be greater in manufacturing and high order business services, which are often described as highly co-localized as an outcome of positive externalities generated through close spatial proximity. Similar activities are also expected to cluster together, while co-location between establishments in specific industries is predicted to vary according to the given economic activity.
Previous studies on business location decisions have also emphasized the positive relationship between urban diversity and the location of knowledge-intensive industries (Kronenberg, 2013; Mota and Brandão, 2013; Bhat et al., 2014; Jofre-Monseny et al., 2014). Hence, it is hypothesized that the diversity of activities, measured by the Herfindahl index, will also have a positive effect on the location of firms in service industries. High-order services, such as finance, insurance, and real estate (FIRE), as well as knowledge-intensive business services (KIBS) should exhibit the strongest positive relations with diversity, while this association is expected to be negligible for establishments in goods-producing industries.
Lastly, the effect of distance to the various urban centers should be a significant factor in firms’ location choices. Results are expected to depend largely on the type of activity: it is expected that capital-intensive and resource activities will exhibit a positive association with distance, whereas economic activities relying on proximity to markets or the need for interactions and human capital (such as firms in high-order services) will be negatively impacted by distance to urban centers.
5. RESULTS
Before turning our attention to the estimation results, it should be noted that since the models are estimated using a spatial cross-sectional database, the results should not be interpreted as causal relations. It is impossible to ascertain the temporality and, by extension, the direction of the causality of the observed patterns with such data (without an instrumental variables or other means of identification). The results are to be interpreted for what they really tell: the coefficients reflect, at a given point in time, partial correlations among the location choices of establishments according to their main economic activity (the dependent variable), the characteristics of the establishments, as well as the surrounding economic characteristics. Statistical relationships are further investigated through the calculation of the marginal effects (not through values of the coefficients). These calculations provide a more direct and straightforward interpretation of the results.
© Southern Regional Science Association 2016.
5.1 About Spatial Variations of Partial Correlation
A total of 19 models5 are estimated, each of them progressively increasing the radius of
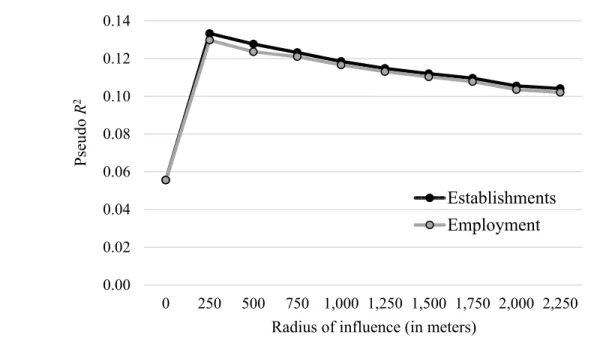
influence by 250 meters. For each specification, the model is estimated on the whole sample size (n = 9,831 firms). Global statistics over some specification of the local indicators in relation to the specified radius of influence show that the performance varies with the distance used to calculate the independent variables. Interesting preliminary observations are revealed through the
pseudo-R2 statistic (Figure 2). First, it underlines the importance of the concentration (total employment),
diversity (Herfindahl index), and co-location indices (location quotients) within the given radius, with the pseudo-R2 more than doubling when introducing these variables into the model (as
compared to distance 0). Second, models estimated using the number of establishments to define the independent variables offer a slightly better performance than the alternative models using the total employment size of individual establishments, although the difference is negligible. More importantly, this reveals that the choice of the distance cut-off value influences the global performance of the models. Models with a smaller radius of influence offer better performance, suggesting that these models capture the presence of local effects when there is greater variability in the independent variables. On the other hand, these variations may also be interpreted as evidence of MAUP issues, such as the results varying with the choice of the spatial delimitation, with the significance of the estimated parameters varying with the choice of the radius of influence. This is particularly important for nonmetropolitan areas since, for these regions, the aggregated data are subject to larger spatial delimitations.
Overall, these results support the idea that there could be implications when location theories are tested using aggregated data, and even more so for large spatial aggregations. The pseudo-R2
Figure 2: Pseudo-R2 for Given (Local) Distance Thresholds
5 We estimated nine models using the total employment to define the Herfindahl index and the location quotients, while the same
number of models were estimated using the number of establishments to define these indices. One model was estimated using only the employment of the establishment itself as well as the distance (in log form) to the different centers. This model can be deemed a particular case when the cut-off distance is set to 0.
0.00 0.02 0.04 0.06 0.08 0.10 0.12 0.14 0 250 500 750 1,000 1,250 1,500 1,750 2,000 2,250 Establishments Employment Pseudo R 2
values fall by more than twenty-five percent when comparing the results based on a radius of 250 meters to the results obtained using a radius of 2 kilometers.6 This reveals that the role of the spatial
externalities in the location decision process may be largely related to the (usually exogenous) choice of how spatial data are aggregated over space. This may partly explain why empirical results vary (Melo et al., 2009; De Groot et al., 2009).
5.2 A Particular Case Using 250 Meter Radius of Influence
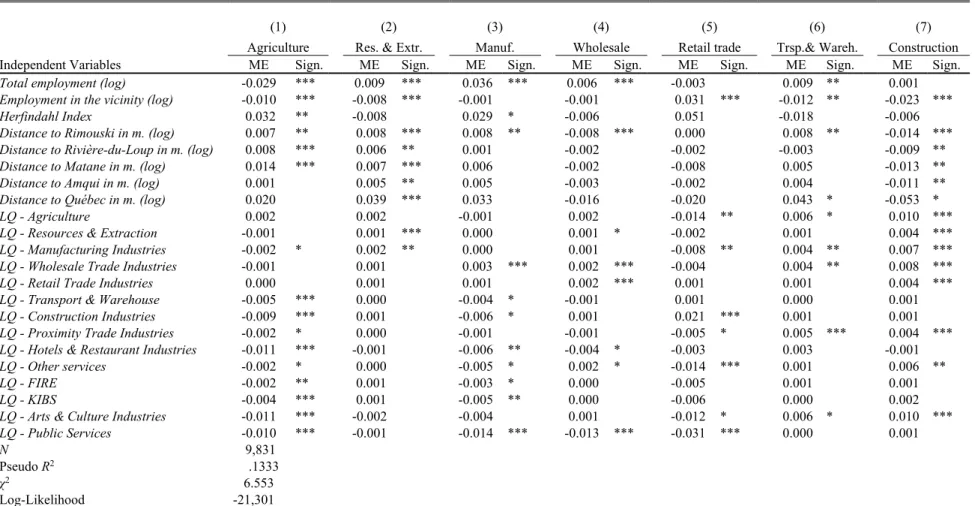
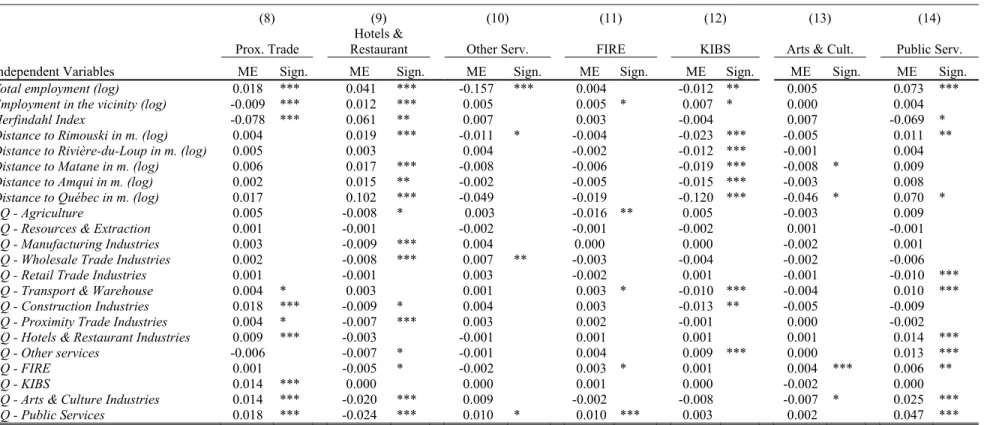
The marginal effects based on the model using the 250-meter distance threshold reveal some interesting patterns in relation to our previous hypotheses (Table 4). Note again that these should not be interpreted as causal effects but, rather, as partial correlations among characteristics of the firms and their vicinity.
The economic literature on location theories has underlined the importance of economies of scale in establishments’ final location decisions. The marginal effects related to the size of firms (natural log of total employment) were introduced to control for such a possibility. Hence, observing a positive marginal effect indicates that the bigger the establishment is, the higher the probability is that an establishment being in a given point is active in this economic sector . The results show that this observation holds for Resources & Extraction, Manufacturing; Wholesale Trade, Transport & Warehousing; Proximity Trade; Accommodation & Foods; and Public Services. On the other hand, observing an establishment with fewer employees at a given point yields a higher probability that such an establishment is active in Agriculture, Other Services, or KIBS industries. This is in line with what one would expect: Manufacturing, Public Services, Resource & Extractions, or Accommodation & Food usually require larger establishments, while Other Services, Agriculture, and KIBS establishments usually require smaller establishments.
Location theories also suggest that economic diversity and or concentration should be key factors for the location of firms, particularly in industries known to benefit from agglomeration economies (e.g., high-order service industries). The role of economies of agglomeration is first investigated through the total number of jobs in the direct vicinity of the establishments, i.e., through localization economies. This assumption is partly confirmed, since these effects appear to be significant for the FIRE and KIBS sectors: the more jobs there are in the vicinity, the more likely it is that the establishment at a given point will be engaged in one of these economic sectors. The same is found for Accommodation & Food and Retail Trade establishments. Conversely, the concentration of jobs in the vicinity reduces the probability of finding establishments active in the primary activities, Transportation & Warehousing, Construction, and Proximity Trade. Establishments that require large areas of land will generally inhibit, through the ownership of large private estates, other firms from locating close by.
The concentration of similar economic activities may be another reason why establishments choose to locate at a given point and not somewhere else, i.e., co-location matters for location decisions. Here, the results show that the co-location pattern (e.g., high location quotient in the same economic sector) is not a dominant factor in the location decision of business establishments. The co-location index appears to be significant for establishments active in Resources & Extraction, Wholesale Trade, Proximity Trade, FIRE, and Public Services. However, interestingly, it is found that a high location quotient for KIBS in a given point raises the
© Southern Regional Science Association 2016. ISSN 1553-0892, 0048-749X (online)
www.srsa.org/rrs
Table 4: Estimation Results of the Marginal Effects for a Local Radius of Influence of 250 Meters
(1) (2) (3) (4) (5) (6) (7)
Agriculture Res. & Extr. Manuf. Wholesale Retail trade Trsp.& Wareh. Construction
Independent Variables ME Sign. ME Sign. ME Sign. ME Sign. ME Sign. ME Sign. ME Sign.
Total employment (log) -0.029 *** 0.009 *** 0.036 *** 0.006 *** -0.003 0.009 ** 0.001
Employment in the vicinity (log) -0.010 *** -0.008 *** -0.001 -0.001 0.031 *** -0.012 ** -0.023 ***
Herfindahl Index 0.032 ** -0.008 0.029 * -0.006 0.051 -0.018 -0.006
Distance to Rimouski in m. (log) 0.007 ** 0.008 *** 0.008 ** -0.008 *** 0.000 0.008 ** -0.014 ***
Distance to Rivière-du-Loup in m. (log) 0.008 *** 0.006 ** 0.001 -0.002 -0.002 -0.003 -0.009 **
Distance to Matane in m. (log) 0.014 *** 0.007 *** 0.006 -0.002 -0.008 0.005 -0.013 **
Distance to Amqui in m. (log) 0.001 0.005 ** 0.005 -0.003 -0.002 0.004 -0.011 **
Distance to Québec in m. (log) 0.020 0.039 *** 0.033 -0.016 -0.020 0.043 * -0.053 *
LQ - Agriculture 0.002 0.002 -0.001 0.002 -0.014 ** 0.006 * 0.010 ***
LQ - Resources & Extraction -0.001 0.001 *** 0.000 0.001 * -0.002 0.001 0.004 ***
LQ - Manufacturing Industries -0.002 * 0.002 ** 0.000 0.001 -0.008 ** 0.004 ** 0.007 ***
LQ - Wholesale Trade Industries -0.001 0.001 0.003 *** 0.002 *** -0.004 0.004 ** 0.008 ***
LQ - Retail Trade Industries 0.000 0.001 0.001 0.002 *** 0.001 0.001 0.004 ***
LQ - Transport & Warehouse -0.005 *** 0.000 -0.004 * -0.001 0.001 0.000 0.001
LQ - Construction Industries -0.009 *** 0.001 -0.006 * 0.001 0.021 *** 0.001 0.001
LQ - Proximity Trade Industries -0.002 * 0.000 -0.001 -0.001 -0.005 * 0.005 *** 0.004 ***
LQ - Hotels & Restaurant Industries -0.011 *** -0.001 -0.006 ** -0.004 * -0.003 0.003 -0.001
LQ - Other services -0.002 * 0.000 -0.005 * 0.002 * -0.014 *** 0.001 0.006 **
LQ - FIRE -0.002 ** 0.001 -0.003 * 0.000 -0.005 0.001 0.001
LQ - KIBS -0.004 *** 0.001 -0.005 ** 0.000 -0.006 0.000 0.002
LQ - Arts & Culture Industries -0.011 *** -0.002 -0.004 0.001 -0.012 * 0.006 * 0.010 ***
LQ - Public Services -0.010 *** -0.001 -0.014 *** -0.013 *** -0.031 *** 0.000 0.001
N 9,831
Pseudo R2 .1333
χ2 6.553
Log-Likelihood -21,301
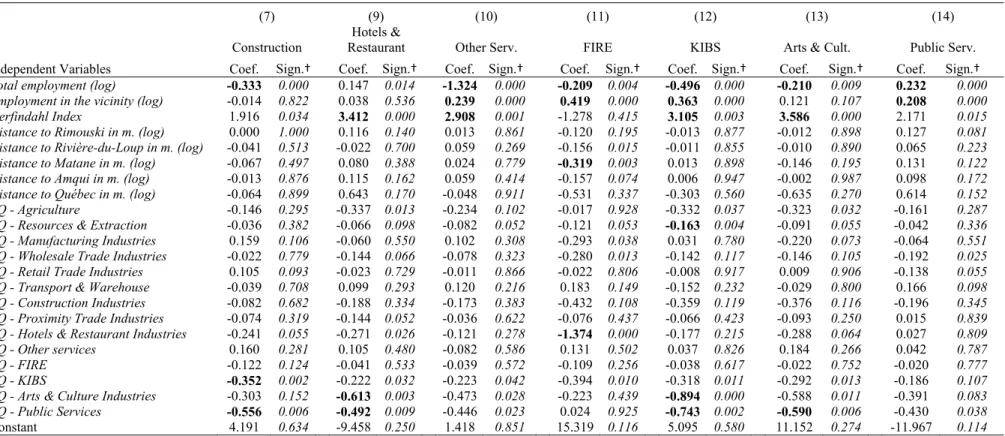
Table 4 (Continued): Estimation Results of the Marginal Effects for a Local Radius of Influence of 250 Meters
(8) (9) (10) (11) (12) (13) (14)
Prox. Trade
Hotels &
Restaurant Other Serv. FIRE KIBS Arts & Cult. Public Serv.
Independent Variables ME Sign. ME Sign. ME Sign. ME Sign. ME Sign. ME Sign. ME Sign.
Total employment (log) 0.018 *** 0.041 *** -0.157 *** 0.004 -0.012 ** 0.005 0.073 ***
Employment in the vicinity (log) -0.009 *** 0.012 *** 0.005 0.005 * 0.007 * 0.000 0.004
Herfindahl Index -0.078 *** 0.061 ** 0.007 0.003 -0.004 0.007 -0.069 *
Distance to Rimouski in m. (log) 0.004 0.019 *** -0.011 * -0.004 -0.023 *** -0.005 0.011 **
Distance to Rivière-du-Loup in m. (log) 0.005 0.003 0.004 -0.002 -0.012 *** -0.001 0.004
Distance to Matane in m. (log) 0.006 0.017 *** -0.008 -0.006 -0.019 *** -0.008 * 0.009
Distance to Amqui in m. (log) 0.002 0.015 ** -0.002 -0.005 -0.015 *** -0.003 0.008
Distance to Québec in m. (log) 0.017 0.102 *** -0.049 -0.019 -0.120 *** -0.046 * 0.070 *
LQ - Agriculture 0.005 -0.008 * 0.003 -0.016 ** 0.005 -0.003 0.009
LQ - Resources & Extraction 0.001 -0.001 -0.002 -0.001 -0.002 0.001 -0.001
LQ - Manufacturing Industries 0.003 -0.009 *** 0.004 0.000 0.000 -0.002 0.001
LQ - Wholesale Trade Industries 0.002 -0.008 *** 0.007 ** -0.003 -0.004 -0.002 -0.006
LQ - Retail Trade Industries 0.001 -0.001 0.003 -0.002 0.001 -0.001 -0.010 ***
LQ - Transport & Warehouse 0.004 * 0.003 0.001 0.003 * -0.010 *** -0.004 0.010 ***
LQ - Construction Industries 0.018 *** -0.009 * 0.004 0.003 -0.013 ** -0.005 -0.009
LQ - Proximity Trade Industries 0.004 * -0.007 *** 0.003 0.002 -0.001 0.000 -0.002
LQ - Hotels & Restaurant Industries 0.009 *** -0.003 -0.001 0.001 0.001 0.001 0.014 ***
LQ - Other services -0.006 -0.007 * -0.001 0.004 0.009 *** 0.000 0.013 ***
LQ - FIRE 0.001 -0.005 * -0.002 0.003 * 0.001 0.004 *** 0.006 **
LQ - KIBS 0.014 *** 0.000 0.000 0.001 0.000 -0.002 0.000
LQ - Arts & Culture Industries 0.014 *** -0.020 *** 0.009 -0.002 -0.008 -0.007 * 0.025 ***
LQ - Public Services 0.018 *** -0.024 *** 0.010 * 0.010 *** 0.003 0.002 0.047 ***
© Southern Regional Science Association 2016. ISSN 1553-0892, 0048-749X (online)
www.srsa.org/rrs
probability of finding another establishment engaged in this specific sector, suggesting a spatial concentration of such activities.
Economic diversity, or urban economies, should also be key factors, particularly in industries known to benefit from agglomeration economies (e.g., high-order service industries). Surprisingly, the estimated coefficients for the diversity of firms’ local environments, as measured by the Herfindahl index,7 show no significant impact for several sectors. Small effects are found
in particular cases. High economic diversity at a given point (Herfindahl index close to 0) increases the probability of finding establishments engaged in Proximity Trade or Public Services, while low economic diversity increases the probability that establishments located at this point will be active in Agriculture or Accommodation & Food. Still, overall, having a diversified economic environment in the immediate surroundings of an establishment does not increase the probability of choosing that particular location. The decision seems more generally related to the concentration of employment in the local environment, at least for the LSL region.
Without invalidating earlier work, these findings highlight that an important distinction should be drawn regarding the effect of concentration: diversity may not necessarily be the key variable in nonmetropolitan subsystems of cities. In such a context, the concentration of economic activities is revealed to be more important, at least at small spatial scales. Diversity may have a significant impact on the location choice of firms between municipalities and regions, but does not influence the choice of a particular environment within the region or municipality. Hence, the fact that diversity does not stand as a strong location factor at the micro level suggests that these effects tend to emerge at larger scales, or simply that urbanization economies cannot be measured in a nonmetropolitan context. While localization economies appear to be significantly related to the location decision of individual establishments, the results show that urbanization economies are only marginally related to location choice in the case of a nonmetropolitan area. This point should be kept in mind, as this result has remained largely unnoticed in the literature on business location decisions thus far.
The final assumption with regard to the discrete location choices of individual establishments is that distances to centers, or urban CBDs, should have an important impact on the spatial sorting of industries. Location theories suggest that some establishments, particularly represented in some economic activities, will be willing to pay a higher rent to be located at the centers, where proximity to markets (demand), human capital, and knowledge spillovers are the highest, while other activities should be pushed further away and exhibit a positive relation with distance. The results confirm these general hypotheses at the micro level, even for a nonmetropolitan area. On the one hand, the marginal effects suggest that, for a given point in space, the greater the distances to the main centers are, the greater the probability is of finding establishments active in the Agriculture or Resources & Extractions economic sectors. On the other hand, the shorter the distance to the centers, the higher the probability of finding establishments active in the Construction and KIBS economic sectors. One particular case here relates to Accommodation & Foods establishments. According to the estimation results, the location choice of such establishments is related to their relative position within the subsystem of cities: the greater the distances to the centers, the greater the probability is of finding such establishments.
5.3 RUM, DCM and DBM for Future Empirical Investigations
To summarize, using DBM and DCM based on the RUM framework is an interesting way to test location theories from a micro-spatial perspective. The results provide empirical evidence that spatial sorting takes place at a micro level, even in nonmetropolitan subsystems of cities, such as the LSL region. Despite some particularities, the global patterns predicted by location theories are largely confirmed, with scale economies, distance to large urban centers, co-location (specialization), and the size of nearby establishments being correlated with the establishments’ location choices. But it is also found that some fundamental characteristics described in the literature, such as the role of economic diversity, do not appear to be significantly related to location choice at a micro level, at least for the nonmetropolitan case study at hand. These results provide further evidence of the importance of scale in a business establishment’s location decisions as well as the significance of taking into account spatial continuity and heterogeneity provided at a micro spatial scale.
It would be interesting in further research to compare the regression results from different regions. This would allow the investigation of the possible differences determining location decisions among regions. This would also allow a comparison of location decisions among metropolitan areas. In other words, the approach developed here will allow location decisions to be tested both within and among regions from a micro perspective.
6. CONCLUSION
This paper has explored establishments’ individual location decisions in relation to both the characteristics of their immediate economic environment as well as their relative position to nearby markets. We have addressed this question by assuming that the location choice of individual establishments is related to the quest to maximize profits, which is highly influenced by the rent paid to locate at a given point, which in turn is assumed to be homogenous according to the main economic activity. The latent profit function by economic sector, which is closely related to the rent function and based on the random utility model (RUM), is used as a dependent variable to see whether there is any statistical relation between such a location choice and the economic environment found in the surroundings of a given business establishment. A series of individual local indicators and indices was created using distance-based measures (DBM) from micro geographic scales to characterize establishments’ local environments. Finally, discrete choice models (DCM) were estimated to investigate the possible relation (correlation) between the establishments’ location choice and their direct economic landscape at given distance thresholds.
Previous studies of discrete location choices have relied on aggregated geographic entities (e.g., administrative or economic areas, regions, or municipalities) with the implicit consequence of limiting patterns to choices occurring between regions or municipalities. In contrast, the original micro-spatial approach developed in this paper enables us to study the location decision of establishments from an individual point of view and within a region or a city. The method allows us to directly test the spatial stability of the correlations to account for the possible modifiable areal unit problem (MAUP), while estimating differences in the factors correlated with location decisions within given thresholds to account for the effects of the unique local economic environment of business establishments that are found within and among cities and regions.
Building on location theories, we hypothesized that distances to nearby large urban centers, own-sector co-location, economic diversity, and the size of business establishments would have
© Southern Regional Science Association 2016.
an important and spatially varying impact on firms’ location choices across industries. The empirical investigation of establishments’ discrete location decisions was carried out using micro firm data for Québec’s Lower St. Lawrence (LSL) region, which is an interesting site for analyzing business location decisions in a nonmetropolitan context, as it is a coherent and isolated subsystem of cities and municipalities with sufficient levels of spatial and industrial heterogeneity.
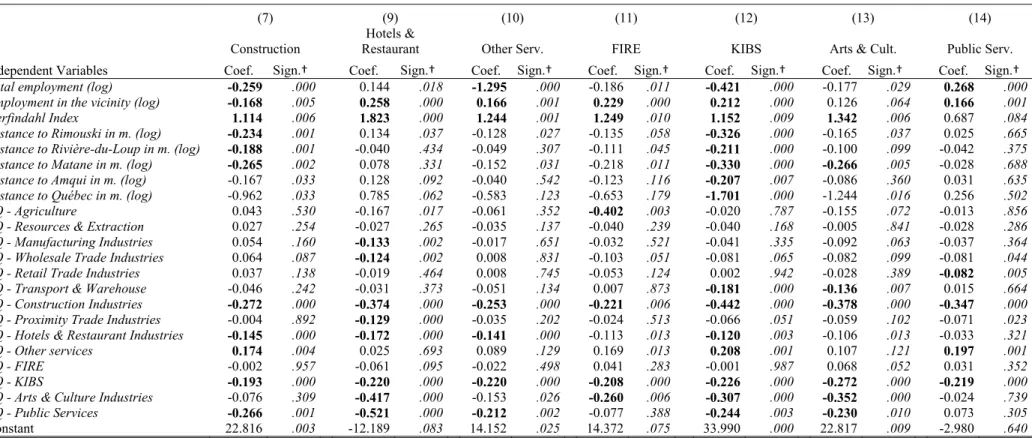
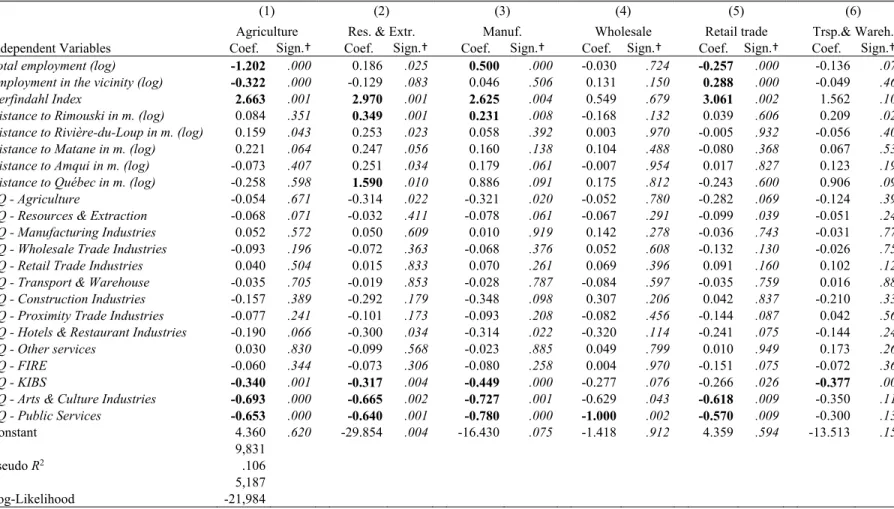
The results presented in this article offer new empirical evidence that a spatial sorting of firms takes place at a micro spatial scale, even in a nonmetropolitan context. The results show that distance to urban centers plays a significant role in the location of service activities, with negative relations found for KIBS and FIRE industries. Own-sector co-location, as measured by location quotients within establishments’ local environments, stands out as a marginal factor, with a strong influence in Resources & Extraction, Wholesale Trade, and Public Services. Economies of agglomeration, as measured by the size of nearby establishments, appear to be an important location sorting factor across service industries, with the strongest effects being measured in the Retail Trade, Accommodation & Foods, FIRE, and KIBS industries.
However, it is also found that the co-location pattern, as expressed by concentration within the same industry, does not appear to be a dominant aspect in the establishments’ location decisions. The most significant effect comes from different factors based on concentration of other economic activities within a given local distance, while the combinations are very different from one establishment to another, depending on their main economic activity. Apart from Agriculture and Manufacturing establishments, no single co-location trend can be drawn for the establishments in the service sectors.
The empirical results also suggest that the role of economic diversity, as measured by the Herfindahl index, does not play a major role at the micro level. This may not come as a surprise since the investigation is conducted as a nonmetropolitan case study, where urbanization economies may be weak or even non-existent.
Without invalidating results found in earlier studies, this provides further evidence of the importance of scale in business location decisions as well as the significance of taking into account spatial continuity and heterogeneity provided at a micro spatial level. The model presented in the paper aims to test whether the land use of individual establishments at a given point is statistically related to the economic characterization of their local environments. It also provides a simple way to verify the robustness of the conclusions in relation to the spatial scale by allowing us to modify the definition of the direct surroundings of the establishments (radius of influence) and identify the specification providing the best performance.
In the end, the variation of the coefficients with the choice of the radius of influence raises important questions for both the study of business location choices and spatial economic theories, such as which scale represents the main decision focus for entrepreneurs and business owners? What are the prime characteristics of this choice at various scales across space? What are the comparable location factors and decisions among regions or cities? Hopefully, these questions can be answered, or at least stimulate further reflection, using spatial micro-data on individual firms. REFERENCES
Acosta, Manuel, Daniel Coronado, Dolores M. León, and Ángeles M. Martínez. (2009) “Production of University Technological Knowledge in European Regions: Evidence from Patent Data,” Regional Studies, 43, 1167–1181.
Alamá-Sabater, Luisa, Andrés Artal-Tur and José Miguel Navarro-Azorín. (2011) “Industrial Location, Spatial Discrete Choice Models and the Need to Account for Neighborhood Effects,” Annals of Regional Science, 47, 393–418.
Albert, José M., Marta R. Casanova, and Vicente Orts. (2012) “Spatial Location Patterns of Spanish Manufacturing Firms,” Papers in Regional Science, 91, 107–136.
Alonso, William. (1964) Location and Land Use: Toward a General Theory. Harvard University Press: Cambridge.
Andersson, Martin, Johan Klaesson, and Johan P. Larsson. (2012) “How Local are Spatial Density Externalities? Evidence from Square Grid Data,” Working Paper 2012/10, Centre for Innovation, Research and Competence in the Learning Economy (CIRCLE), Lund University, available online in March 2016 at
http://wp.circle.lu.se/upload/CIRCLE/workingpapers/201210_Andersson.pdf.
Antonietti, Roberto and Giulio Cainelli. (2011) “The Role of Spatial Agglomeration in a Structural Model of Innovation, Productivity and Export: A Firm-level Analysis,” Annals of Regional
Science, 46, 577–600.
Arrow, Kenneth J. (1962). “The Economic Implications of Learning by Doing,” Review of
Economic Studies, 29, 155–173.
Aruzo-Carod, Josep-Maria and Elisabet Viladecans-Marsal. (2009) “Industrial Location at the Intra-Metropolitan Level: The Role of Agglomeration Economies,” Regional Studies, 43, 545–558.
Barlet, Muriel, Anthony Briant, and Laure Crusson. (2013) “Location Patterns of Service Industries in France: A Distance-based Approach,” Regional Science & Urban Economics, 43, 338–351.
Beaudry, Catherine and Andrea Schiffauerova. (2009) “Who’s Right, Marshall or Jacobs? The Localization versus Urbanization Debate,” Research Policy, 38, 318–337.
Bhat, Chandra R., Rajesh Paleti, and Palvinder Singh. (2014) “A Spatial Multivariate Count Model for Firm Location Decision,” Journal of Regional Science, 54, 462–502.
Briant, Anthony, Combes, Pierre-Philippe, and Miren Lafourcade. (2010) “Dots to Boxes: Do the Size and Shape of Spatial Units Jeopardize Economic Geography Estimations?,” Journal
of Urban Economics, 67, 287–302.
Brunelle, Cédric, Jean Dubé, and Nicolas Devaux. (2013) “L'analyse des Trajectoires Territoriales de Développement: Un Apport Possible des Données Micro Spatiales?,” Canadian Journal
of Regional Science, 36, 87–99.
Capello, Roberta. (2014) “Classical Contributions: von Thünen, Weber, Christaller, Lösch,” in Manfred M. Fischer and Peter Nijkamp (eds), Handbook of Regional Science. Springer: New York, pp. 507–526.
Davis, James C. and Vernon J. Henderson. (2008) “The Agglomeration of Headquarters,”
Regional Science and Urban Economics, 38, 445–460.
De Groot, Henry .L.F., Martin L. Smit, and Jacques Poot. (2009) “Agglomeration Externalities, Innovation and Regional Growth: Theoretical Perspectives and Meta-Analysis,” in Roberta
© Southern Regional Science Association 2016.
Capello and Peter Nijkamp (eds), Handbook of Regional Growth and Development
Theories. Edward Elgar: Cheltenham, U.K., pp. 256–281.
De Vann, Mathijs, Ron Boschma, and Koen Frenken. (2013) “Clustering and Firm Performance in Project-Based Industries: The Case of the Global Video Game Industry, 1972-2007,”
Journal of Economic Geography, 13, 965–991.
Dubé, Jean and Cédric Brunelle. (2014) “Dots to Dots: A General Methodology to Build Local Indicators using Spatial Micro Data,” Annals of Regional Science, 53, 245–272.
Dubé, Jean and Diègo Legros. (2015) “A Spatiotemporal Solution for the Simultaneous Sale Price and Time-on-the-Market Problem,” Real Estate Economics, (Early View) DOI: 10.1111/1540-6229.12121.
_____. (2014) Spatial Econometrics using Microdata. John Wiley and Sons, Inc.: London.
Duranton, Gilles and Henry G. Overman. (2008) “Exploring the Detailed Location Patterns of U.K. Manufacturing Industries using Microgeographic Data,” Journal of Regional Science, 48, 213–243.
_____. (2005) “Testing for Localization using Micro-Geographic Data,” Review of Economic
Studies, 72, 1077–1106.
Ellison, Glen, Edward L. Glaeser, and William R. Kerr. (2010) “What Causes Industry Agglomeration? Evidence from Coagglomeration Patterns,” American Economic Review, 100, 1195–1213.
Fischer, Manfred M., Thomas Scherngell, and Eva Jansenberger. (2009) “Geographic Localisation of Knowledge Spillovers: Evidence from High-Tech Patent Citations in Europe,” Annals
of Regional Science, 43, 839–858.
Fu, Shihe and Junjie Hong. (2011) “Testing Urbanization Economies in Manufacturing Industries: Urban Diversity or Urban Size?,” Journal of Regional Science, 51, 585–603.
Glaeser, Edward L., Hedi Kallal, José A. Scheinkman and Andrei Shleifer. (1992). “Growth in Cities,” Journal of Political Economy, 100, 1126–1152.
Greene, William. H. (2005).Econometric Analysis. Prentice Hall: Upper Saddle River, NJ.
Heebels, Barbara and Ron Boschma. (2011) “Performing in Dutch Book Publishing 1880-2008: The Importance of Entrepreneurial Experience and the Amsterdam Cluster,” Journal of
Economic Geography, 11, 1007–1029.
Ibrahim, Sherwat E., M. Hosein Fallah, and Richard R. Reilly. (2009) “Localized Sources of Knowledge and the Effect of Knowledge Spillovers: An Empirical Study of Inventors in the Telecommunications Industry,” Journal of Economic Geography, 9, 405–431.
Jacobs, Jane. (1969) The Economy of Cities. Random House: New York.
Jofre-Monseny, Jordi, Raquel Marín-López, and Elisabet Viladecans-Marsal. (2014) “The Determinants of Localization and Urbanization Economies: Evidence from the Location of new Firms in Spain,” Journal of Regional Science, 54, 313–337.