Accepted Manuscript
Saturn’s auroral morphology and field-aligned currents during a solar wind compression
S.V. Badman, G. Provan, E.J. Bunce, D.G. Mitchell, H. Melin, S.W.H. Cowley, A. Radioti, W.S. Kurth, W.R. Pryor, J.D. Nichols, S.L. Jinks, T.S. Stallard, R.H. Brown, K.H. Baines, M.K. Dougherty
PII: S0019-1035(14)00642-3
DOI: http://dx.doi.org/10.1016/j.icarus.2014.11.014
Reference: YICAR 11366
To appear in: Icarus
Received Date: 9 June 2014 Revised Date: 24 October 2014 Accepted Date: 7 November 2014
Please cite this article as: Badman, S.V., Provan, G., Bunce, E.J., Mitchell, D.G., Melin, H., Cowley, S.W.H., Radioti, A., Kurth, W.S., Pryor, W.R., Nichols, J.D., Jinks, S.L., Stallard, T.S., Brown, R.H., Baines, K.H., Dougherty, M.K., Saturn’s auroral morphology and field-aligned currents during a solar wind compression, Icarus (2014), doi: http:// dx.doi.org/10.1016/j.icarus.2014.11.014
This is a PDF file of an unedited manuscript that has been accepted for publication. As a service to our customers we are providing this early version of the manuscript. The manuscript will undergo copyediting, typesetting, and review of the resulting proof before it is published in its final form. Please note that during the production process errors may be discovered which could affect the content, and all legal disclaimers that apply to the journal pertain.
Saturn’s auroral morphology and field-aligned currents
1
during a solar wind compression
2
S. V. Badmana, G. Provanb, E. J. Bunceb, D. G. Mitchellc, H. Melinb,d,
3
S. W. H. Cowleyb, A. Radiotie, W. S. Kurthf, W. R. Pryorg, J. D. Nicholsb,
4
S. L. Jinksb, T. S. Stallardb, R. H. Brownh, K. H. Bainesi, M. K. Doughertyj
5
aDepartment of Physics, Lancaster University, Bailrigg, Lancaster, LA1 4YB, UK
6
bDepartment of Physics and Astronomy, University of Leicester, University Road,
7
Leicester, LE1 7RH, UK 8
cJHU APL, 111999 Johns Hopkins Road, Laurel, MD 20723, USA
9
dSpace Environment Technologies, USA
10
eLPAP - Universit´e de Li`ege, Sart Tilman - B5c, 17 All´e du 6 Aout, 4000 - LIEGE,
11
Belgium 12
fDepartment of Physics and Astronomy, University of Iowa, 613 Van Allen Hall, Iowa
13
City, IA 52242-1479, USA 14
gCentral Arizona College, Coolidge, AZ 85128, USA
15
hLPL, University of Arizona, Tucson, AZ 85721, USA
16
iJPL, Pasadena, CA 91109, USA
17
jImperial College London, London, SW7 2AZ, UK
18
Abstract
19
On 21–22 April 2013, during a coordinated auroral observing campaign, in-struments onboard Cassini and the Hubble Space Telescope observed Sat-urn’s aurora while Cassini traversed SatSat-urn’s high latitude auroral field lines. Signatures of upward and downward field-aligned currents were detected in the nightside magnetosphere in the magnetic field and plasma measurements. The location of the upward current corresponded to the bright ultraviolet au-roral arc seen in the auau-roral images, and the downward current region was located poleward of the upward current in an aurorally dark region. Within the polar cap magnetic field and plasma fluctuations were identified with
were observed to rock in latitude in phase with the respective northern and southern planetary period oscillations. A solar wind compression impacted Saturn’s magnetosphere at the start of 22 April 2013, identified by an intensi-fication and extension to lower frequencies of the Saturn kilometric radiation, with the following sequence of effects: (1) intensification of the auroral field-aligned currents; (2) appearance of a localised, intense bulge in the dawnside (04–06 LT) aurora while the midnight sector aurora remained fainter and narrow; (3) latitudinal broadening and poleward contraction of the nightside aurora, where the poleward motion in this sector is opposite to that expected from a model of the auroral oval’s usual oscillation. These observations are interpreted as the response to tail reconnection events, initially involving Vasyliunas-type reconnection of closed mass-loaded magnetotail field lines, and then proceeding onto open lobe field lines, causing the contraction of the polar cap region on the night side.
Keywords: Saturn, magnetosphere, Aurorae
20
1. Introduction
21
Saturn’s auroral intensity and morphology are known to respond strongly
22
to the solar wind conditions that envelop the magnetosphere. The ‘quiet’
au-23
rora is typically composed of a 1–2◦ wide arc, more intense on the dawn side
24
than the dusk, and located at 14–16◦ co-latitude in the southern dayside
25
sector (Grodent et al., 2005; Badman et al., 2006; Lamy et al., 2009;
Car-26
bary, 2012). The northern aurora is typically located 1–2◦ closer to the pole
27
than that in the south because of the higher magnetic field strength in the
northern hemisphere (Dougherty et al., 2005; Nichols et al., 2009). However,
29
the location and width of the aurora are highly variable, and sub-structure
30
of the oval is commonly seen (Badman et al., 2006, 2014b; Grodent et al.,
31
2011; Meredith et al., 2013). Large-scale auroral intensifications have been
32
observed in response to the arrival of solar wind shocks ahead of high
pres-33
sure regions (Prang´e et al., 2004; Clarke et al., 2005, 2009; Crary et al., 2005;
34
Nichols et al., 2014). These intensifications have been interpreted as the
35
signatures of compression-induced magnetotail reconnection (Cowley et al.,
36
2005; Bunce et al., 2005b). Latitudinal broadening of the main auroral
emis-37
sions and smaller-scale features have been related to intensifications of the
38
ring current and to more localised injections in the magnetosphere (Mitchell
39
et al., 2009a; Radioti et al., 2013b; Lamy et al., 2013). Small spot and arc
40
features at and poleward of the main arcs of emission have been identified as
41
the signatures of reconnection in both the dayside and nightside
magneto-42
sphere (G´erard et al., 2005; Radioti et al., 2011, 2013a, 2014; Badman et al.,
43
2012a, 2013; Jackman et al., 2013; Meredith et al., 2013, 2014).
Measure-44
ments of field-aligned currents associated with the main auroral emission by
45
Cassini have shown that the upward current carried by downward auroral
46
electrons is co-located with the polar cap boundary on the day side (Bunce
47
et al., 2008a) and maps to the outer ring current or outer magnetosphere on
48
the night side (Talboys et al., 2011).
49
Many features of Saturn’s magnetosphere demonstrate so-called
‘plane-50
tary period oscillations’ in their intensity and/or location, as reviewed, for
51
example, by Carbary & Mitchell (2013). The planetary period
perturba-52
tions in the magnetic field at high latitudes take the form of planet-centered
transverse rotating dipoles in each hemisphere (Provan et al., 2009). The
54
near-equatorial field perturbations take the form of quasi-uniform rotating
55
fields aligned with the effective dipoles in the equatorial plane, combined with
56
north-south fields, resulting in arched loops (Andrews et al., 2010). The
effec-57
tive dipoles rotate independently in the northern and southern hemispheres
58
with periods close to 10.7 h. Field-aligned currents are associated with these
59
magnetic field perturbations. The currents are directed across the pole at
60
high-latitudes, i.e. field-aligned downward into the ionosphere on one side of
61
the pole, field-aligned upward from the ionosphere on the other side of the
62
pole, and partially closing in the equatorial plane of the outer magnetosphere.
63
The planetary period oscillations are also evident in both the location
64
and intensity of Saturn’s aurora. The centres of the auroral ovals have
65
been observed to oscillate along an ellipse with a latitudinal amplitude of
66
1–2◦ (Nichols et al., 2008, 2010b). Nichols et al. (2010b) suggested that the
67
northern auroral oval would be offset in the direction of the northern
effec-68
tive rotating dipole, and the southern oval offset in the direction opposite to
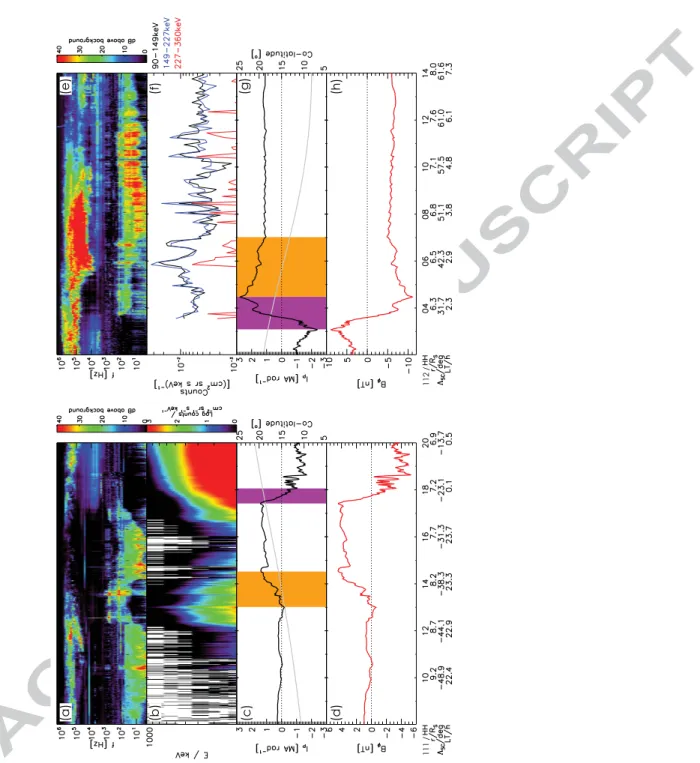
69
the southern effective rotating dipole. However, more recent work has
indi-70
cated that the maximum equatorward displacement of the southern auroral
71
oval occurs 90◦ ahead in azimuth of the southern effective dipole direction,
72
equivalent to 6 h later in LT (G. Hunt and S.W.H. Cowley, personal
commu-73
nication, 2014). Applying this to the northern hemisphere suggests that the
74
northern auroral oval should exhibit its maximum equatorward displacement
75
90◦ behind the northern effective dipole direction, equivalent to 6 h earlier
76
in LT. The northern and southern auroral ovals are then expected to rock
77
around their central positions in phase with the rotation of the northern and
southern effective transverse dipoles. The intensity of the aurora in each
79
hemisphere is also shown to be modulated at the respective period
accord-80
ing to the rotation of the field-aligned currents associated with the effective
81
transverse dipoles, although a local time asymmetry also remains, as
men-82
tioned above (Sandel et al., 1982; Nichols et al., 2010a; Badman et al., 2012b;
83
Lamy et al., 2013; Carbary, 2013).
84
Saturn’s aurora are most commonly observed at ultraviolet and infrared
85
wavelengths, corresponding to emission from H and H2 in the UV and H+3 in
86
the infrared. Badman et al. (2011) and Melin et al. (2011, 2014) have shown
87
that the main auroral arcs are co-located at these wavelengths such that the
88
UV and IR main emissions can be directly compared. However, there are
89
differences at higher and lower latitudes reflecting the different response of
90
these emitting species to auroral electron energy, thermospheric temperature,
91
or emitting species lifetime (Tao et al., 2011; Badman et al., 2014a).
92
It is clear from the discussion above that Saturn’s aurorae respond to
93
both external (solar wind) and internal (planetary rotation) dynamics. In
94
this study the in situ and remote signatures of auroral precipitation are
95
analysed over an interval from the 2013 coordinated observing campaign.
96
This interval included observations of both the northern and southern aurorae
97
and the response to a solar wind compression. These observations provide an
98
opportunity to disentangle the planetary period rocking of the auroral oval
99
from a localised poleward contraction in response to solar wind
compression-100
driven magnetotail dynamics. In the sections below we first describe the field
101
and particle measurements made by Cassini and then show the sequence of
102
auroral observations. These observations are then related to each other,
the rocking of the auroral oval identified, and the effects of the solar wind
104
compression investigated.
105
2. In situ observations of fields and particles by Cassini
106
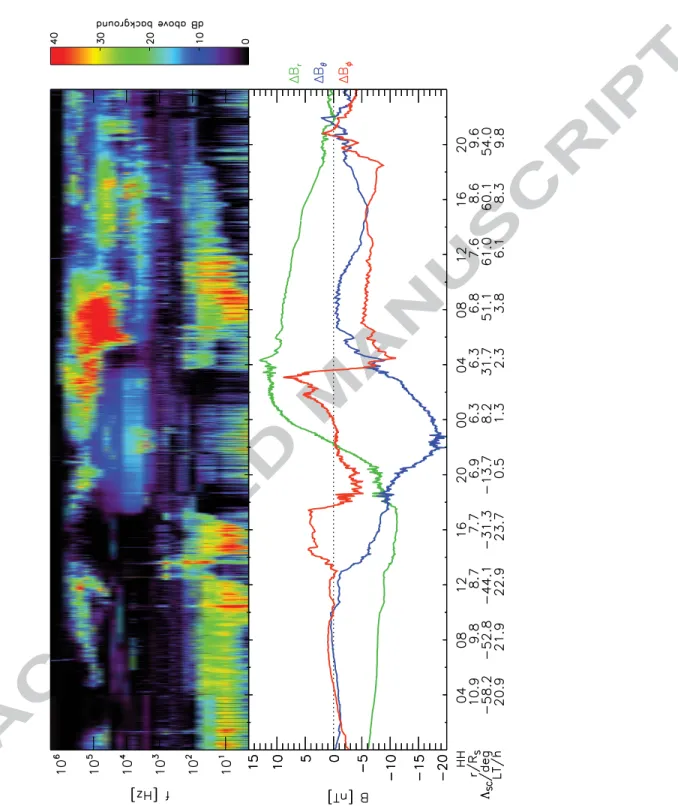
Figure 1 shows the observations made by Cassini on 111 and
2013-107
112, around the periapsis of Rev 187 which occurred at the end of 2013-111.
108
Cassini was moving from the southern pre-midnight sector to the northern
109
post-midnight sector. The upper panel shows the electric field spectrogram
110
detected by the Radio and Plasma Wave Science instrument (RPWS, Gurnett
111
et al., 2004), with Saturn Kilometric Radiation (SKR) evident at 100s of kHz
112
and broadband auroral hiss at up to∼ 100 Hz. The magnetic field measured
113
by the magnetometer (Dougherty et al., 2004) is plotted in spherical polar
114
coordinates referenced to the planet’s dipole axis (which is closely aligned
115
with the spin axis) in the lower panel. The residual field components are
116
plotted after subtraction of a model of the internal planetary magnetic field
117
including dipole, quadrupole and octupole components (Burton et al., 2010).
118
At the start of the interval Cassini was traversing southern lobe field
119
lines, indicated by the quiet magnetic field. The presence of auroral hiss
120
in the electric field spectrogram in the upper panel is also associated with
121
the high latitude magnetic field lines (Gurnett et al., 2010). The equatorial
122
crossing from south to north is identified by the reversal of the Brcomponent
123
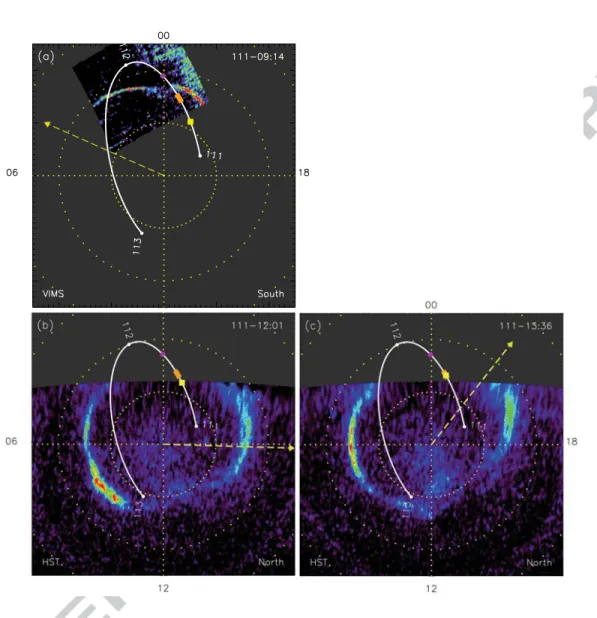
of the field (green) from negative to positive.
124
Sharp changes in the azimuthal Bφcomponent of the magnetic field were
125
also observed. As discussed in several previous studies, localised
perturba-126
tions in Bφ are indicative of field-aligned currents, the upward portion of
which is associated with the auroral emission (Bunce et al., 2008a; Talboys
128
et al., 2009b,a, 2011; Badman et al., 2012a). The Bφ component can be
129
used to derive the meridional ionospheric Pedersen current by application of
130
Amp`ere’s law to a current ring centered on the planet’s dipole axis. This
131 relationship is given by 132 IP =± ρBφ µ0 , (1) 133
where IP is the meridional ionospheric current per radian of azimuth, ρ is
134
the cylindrical radial distance of Cassini from Saturn’s dipole axis and the
135
negative sign applies for the northern hemisphere and positive for the
south-136
ern hemisphere (e.g. Bunce et al., 2008a; Talboys et al., 2011). This analysis
137
also assumes that the structures are stationary relative to the moving
space-138
craft, which is a reasonable assumption in this case as the spacecraft was at
139
small radial distance, 6–9 RS, and moving relatively quickly across the field
140
lines of interest. Assuming approximate axi-symmetry, increases and
de-141
creases in the meridional ionospheric current require downward and upward
142
field-aligned currents to maintain current continuity.
143
The Bφ perturbations and deduced meridional ionospheric current are
144
shown for the intervals when Cassini crossed the southern and northern
145
nightside auroral current regions in Figure 2. Each of these shows a 12 h
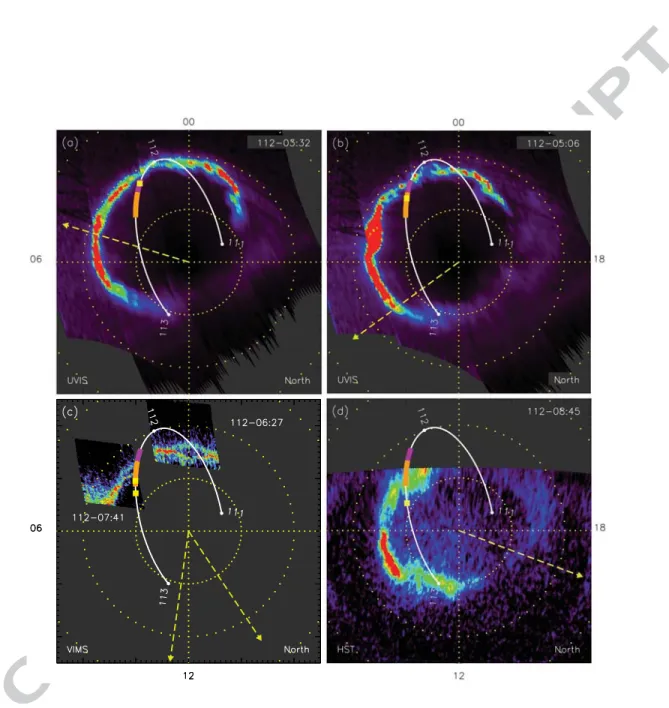
146
sub-interval of that in Figure 1, with the southern encounter on 2013-111
147
(a–d) and the northern encounter on 2013-112 (e–h). Figures 2c and g show
148
the meridional ionospheric Pedersen current, positive equatorward, in black
149
(left hand axis). The ionospheric colatitude of the spacecraft is also shown in
grey (right hand axis) where the mapping to the ionosphere was performed
151
using the Burton et al. (2010) model of the planetary field plus a contribution
152
from the ring current modelled by Bunce et al. (2008b). Figures 2d and h
153
show the Bφ perturbations from which IP was derived.
154
The large scale structure of the field-aligned currents identified during
155
these intervals is as follows: the increase from Bφ∼ 0 to Bφ> 0 at 14 UT on
156
2013-111, as Cassini moved equatorward in the southern hemisphere,
indi-157
cates a field-aligned current directed downward into the southern ionosphere.
158
This was followed by the opposite signature indicating an upward current at
159
18 UT. These downward and upward currents are indicated by the orange
160
and purple shading, respectively, on Figure 2c. The magnitude of the upward
161
current was ∼ 2.3 MA rad−1. In the northern hemisphere on 2013-112 the
162
strong reversal from Bφ > 0 to Bφ < 0 at 03:40 UT, while Cassini travelled
163
poleward, indicates an upward current of magnitude ∼ 5.1 MA rad−1. This
164
is indicated by the purple shading on Figure 2f. The upward current was
165
followed by an overall decrease in the Bφ magnitude until 07 UT, indicative
166
of downward current (orange shading on Figure 2f).
167
The signatures of the field-aligned currents in the plasma and wave
ob-168
servations are now examined. Figure 2a shows two notable spikes in the
169
broadband wave power at 12:30 UT and 13:30 UT on 2013-111, extending to
170
∼ 1 kHz. During these spikes the lower frequency, quasi-continuous emission
171
disappeared, which could be a signature of Cassini passing through the edge
172
of the resonance cone, where it can only detect the higher frequencies (Kopf,
173
2010). The second and more intense of the spikes followed a small, sharp
174
increase in Bφ within the downward current region indicated by the orange
shading on Figure 2c, while the first spike was detected just outside the
down-176
ward current region. The LEMMS sensor also detected an increased flux of
177
electrons at energies of a few tens of keV during this interval from 2013-111
178
12:20–14:10 UT, shown in Figure 2b. These observations suggest narrow or
179
transient enhancements of the downward current structure detected between
180
2013-111 13:00–14:40 UT (orange shading). This is consistent with the
in-181
creased flux of energetic electrons - supposed to be travelling upward to the
182
spacecraft. No similar spikes in the broadband wave power were observed
183
during the upward current encounters indicated by the purple shading on
184
Figures 2c and g at ∼17:30–18:00 UT on 2013-111 and 03:00–04:30 UT on
185
2013-112. The broadband waves (up to ∼ 100 Hz) seen in Figures 2a and e
186
were not detected in the regions equatorward of the upward current in either
187
the northern or southern hemisphere, as shown by Gurnett et al. (2010).
188
During and after the encounter with the upward current region at 03:00–
189
04:30 UT on 2013-112 all components of the magnetic field exhibited repeated
190
small fluctuations until ∼ 12 UT (see the lower panel of Figure 1 and
Fig-191
ure 2h). Two spikes in the broadband waves (up to∼ 100 Hz) were detected
192
by RPWS at ∼ 06 and 07 UT (Figure 2e), similar to those observed at 12:30
193
and 13:30 UT on 2013-111 (shown in Figure 2a). Small fluctuations in Bφ
194
towards lower values also occurred at these times, within the downward
cur-195
rent region indicated by the orange shading on Figure 2g. Figure 2f shows
196
energetic proton fluxes measured by the Ion Neutral Camera (INCA), part
197
of the Magnetospheric Imaging Instrument (MIMI, Krimigis et al., 2004).
198
Peaks in the 90–360 keV proton fluxes were also detected at 06 and 07 UT
199
on 2013-112. These wave and plasma intensifications are commonly seen in
Cassini observations and have been related to strong downward current
re-201
gions, although the cause of the∼ 1 h periodicity is unknown (Mitchell et al.,
202
2009b, 2014; Badman et al., 2012a; Roussos et al., 2014).
203
From approximately 07–12 UT on 2013-112 the field fluctuations were
204
of smaller magnitude (up to 1 nT) and more regular (Figure 2h). During
205
this interval smaller peaks in the proton fluxes (Figure 2f) and broadband
206
wave intensity (Figure 2e) were also present. The period of these smaller
207
fluctuations was approximately 20 min. At this time Cassini was moving
208
sunward across the northern polar cap at high latitudes within the auroral
209
oval.
210
The electric field spectra shown in Figure 1 and 2e show that the SKR
211
intensified and extended to lower frequencies from∼ 5 UT on 2013-112. This
212
is indicative of a solar wind compression of the magnetosphere (Kurth et al.,
213
2005; Badman et al., 2008) and signifies an increased flux of field-aligned,
214
accelerated electrons and an extension of the SKR source region to higher
215
altitudes.
216
3. Auroral observations
217
Three instruments were used to make auroral observations during this
218
interval. Infrared auroral emission from the molecular ion H+3 was detected by
219
the Cassini Visual and Infrared Mapping Spectrometer (VIMS, Brown et al.,
220
2004). VIMS acquires a full wavelength spectrum (0.85–5.1µm) at each pixel
221
position in its field of view (FOV) sequentially, where 1 pixel = 0.5× 0.5 mrad
222
and the maximum FOV is 64 × 64 pixels. The total time required to build
223
up a 2-D pseudo-image was 72 min for the observations used in this study.
The data were projected onto a 0.25◦× 0.25◦ planetocentric polar grid using
225
the peak emission height of 1100 km above the 1 bar reference spheroid
226
(Stallard et al., 2012). The emission intensities used here were determined
227
from multiple wavelength bins containing H+3 emission lines around 3.5 µm.
228
The UV aurorae were observed by the Cassini Ultraviolet Imaging
Spec-229
trometer (UVIS, Esposito et al., 2004) and the Hubble Space Telescope
230
(HST) Advanced Camera for Surveys (ACS). The UVIS observations were
231
acquired by scanning the slit (1.5×64 mrad) across the auroral region,
observ-232
ing the wavelength range 115.5–191.2 nm. Pseudo-images were constructed
233
by combining three slit scans covering different portions of the auroral region
234
using the method described by Grodent et al. (2011). Each pseudo-image
235
composed of three scans took about 80 min to build up. These images were
236
polar projected onto a 0.1◦× 0.1◦ planetocentric polar grid using the peak
237
emission height for H2emission of 1100 km above the 1 bar reference spheroid
238
(G´erard et al., 2009).
239
Turning to the HST observations, the Solar Blind Channel (SBC) of ACS
240
has a FOV of 35 × 31 arcsec2 and an average plate scale of ∼ 0.032
arc-241
sec pixel−1. The image processing pipeline is described in detail by Clarke
242
et al. (2009). The images used in this study were taken using the F115LP
243
long-pass filter which includes emission from H Lyman-α and H2 Lyman and
244
Werner bands in the range 115–170 nm. The exposure time was 15 min for
245
each image. These were also polar projected onto a 0.1◦×0.1◦ planetocentric
246
polar grid using the peak emission height of 1100 km above the 1 bar
refer-247
ence spheroid. Note that as each instrument covers a different wavelength
248
range we do not compare intensities in this study but instead interpret the
shape and location of the emission in each case.
250
The sequence of observations of Saturn’s aurora during this interval is
251
shown in Figures 3 and 4. Figure 3a is a pseudo-image of the southern
252
infrared aurora taken by Cassini VIMS, where the view is looking down
253
through the planet to the southern pole with dawn to the left and dusk to the
254
right. The remaining images are of the northern aurora taken by HST/ACS
255
(3b, 3c, and 4d), UVIS (4a and b) and VIMS (4c), looking down on the
256
northern pole with local noon at the bottom, dawn to the left and dusk to
257
the right. The yellow grid indicates latitudes at 10◦ intervals. The white line
258
indicates the trajectory of Cassini mapped to the appropriate hemisphere
259
using the Burton et al. (2010) model of Saturn’s magnetic field and a model
260
ring current from Bunce et al. (2008b). The white labelled circles indicate the
261
start of days 111–113, and the yellow square indicates the magnetic footprint
262
of Cassini along this path at the central time of the image in each panel (the
263
times labelled in the upper right corner of each panel). The orange and
264
purple shaded portions of the trajectory indicate the regions of downward
265
and upward field aligned current, respectively, identified from the magnetic
266
field data. For the images taken on 2013-111 and shown in Figure 3 these are
267
the southern hemisphere current regions identified on 2013-111 in Figure 2c.
268
For the images taken on 2013-112 and shown in Figure 4 they are the northern
269
hemisphere current regions identified on 2013-112 in Figure 2g. The dashed
270
yellow arrow shows the direction in which the auroral oval is expected to be
271
tilted at that time, where in the southern hemisphere (Figure 3a), this is 90◦
272
ahead in azimuth of the southern effective rotating transverse dipole, and
273
in the northern hemisphere it is 90◦ behind the northern effective rotating
transverse dipole (G. Hunt and S.W.H. Cowley, personal communication,
275
2014). The azimuthal directions of the effective dipoles are taken from the
276
empirical model by Provan et al. (2014).
277
The VIMS observations in Figure 3a at 09:14 UT on 2013-111 show a
278
very narrow auroral arc, < 1◦ latitude wide, with a discontinuity at local
279
midnight. The intense patches at the pre-midnight edge of the instrument
280
field of view are contamination from scattered light and do not represent
281
auroral emission. The discontinuity in the auroral arc was observed to rotate
282
to later LT over the three VIMS images taken on this day (of which the first
283
is shown here) and may be related to a flow discontinuity or superposition of
284
the rotating field-aligned currents. The sequence of VIMS observations and
285
the possible causes of the discontinuity are described in more detail by Melin
286
et al. (2014). A few hours later HST observed the northern UV aurora, shown
287
in Figures 3b and c. Although the midnight region conjugate to that observed
288
in the south by VIMS was not visible because of the viewing geometry, the
289
aurorae at other local times remained narrow, especially around dawn.
290
Figure 4a and b show observations of the northern ultraviolet aurorae
291
made by Cassini UVIS during scans centered on 2013-112 03:32 and 05:06 UT.
292
In the first of these observations the aurorae formed a relatively narrow arc
293
(1–2◦ latitude) of variable intensity extending from pre-midnight through
294
dawn to pre-noon. In the second observation the arc had moved to slightly
295
higher latitude and contained an intense bulge at 04–06 LT extending ∼ 1◦
296
poleward of the centre of the arc.
297
Figure 4c shows two consecutive observations of the northern infrared
298
aurora made by Cassini VIMS, centred on times of 2013-112 06:27 UT and
07:41 UT. The auroral arcs remained narrow and of variable intensity along
300
the midnight region but became relatively wider (∼ 3◦ latitude) and more
301
intense in the pre-dawn region captured in the later image at 2013-112
302
07:41 UT. (The patch of intense emission in the bottom left corner of the
303
FOV at 2013-112 07:41 UT is again non-auroral contamination present at all
304
wavelengths, while the arc identified at higher latitudes is auroral emission.)
305
It is difficult to conclude whether the different auroral forms observed in
306
these two images are caused by spatial or temporal variations. However, the
307
previous UVIS image (Figure 4b) shows a similar morphology of a narrow
308
midnight region and a broader pre-dawn region, such that it seems likely that
309
the variations are spatial rather than just temporal.
310
Finally, Figure 4d shows an HST observation of the northern UV aurora
311
at 2013-112 08:45 UT. The midnight region was not observed because of the
312
viewing angle, but the post-midnight auroral arc was at higher latitude and
313
broader (∼ 4◦ latitude) than in previous observations. The most intense
314
region was post-dawn.
315
4. Correspondence between in situ and auroral observations
316
Comparison of Cassini’s mapped trajectory and the southern auroral
im-317
age shown in Figure 3a with the corresponding electric field spectra and
mag-318
netic field measurements shown in Figure 2a–d shows that the spacecraft was
319
on polar cap field lines poleward of the auroral oval (observed in the infrared)
320
until after 12 UT on 2013-111. The downward current signature was
iden-321
tified in the MAG data at 2013-111 14 UT while Cassini was on field lines
322
mapping to 15◦ co-latitude in the southern ionosphere or ∼ 14◦ co-latitude
in the northern ionosphere. Figure 3c shows an image of the northern
au-324
rora at the start of Cassini’s encounter with the downward current region at
325
13:36 UT on 2013-111. The sub-spacecraft portion of the aurora was not
vis-326
ible at this time, but extrapolation between the pre- and post-midnight arcs
327
of the aurora that were observed suggests that the downward current region
328
was located just poleward of the nightside auroral arc. The upward current
329
was encountered four hours later, when Cassini’s position mapped to 19◦ in
330
the southern hemisphere or 17◦ in the northern hemisphere. This suggests
331
that the auroral current system and main emission had moved a few degrees
332
equatorward in the time between the last auroral image (Figure 3c) and the
333
in situ detection of the upward current, since it is the downward electrons
334
carrying the upward current that are expected to generate the main auroral
335
arc.
336
The next feature of interest is the strong upward field-aligned current
337
detected by Cassini at 2013-112 03:40 UT as it moved to higher latitudes
338
over the northern nightside region. This was detected during the UVIS scan
339
interval used to build image Figure 4a. At this location the field line mapped
340
to ∼ 17◦ co-latitude in the northern hemisphere as indicated on Figure 4a,
341
which is at the poleward edge of the observed auroral arc. The full duration
342
of the encounter with the upward current signature was 03:05–04:25 UT on
343
2013-112, during which time Cassini moved 1.5◦ poleward in the ionosphere.
344
This corresponds to the width of the auroral arc observed by UVIS: ∼ 1◦
345
in this region, combined with the ∼ 1◦ poleward motion of the aurora arc
346
which occurred between the two scans of this region shown in Figures 4a and
347
b, therefore confirming the relationship, previously identified on the night
side by Bunce et al. (2014), between the upward current signature and the
349
aurora.
350
As described in Section 2 above, the subsequent interval from 04–12 UT
351
on 2013-112 was characterised by perturbations in the magnetic field, wave
352
electric field, and proton fluxes and encompasses the region identified as a
353
downward field-aligned current by the orange shading on Figure 2g.
Through-354
out this interval Cassini was poleward of the aurora and moving sunward
355
across the dark northern polar cap towards higher latitudes, as shown in
356
Figures 4b–d. At 12 UT on 2013-112 Cassini reached a location of 06 LT, 9◦
357
colatitude, and 7.6 RS radial distance, from which point the signatures were
358
no longer obvious in the magnetic field data and the measured auroral hiss
359
became less intense. It is yet to be determined whether this decrease in the
360
observed signals is due to rotation of the downward current region associated
361
with the auroral hiss out of the range of detection by the spacecraft, or a
362
change in spacecraft LT, latitude, or altitude. The cause of the periodicity
363
in the downward current region is as yet unknown, and these observations
364
show that, while the previously-known 1 h periodicity is detected for short
365
intervals or restricted spatial regions in the southern and northern polar caps
366
poleward of the upward current at the polar cap boundary, bursts occurring
367
with a shorter period of approximately 20 mins are also detected at higher
368
latitudes. These shorter period bursts were detected for long intervals, across
369
a large spatial region and from a range of spacecraft altitudes. Their origin
370
is being explored in an ongoing study.
5. Oscillation and contraction of the auroral oval
372
The locations of Saturn’s auroral ovals have been observed to oscillate by
373
1–2◦ in latitude in phase with the planetary period magnetic field
pertur-374
bations (Nichols et al., 2008, 2010b). As described in the Introduction, the
375
azimuth along which the centre of the northern oval is expected to be offset
376
lags the azimuth of the northern effective transverse rotating dipole by 90◦,
377
while the azimuth along which the centre of the southern oval is expected to
378
be offset leads the azimuth of the southern effective dipole by 90◦. The
effec-379
tive dipoles rotate at the respective northern and southern rotation periods,
380
such that the auroral ovals rock about their central position over the same
381
periods.
382
The oscillations of the auroral oval are evident in the sequence of two
383
HST images of the northern UV aurorae taken on 2013-111. In Figure 3b
384
and c, the direction in which the oval is expected to be tilted is indicated by
385
the yellow dashed arrow at the central time of each image. These arrows are
386
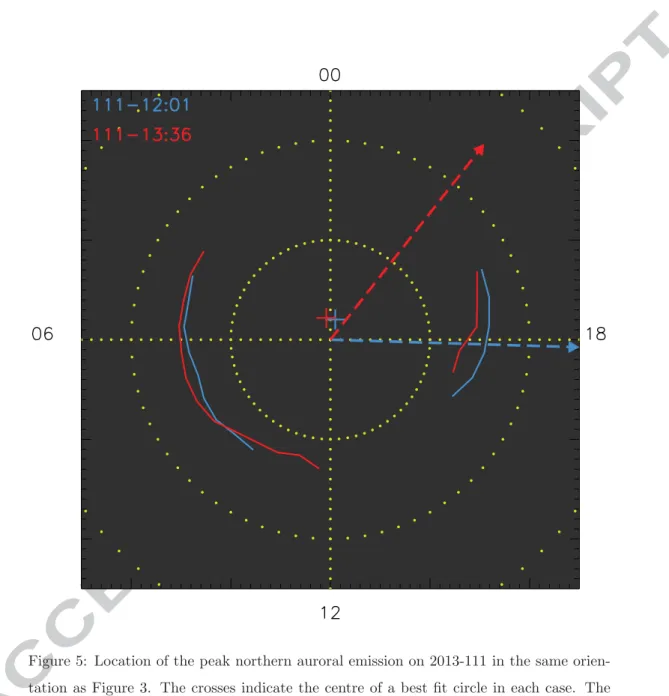
reproduced in Figure 5, colour-coded according to the time of the image, as
387
labelled in the top left corner. The location of the peak auroral emission on
388
each image is also shown by the solid coloured lines. A circle was fitted to
389
these points for each image and the circle centres are marked by the coloured
390
crosses. The difference in azimuth of the northern effective dipole direction
391
between these two images was∼ 50◦ and the expected tilt of the auroral oval
392
and its centre changes from being directed towards 18 LT to about 21:30 LT.
393
The lines showing the location of the peak auroral emission at both dawn and
394
dusk, and the crosses marking the fitted circle centres follow this predicted
395
motion: tilting away from dusk at the time of the second image. The radii
of the fitted circles remained similar at 15.2◦ and 14.8◦ for the two images,
397
confirming that this is a tilting of the oval, not an expansion.
398
The description in Section 4 of the correspondence between the field
399
aligned currents and the auroral emission on 2013-111 also revealed that
400
the upward field-aligned current was detected in the southern hemisphere
401
mapping to a location∼ 1 − 2◦ equatorward of where the southern nightside
402
aurora was observed 4 h earlier (Figure 3a). At the time that the upward
403
current was detected, 18 UT on 2013-111, the southern auroral oval was
ex-404
pected to be tilted towards midnight, such that it would appear at its lowest
405
latitudes in this sector. This is consistent with the detection of the upward
406
current at lower latitudes than where the aurora were observed earlier in
407
the day, and provides further evidence for the regular rocking of both the
408
southern and northern auroral ovals on 2013-111.
409
The same analysis has been applied to the UVIS, VIMS, and HST images
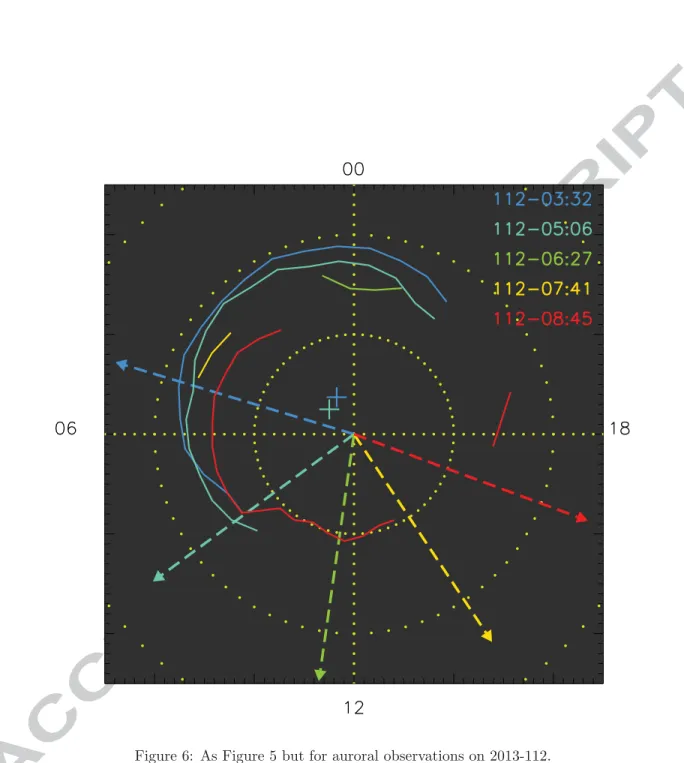
410
acquired on 2013-112 (Figures 4a–d), with results shown in Figure 6, covering
411
approximately half a planetary period oscillation. The northern auroral oval
412
was expected to be tilted towards dawn during the first image, then shift
413
towards noon and finally duskward. The auroral oval was predicted to be
414
most tilted towards noon during the image at 2013-112 06:27 UT (green
415
line) such that the nightside part of the auroral oval should be located at
416
its highest latitudes at this time. The cyan, yellow, and red lines showing
417
the peak intensity of the observed aurorae in the later images were displaced
418
duskward of that in the first image, as expected. The auroral emissions shown
419
in Figures 4c and d cannot be fitted by a circle because of the limited FOV
420
of the VIMS observations, and the poleward broadening of the aurora in the
post midnight region and poleward shift of the pre-noon arc in the final HST
422
image. Therefore fitted circle centres are not shown for these images.
423
At the time of the last image, the northern auroral oval was expected to be
424
displaced duskward and anti-sunward compared to the previous two images
425
(green and yellow lines). The red line on Figure 6 shows that the oval had
426
indeed shifted duskward compared to the earlier images (blue, cyan, yellow
427
lines), however, the region closest to midnight had moved to higher latitudes
428
instead of lower latitudes. Figure 4d shows that this contraction to higher
429
latitudes is due to a combination of poleward broadening and motion of the
430
post-midnight aurora as mentioned above. It is also apparent that the UV
431
aurorae observed at 08:45 UT (Figure 4d) were generally thicker in latitude
432
at most dawnside LT than in previous images. These observations clearly
433
demonstrate that the change in location of the auroral oval during the latter
434
part of the imaging interval was partly caused by a poleward contraction of
435
the nightside aurorae, rather than purely the rocking of the auroral oval.
436
6. Significance of solar wind compression
437
Compression of the magnetosphere by the solar wind was inferred from
438
the intensification and low frequency extension of the SKR emission early on
439
2013-112. The sequence of auroral observations taken on this day suggests
440
that the aurora moved poleward by as much as ∼ 5◦ latitude in the
pre-441
dawn sector, over the 6 h between images Figure 4a and d. Only 1–2◦ of
442
this motion is expected to be related to the regular oscillation of the oval.
443
Furthermore the poleward contraction in the northern post-midnight region
444
between the images at 06:27 and 08:45 UT on 2013-112 is opposite to the
tilting of the auroral oval expected here. These observations therefore reveal
446
a contraction of the auroral oval in this sector. Sections of the dawnside oval
447
were also observed to broaden in latitude and brighten relative to noon and
448
midnight sections, which indicates increased electron precipitation in these
449
regions.
450
In previous studies, solar wind compressions have been linked to broad
451
and intense auroral displays across the dawnside polar region (Prang´e et al.,
452
2004; Clarke et al., 2005; Nichols et al., 2014), and exceptionally high latitude
453
encounters with auroral field-aligned currents (Bunce et al., 2010). Features
454
within and at the equatorward boundary of the main emission have also
455
been related to the injection of plasma and dipolarisation of magnetic field
456
in the magnetotail (Bunce et al., 2005b; Mitchell et al., 2009a; Jackman et al.,
457
2013).
458
In the sequence of observations analysed here, a localised poleward bulge
459
of the auroral emission was first observed in the pre-dawn region after 04:20
460
on 2013-112, and then appeared to move sunward (Figures 4b and c). At this
461
time the midnight arcs remained narrow. This was followed by a poleward
462
broadening of the post-midnight aurora and contraction of the polar cap in
463
this nightside region (Figure 4d). The SKR was intense throughout these
464
observations and a low frequency extension was detected around 06 UT on
465
2013-112 (Figure 2e).
466
The nightside upward and downward field-aligned currents were detected
467
by Cassini in both hemispheres. The different duration of the field-aligned
468
current encounters can be attributed to the relative motion of Cassini and the
469
tilting auroral oval as described by Bunce et al. (2014). The upward current
encounter in the southern hemisphere at ∼ 18 UT on 2013-111 was short as
471
Cassini moved equatorward while this section of the southern auroral oval
472
moved poleward as the oval tilted towards noon (see Figures 2c and 5). The
473
northern hemisphere upward current encounter lasted longer because Cassini
474
was moving poleward while this region of the northern auroral oval was also
475
moving poleward - as the oval again tilted towards noon (see Figures 2g and
476
6).
477
The in situ measurements of the field-aligned currents show that the
478
upward current measured in the northern hemisphere, 5.1 MA rad−1, was
479
more than twice as strong as that in the southern hemisphere on the previous
480
day, 2.3 MA rad−1. On average the nightside field-aligned currents have
481
been shown to be of equal magnitude in both hemispheres (Talboys et al.,
482
2011). Therefore we attribute the strengthening of the current measured in
483
the northern hemisphere on 2013-112 to dynamics associated with the solar
484
wind compression. Specifically, increased field-aligned current and electron
485
precipitation in this region have been predicted and observed as a result of
486
tail reconnection, which sets up a pair of upward and downward field-aligned
487
currents linking the ionosphere with the newly-dipolarised magnetic field in
488
the magnetotail (Cowley et al., 2005; Bunce et al., 2010; Jackman et al.,
489
2013; Nichols et al., 2014).
490
The observations are consistent with an interval of tail reconnection
oc-491
curring for several hours. The bulge in the pre-dawn auroral oval was
ob-492
served during the second UVIS observing interval (Figure 4b), indicating
493
that it appeared after 04:20 UT. As noted above, the magnitude of the
up-494
ward field-aligned current and the SKR emission associated with the upward
current (downward auroral electrons) were enhanced at this time (Figure 2e
496
and g). Jackman et al. (2009) have related the occurrence of enhanced and
497
low frequency SKR to reconnection events occurring in Saturn’s magnetotail.
498
The auroral bulge was observed within the main emission on the dawn
sec-499
tor, a region which maps to the outer ring current or outer magnetosphere
500
(Belenkaya et al., 2014). The bulge is consistent with the injection of hot
501
plasma into the dawnside outer magnetosphere following tail reconnection.
502
However, other causes for the variability in the main oval structure have
503
not been ruled out (Radioti et al., in preparation). Only the trailing edge
504
of the bulge was visible in the next observation of this region at 07:41 UT
505
(Figure 4c).
506
When the next VIMS image of the midnight region was taken, at
2013-507
112 06:27 UT, the location of the peak emission, shown in Figure 6, had
508
shifted slightly poleward, but the image itself (Figure 4c) shows that a second,
509
fainter but more continuous arc was still present at 17◦ co-latitude - the same
510
as in the previous UVIS observation (Figure 4b). It is therefore not clear
511
whether a poleward shift of the emission at midnight occurred between these
512
observations. However, by the time of the final image, the shape of the aurora
513
and the location of the peak emission shown in Figures 4d and 6 strongly
514
suggest a poleward contraction of the oval in the post-midnight region. This
515
is a signature of the closure of open magnetic flux from the magnetotail lobes
516
(Cowley et al., 2005; Badman et al., 2005, 2014b; Nichols et al., 2014).
517
Compression of the magnetosphere by a high pressure region of the solar
518
wind has been postulated to initiate reconnection in Saturn’s magnetotail,
519
as has been observed at the Earth (Boudouridis et al., 2003; Cowley et al.,
2005). In this scenario, reconnection begins on the radially-stretched,
mass-521
loaded, closed field lines which contain the tail current sheet. This leads to
522
the disconnection of a plasmoid and dipolarisation of the planetward
mag-523
netic field lines - the tail part of the Vasyliunas cycle. These two effects
524
(loss of mass via the disconnected plasmoid and planetward contraction of
525
the connected field lines) then allow reconnection to proceed onto lobe field
526
lines, closing open magnetic flux in the lobes as part of the Dungey cycle.
527
The distinction and relationship between these processes has been described
528
theoretically (e.g. Cowley et al., 2005), and detected in simulations (e.g. Jia
529
et al., 2012) and observations (e.g. Jackman et al., 2011; Thomsen, 2013;
530
Nichols et al., 2014).
531
We apply this sequence of events to describe the observations made
dur-532
ing the current interval of study. On 2013-111 the aurorae were narrow,
533
particularly on the night side, and demonstrated the regular planetary
pe-534
riod rocking of the oval location (Figure 3). Early on 2013-112 a compression
535
of the magnetosphere occurred, initially causing reconnection of closed,
mass-536
loaded field lines in the central magnetotail. Plasma was injected into the
537
outer ring current as the newly reconnected field lines contracted towards
538
the planet and enhanced precipitation from this region resulted in
intensi-539
fied SKR (Figure 2e) and a bulge in the pre-dawn auroral oval (Figure 4b),
540
visible at 05 UT. At this time and over the next couple of hours, the
au-541
roral oval near midnight remained narrow (Figure 4c). Reconnection then
542
proceeded onto the open magnetotail lobe field lines, resulting in contraction
543
of newly-closed field lines towards the planet. Field-aligned currents were
544
set up in this region associated with the equatorward flow of the plasma at
the ionospheric footprint of these field lines, across the open-closed field line
546
boundary. At 08:45 UT the auroral signature of this process was detected as
547
the post-midnight auroral arc became relatively more intense, broadened in
548
latitude, and contracted towards the pole (Figure 4d).
549
Finally we note that dayside magnetic reconnection is also expected to
550
be stronger under solar wind compression conditions (Jackman et al., 2004;
551
Badman et al., 2005, 2013), and would occur in the noon sector. A possible
552
auroral signature of dayside reconnection may be identified in the HST image
553
taken at the end of the observing interval (Figure 4d). The intensification
554
and poleward shift of the aurora in this sector are consistent with emission
555
expected in the vicinity of the open-closed field line boundary during
day-556
side reconnection, although it is not certain whether this is a signature of
557
low latitude reconnection resulting in the opening of magnetic flux, or
re-558
connection with lobe field lines which would not change the amount of open
559
flux (Bunce et al., 2005a; G´erard et al., 2005; Meredith et al., 2014). The
560
lack of this feature earlier in the observing sequence illustrates that the tail
561
reconnection and enhanced nightside currents are not triggered by
reconnec-562
tion at the dayside magnetopause, as has been observed in the terrestrial
563
magnetosphere (e.g. Anderson et al., 2014). Instead, tail reconnection can
564
occur independently, although both processes are expected to be enhanced
565
in solar wind compression regions.
566
7. Summary
567
We have examined the in situ and remote observations of Saturn’s aurora
568
in both the northern and southern hemispheres over a two-day interval during
the 2013 coordinated auroral campaign. Signatures of auroral field-aligned
570
currents were identified in the magnetic field. The downward current regions
571
were also identified by characteristic ion and auroral hiss intensifications.
572
On 2013-111 the auroral arcs observed in both hemispheres were narrow
573
and the auroral ovals rocked in latitude in phase with the planetary period
574
oscillations. Early on 2013-112 a solar wind compression arrived, as identified
575
by an intensification and extension to lower frequencies of the SKR. At this
576
time a bulge appeared along the pre-dawn auroral oval, which appeared to
577
have moved sunward when this region was next observed. The midnight
578
sector aurora remained a narrow arc at this time. Subsequently, the
post-579
midnight aurora broadened in latitude and contracted towards the pole. The
580
motion in this sector was in the opposite direction to that expected from the
581
planetary period oscillation.
582
In the interval when the auroral imaging and current measurement were
583
simultaneous in the northern hemisphere, the upward current corresponded
584
to the bright nightside auroral arc and the downward current mapped to
585
the aurorally dark region poleward of this. The upward field-aligned current
586
associated with the northern main oval was more than twice as strong as
587
its southern hemisphere counterpart measured on the previous day (5.1 MA
588
rad−1 compared to 2.3 MA rad−1).
589
These observations are interpreted as the auroral response to tail
recon-590
nection instigated by solar wind compression of the magnetotail. The SKR
591
intensification and auroral bulge are attributed to the injection of plasma
592
into the outer ring current by reconnection on closed, mass-loaded tail field
593
lines. The contraction of the reconnected field lines towards the planet then
allowed reconnection to proceed onto lobe field lines, closing the open flux,
595
and resulting in a contraction of the auroral oval in the post-midnight sector.
596
597
Acknowledgments This work uses observations with the NASA/ESA
Hub-598
ble Space Telescope obtained at the Space Telescope Science Institute (STScI),
599
which is operated by AURA, inc. for NASA. SVB was supported by a Royal
600
Astronomical Society Research Fellowship. EJB, GP, HM, SWHC and TSS
601
were supported by STFC grant ST/K001000/1, and EJB by a Philip
Lever-602
hulme Award. SLJ was supported by an STFC PhD studentship and JDN
603
by an STFC Advanced Fellowship (ST/1004084/1). DGM was supported by
604
the NASA Office of Space Science under Task Order 003 of contract
NAS5-605
97271 between NASA Goddard Space flight Center and the Johns Hopkins
606
University. The research at the University of Iowa was supported by NASA
607
through contract 1415150 with the Jet Propulsion Laboratory.
608
References
609
Anderson, B. J., Korth, H., Waters, C. L., Green, D. L., Merkin, V. G.,
610
Barnes, R. J., & Dyrud, L. P. (2014). Development of large-scale
Birke-611
land currents determined from the Active Magnetosphere and
Plane-612
tary Electrodynamics Response Experiment. Geophys. Res. Lett., 41 .
613
doi:10.1002/2014GL059941.
614
Andrews, D. J., Coates, A. J., Cowley, S. W. H., Dougherty, M. K., Lamy,
615
L., Provan, G., & Zarka, P. (2010). Magnetospheric period oscillations
616
at Saturn: Comparison of equatorial and high-latitude magnetic field
riods with north and south Saturn kilometric radiation periods. J.
Geo-618
phys. Res., 115 , 12252. doi:10.1029/2010JA015666.
619
Badman, S. V., Achilleos, N., Arridge, C. S., Baines, K. H., Brown, R. H.,
620
Bunce, E. J., Coates, A. J., Cowley, S. W. H., Dougherty, M. K., Fujimoto,
621
M., Hospodarsky, G., Kasahara, S., Kimura, T., Melin, H., Mitchell, D. G.,
622
Stallard, T., & Tao, C. (2012a). Cassini observations of ion and electron
623
beams at Saturn and their relationship to infrared auroral arcs. J.
Geo-624
phys. Res., 117 . doi:10.1029/2011JA017222.
625
Badman, S. V., Achilleos, N., Baines, K. H., Brown, R. H., Bunce, E. J.,
626
Dougherty, M. K., Melin, H., Nichols, J. D., & Stallard, T. (2011).
Loca-627
tion of Saturn’s northern infrared aurora determined from Cassini VIMS
628
images. Geophys. Res. Lett., 38 . doi:10.1029/2010GL046193.
629
Badman, S. V., Andrews, D. J., Cowley, S. W. H., Lamy, L., Provan, G.,
630
Tao, C., Kasahara, S., Kimura, T., Fujimoto, M., Melin, H., Stallard,
631
T., Brown, R. H., & Baines, K. H. (2012b). Rotational modulation and
632
local time dependence of Saturn’s infrared H+3 auroral intensity. J.
Geo-633
phys. Res., 117 , A09228.
634
Badman, S. V., Branduardi-Raymont, G., Galand, M., Hess, S. L. G., Krupp,
635
N., Lamy, L., Melin, H., & Tao, C. (2014a). Auroral Processes at the
636
Giant Planets: Energy Deposition, Emission Mechanisms, Morphology and
637
Spectra. Space Sci. Rev., 180 . doi:10.1007/s11214-014-0042-x.
638
Badman, S. V., Bunce, E. J., Clarke, J. T., Cowley, S. W. H., G´erard, J.-C.,
639
Grodent, D., & Milan, S. E. (2005). Open flux estimates in Saturn’s
tosphere during the January 2004 Cassini-HST campaign, and implications
641
for reconnection rates. J. Geophys. Res., 110 . doi:10.1029/2005JA011240.
642
Badman, S. V., Cowley, S. W. H., G´erard, J.-C., & Grodent, D. (2006). A
643
statistical analysis of the location and width of Saturn’s southern auroras.
644
Ann. Geophys., 24 , 3533–3545.
645
Badman, S. V., Cowley, S. W. H., Lamy, L., Cecconi, B., & Zarka, P. (2008).
646
Relationship between solar wind corotating interaction regions and the
647
phasing and intensity of Saturn kilometric radiation bursts. Ann. Geophys.,
648
26 , 3641–3651.
649
Badman, S. V., Jackman, C. M., Nichols, J. D., & G´erard, J.-C.
650
(2014b). Open flux in Saturn’s magnetosphere. Icarus, 231 , 137–145.
651
doi:10.1016/j.icarus.2013.12.004.
652
Badman, S. V., Masters, A., Hasegawa, H., Fujimoto, M., Radioti, A.,
Gro-653
dent, D., Sergis, N., Dougherty, M. K., & Coates, A. J. (2013). Bursty
654
magnetic reconnection at Saturn’s magnetopause. Geophys. Res. Lett., 40 ,
655
1027–1031. doi:10.1002/grl.50199.
656
Belenkaya, E. S., Cowley, S. W. H., Meredith, C. J., Nichols, J. D., Kalegaev,
657
V. V., Alexeev, I. I., Barinov, O. G., Barinova, W. O., & Blokhina, M. S.
658
(2014). Magnetospheric magnetic field modelling for the 2011 and 2012
659
HST Saturn aurora campaigns - implications for auroral source regions.
660
Ann. Geophys., 32 , 689–704.
Boudouridis, A., Zesta, E., Lyons, R., Anderson, P. C., & Lummerzheim, D.
662
(2003). Effect of solar wind pressure pulses on the size and strength of the
663
auroral oval. J. Geophys. Res., 108 , 8012. doi:10.1029/2002JA009373.
664
Brown, R. H., Baines, K. H., Bellucci, G., Bibring, J. P., Buratti, B. J.,
665
Capaccioni, F., Cerroni, P., Clark, R. N., Coradini, A., Cruikshank, D.,
666
Drossart, P., Formisano, V., Jaumann, R., Langevin, Y., Matson, D. L.,
667
McCord, T. B., Mennella, V., Miller, E., Nelson, R. M., Nicholson, P. D.,
668
Sicardy, B., & Sotin, C. (2004). The Cassini Visual and Infrared
Map-669
ping Spectrometer (VIMS) investigation. Space Sci. Rev., 115 , 111–168.
670
doi:10.1007/s11214-004-1453-x.
671
Bunce, E. J., Arridge, C. S., Clarke, J. T., Coates, A. J., Cowley, S. W. H.,
672
Dougherty, M. K., G´erard, J.-C., Grodent, D., Hansen, K. C., Nichols,
673
J. D., Southwood, D. J., & Talboys, D. L. (2008a). Origin of Saturn’s
674
aurora: Simultaneous observations by Cassini and the Hubble Space
Tele-675
scope. J. Geophys. Res., 113 . doi:10.1029/2008JA013257.
676
Bunce, E. J., Arridge, C. S., Cowley, S. W. H., & Dougherty, M. K. (2008b).
677
Magnetic field structure of Saturn’s dayside magnetosphere and its
map-678
ping to the ionosphere: Results from ring current modeling. J.
Geo-679
phys. Res., 113 . doi:10.1029/2007JA012538.
680
Bunce, E. J., Cowley, S. W. H., & Milan, S. E. (2005a). Interplanetary
681
magnetic field control of Saturn’s polar cusp aurora. Ann. Geophys., 23 ,
682
1405–1431. doi:10.5194/angeo-23-1405-2005.
Bunce, E. J., Cowley, S. W. H., Talboys, D. L., Dougherty, M. K., Lamy,
684
L., Kurth, W. S., Schippers, P., Cecconi, B., Zarka, P., Arridge, C. S.,
685
& Coates, A. J. (2010). Extraordinary field-aligned current signatures
686
in Saturn’s high-latitude magnetosphere: Analysis of Cassini data during
687
Revolution 89. J. Geophys. Res., 115 , 10238. doi:10.1029/2010JA015612.
688
Bunce, E. J., Cowley, S. W. H., Wright, D. M., Coates, A. J., Dougherty,
689
M. K., Krupp, N., Kurth, W. S., & Rymer, A. M. (2005b). In situ
observa-690
tions of a solar wind compression-induced hot plasma injection in Saturn’s
691
tail. Geophys. Res. Lett., 322 , L20S04. doi:10.1029/2005GL022888.
692
Bunce, E. J., Grodent, D. C., Jinks, S. L., Andrews, D. J., Badman, S. V.,
693
Cowley, S. W. H., Dougherty, M. K., Kurth, W. S., Mitchell, D. G., Coates,
694
A. J., & Provan, G. (2014). Cassini nightside observations of the oscillatory
695
motion of Saturn’s northern auroral oval. J. Geophys. Res., 119 , 3528–
696
3543. doi:10.1002/2013JA019527.
697
Burton, M. E., Dougherty, M. K., & Russell, C. T. (2010).
Sat-698
urn’s internal planetary magnetic field. Geophys. Res. Lett., 37 .
699
doi:10.1029/2010GL045148.
700
Carbary, J. F. (2012). The morphology of Saturn’s ultraviolet aurora. J.
Geo-701
phys. Res., 117 . doi:10.1029/2012JA017670.
702
Carbary, J. F. (2013). Longitude dependences of Saturn’s ultraviolet aurora.
703
Geophys. Res. Lett., 40 , 1902–1906. doi:10.1002/grl.50430.
704
Carbary, J. F., & Mitchell, D. G. (2013). Periodicities in Saturn’s
magneto-705
sphere. Rev. Geophys., 51 , 1–30. doi:10.1002/rog.20006.
Clarke, J. T., G´erard, J.-C., Grodent, D., Wannawichian, S., Gustin, J.,
707
Connerney, J., Crary, F., Dougherty, M., Kurth, W., Cowley, S. W. H.,
708
Bunce, E. J., Hill, T., & Kim, J. (2005). Morphological differences between
709
Saturn’s ultraviolet aurorae and those of Earth and Jupiter. Nature, 433 ,
710
717–719. doi:10.1038/nature03331.
711
Clarke, J. T., Nichols, J., Gerard, J. C., Grodent, D., Hansen, K. C., Kurth,
712
W., Gladstone, G. R., Duval, J., Wannawichian, S., Bunce, E.,
Cow-713
ley, S. W. H., Crary, F., Dougherty, M., Lamy, L., Mitchell, D., Pryor,
714
W., Retherford, K., Stallard, T., Zieger, B., Zarka, P., & Cecconi, B.
715
(2009). Response of Jupiter’s and Saturn’s auroral activity to the solar
716
wind. J. Geophys. Res., 114 . doi:10.1029/2008JA013694.
717
Cowley, S. W. H., Badman, S. V., Bunce, E. J., Clarke, J. T., G´erard, J.-C.,
718
Grodent, D., Jackman, C. M., Milan, S. E., & Yeoman, T. K. (2005).
Re-719
connection in a rotation-dominated magnetosphere and its relation to
Sat-720
urn’s auroral dynamics. J. Geophys. Res., 110 . doi:10.1029/2004JA010796.
721
Crary, F., Clarke, J., Dougherty, M., Hanlon, P., Hansen, K., Steinberg, J.,
722
Barraclough, B., Coates, A., Gerard, J., Grodent, D., Kurth, W., Mitchell,
723
D., Rymer, A., & Young, D. (2005). Solar wind dynamic pressure and
724
electric field as the main factors controlling Saturn’s aurorae. Nature,
725
433 , 720–722. doi:DOI 10.1038/nature03333.
726
Dougherty, M. K., Achilleos, N., Andr´e, N., Arridge, C. S., Balogh, A.,
727
Bertucci, C., Burton, M. E., Cowley, S. W. H., Erdos, G., Giampieri, G.,
728
Glassmeier, K. H., Khurana, K. K., Leisner, J., Neubauer, F. M., Russell,
729
C. T., Smith, E. J., Southwood, D. J., & Tsurutani, B. T. (2005). Cassini
magnetometer observations during Saturn orbit insertion. Science, 307 ,
731
1266–1270. doi:10.1126/science.1106098.
732
Dougherty, M. K., Kellock, S., Southwood, D. J., Balogh, A., Smith, E. J.,
733
Tsurutani, B. T., Gerlach, B., Glassmeier, K.-H., Gleim, F., Russell,
734
C. T., Erdos, G., Neubauer, F. M., & Cowley, S. W. H. (2004). The
735
Cassini Magnetic Field Investigation. Space Sci. Rev., 114 , 331–383.
736
doi:10.1007/s11214-004-1432-2.
737
Esposito, L. W., Barth, C. A., Colwell, J. E., Lawrence, G. M., McClintock,
738
W. E., Stewart, A. I. F., Keller, H. U., Korth, A., Lauche, H., Festou,
739
M. C., Lane, A. L., Hansen, C. J., Maki, J. N., West, R. A., Jahn, H.,
740
Reulke, R., Warlich, K., Shemansky, D. E., & Yung, Y. L. (2004). The
741
Cassini Ultraviolet Imaging Spectrograph Investigation. Space Sci. Rev.,
742
115 , 299–361. doi:10.1007/s11214-004-1455-8.
743
G´erard, J.-C., Bonfond, B., Gustin, J., Grodent, D., Clarke, J. T., Bisikalo,
744
D., & Shematovich, V. (2009). Altitude of Saturn’s aurora and its
im-745
plications for the characteristic energy of precipitated electrons.
Geo-746
phys. Res. Lett., 36 . doi:10.1029/2008GL036554.
747
G´erard, J.-C., Bunce, E. J., Grodent, D., Cowley, S. W. H., Clarke, J. T.,
748
& Badman, S. V. (2005). Signature of Saturn’s auroral cusp:
Simultane-749
ous Hubble Space Telescope FUV observations and upstream solar wind
750
monitoring. J. Geophys. Res., 110 . doi:10.1029/2005JA011094.
751
Grodent, D., G´erard, J.-C., Cowley, S. W. H., Bunce, E. J., & Clarke,
J. T. (2005). Variable morphology of Saturn’s southern ultraviolet aurora.
753
J. Geophys. Res., 110 . doi:10.1029/2004JA010983.
754
Grodent, D., Gustin, J., G´erard, J.-C., Radioti, A., Bonfond, B., & Pryor,
755
W. R. (2011). Small-scale structures in Saturn’s ultraviolet aurora. J.
Geo-756
phys. Res., 116 . doi:10.1029/2011JA016818.
757
Gurnett, D. A., Kurth, W. S., Kirchner, D. L., Hospodarsky, G. B.,
758
Averkamp, T. F., Zarka, P., Lecacheux, A., Manning, R., Roux, A., Canu,
759
P., Cornilleau-Wehrlin, N., Galopeau, P., Meyer, A., Bostr¨om, R.,
Gustafs-760
son, G., Wahlund, J.-E., ˚Ahlen, L., Rucker, H. O., Ladreiter, H. P.,
761
Macher, W., Woolliscroft, L. J. C., Alleyne, H., Kaiser, M. L., Desch,
762
M. D., Farrell, W. M., Harvey, C. C., Louarn, P., Kellogg, P. J., Goetz,
763
K., & Pedersen, A. (2004). The Cassini Radio and Plasma Wave
Investi-764
gation. Space Sci. Rev., 114 , 395–463. doi:10.1007/s11214-004-1434-0.
765
Gurnett, D. A., Persoon, A. M., Kopf, A. J., Kurth, W. S., Morooka, M. W.,
766
Wahlund, J.-E., Khurana, K. K., Dougherty, M. K., Mitchell, D. G.,
Krim-767
igis, S. M., & Krupp, N. (2010). A plasmapause-like density boundary at
768
high latitudes in Saturn’s magnetosphere. Geophys. Res. Lett., 37 , 16806.
769
doi:10.1029/2010GL044466.
770
Jackman, C. M., Achilleos, N., Bunce, E. J., Cowley, S. W. H., Dougherty,
771
M. K., Jones, G. H., Milan, S. E., & Smith, E. J. (2004). Interplanetary
772
magnetic field at ∼9 AU during the declining phase of the solar cycle and
773
its implications for Saturn’s magnetospheric dynamics. J. Geophys. Res.,
774
109 . doi:10.1029/2004JA010614.
Jackman, C. M., Achilleos, N., Cowley, S. W. H., Bunce, E. J., Radioti, A.,
776
Grodent, D., Badman, S. V., Dougherty, M. K., & Pryor, W. (2013).
Au-777
roral counterpart of magnetic field dipolarizations in Saturn’s tail. Planet.
778
Space. Sci., 82 , 34–42.
779
Jackman, C. M., Lamy, L., Freeman, M. P., Zarka, P., Cecconi, B., Kurth,
780
W. S., Cowley, S. W. H., & Dougherty, M. K. (2009). On the
char-781
acter and distribution of lower-frequency radio emissions at Saturn and
782
their relationship to substorm-like events. J. Geophys. Res., 114 , 8211.
783
doi:10.1029/2008JA013997.
784
Jackman, C. M., Slavin, J. A., & Cowley, S. W. H. (2011). Cassini
obser-785
vations of plasmoid structure and dynamics: Implications for the role of
786
magnetic reconnection in magnetospheric circulation at Saturn. J.
Geo-787
phys. Res., 116 . doi:10.1029/2011JA016682.
788
Jia, X., Hansen, K. C., Gombosi, T. I., Kivelson, M. G., T´oth, G., DeZeeuw,
789
D. L., & Ridley, A. J. (2012). Magnetospheric configuration and dynamics
790
of Saturn’s magnetosphere: A global MHD simulation. J. Geophys. Res.,
791
117 . doi:10.1029/2012JA017575.
792
Kopf, A. J. (2010). A multi-instrument study of auroral hiss at Saturn. Ph.D.
793
thesis University of Iowa.
794
Krimigis, S. M., Mitchell, D. G., Hamilton, D. C., Livi, S., Dandouras, J.,
795
Jaskulek, S., Armstrong, T. P., Boldt, J. D., Cheng, A. F., Gloeckler, G.,
796
Hayes, J. R., Hsieh, K. C., Ip, W.-H., Keath, E. P., Kirsch, E., Krupp, N.,
797
Lanzerotti, L. J., Lundgren, R., Mauk, B. H., McEntire, R. W., Roelof,