Energies 2020, 13, 5357; doi:10.3390/en13205357 www.mdpi.com/journal/energies Article
Climate Change Effects on Belgian Households:
A Case Study of a Nearly Zero Energy Building
Shady Attia * and Camille GobinSustainable Building Design Lab, Department UEE, Faculty of Applied Sciences, Université de Liège, 4000 Liège, Belgium; [email protected]
* Correspondence: [email protected]
Received: 19 September 2020; Accepted: 12 October 2020; Published: 14 October 2020
Abstract: Overheating in residential building is a challenging problem that causes thermal discomfort, productivity reduction, and health problems. This paper aims to assess the climate change impact on thermal comfort in a Belgian reference case. The case study represents a nearly zero energy building that operates without active cooling during summer. The study quantifies the impact of climate change on overheating risks using three representative concentration pathway (RCP) trajectories for greenhouse gas concentration adopted by the Intergovernmental Panel on Climate Change (IPCC). Building performance analysis is carried out using a multizone dynamic simulation program EnergyPlus. The results show that bioclimatic and thermal adaptation strategies, including adaptive thermal comfort models, cannot suppress the effect of global warming. By 2050, zero energy buildings will be vulnerable to overheating.
Keywords: future weather files; climate scenarios; thermal comfort; overheating; building simulation; global warming
1. Introduction
Characterizing future trends in climate and their uncertainty is crucial to understanding how climate change will influence people’s well-being in dwellings. The frequency of extreme weather events’ intensity is critical information to assess and develop mitigation strategies facing climate change. The characterization of trends and uncertainty in climate extremes is missing in many existing publications [1,2]. Moreover, the frequency and intensity of heatwaves during summers have an increasing impact on society [3]. The projected rise in temperatures will make dwellings more uncomfortable to live in and potentially will not allow working from home. The poorly ventilated and overheated sleeping and living rooms can become dangerous to occupants’ health and their thermal comfort, in particular older people. With newly and well-insulated buildings, there is a high risk of overheating [4,5] when exposed to large amounts of solar radiation and internal heat gains.
In nearly Zero Energy Buildings (nZEB) and Net Zero Energy Buildings (NZEB), we expect that overheating increases because of climate change. Therefore, it is essential to estimate the thermal comfort and overheating risks in high-performance buildings. Several studies investigated the impact of climate change on the building stock’s cooling energy demand [6–8]. However, a very few studies investigated the overheating implications for high-performance buildings. Therefore, this paper aims to quantify the impact of climate change on overheating hours according to static and adaptive comfort models. The methodology is applied to a Belgian residential reference building using future climate change weather files for the years 2050 and 2100. Research focusing on future climate scenarios using building performance simulations in the Belgian context is rare [9]. At the same time, Belgium faces a remarkable increase in both extreme temperatures and air conditioning and refrigeration systems sales (see Figure 1) [10,11]. For example, 2018 was an unusually warm year: the
average annual temperature was, according to the Royal Meteorological Institute of Belgium (RMI), 11.85 °C (against 10.5 °C standard), almost equaling the record of 2014 (11.93 °C). The year 2018 was the second warmest year since measurements started in Uccle (Brussels) in 1833, followed by 2011 and 2007, with annual averages of 11.6 and 11.5 °C, respectively.
Figure 1. Evolution of the average temperature in Belgium (compared to normal 1961–1990) for the
period 1951–2100 (adapted from RMI) [11].
2. Future Weather Data for Building Performance Simulation
Research about future weather data for building energy modeling is typically based on mathematical models named “General Circulation Models” (GCMs) [12]. GCMs represent physical phenomena in the atmosphere and land surface [12]. They are used for simulating the global climate system response to the increasing greenhouse gas concentrations [13]. GCMs provide climate information on a worldwide scale with a typical spatial resolution of 150–600 km. However, GCMs have bias concerning absolute meteorological values for a given year [14] and are much more skillful at predicting a temporal delta between meteorological values [15]. Therefore, they need to be nested with regional models to provide consistent approximations of regional climate change. GCMs can be downscaled to regional climate models (RCMs) to obtain climate information at a resolution of 10– 100 km. International frameworks such as CORDEX (Coordinated Regional Climate Downscaling Experiments) evaluate RCM performances and aim at producing regional climate projections over various regions of the world such as Europe (EURO-CORDEX) [16]. For the dynamic downscaling, physics-based models are used to downscale global climate model results [17].
Therefore, this article uses the RCMs for climate change scenarios developed at the Laboratory of Climatology and Topoclimatology of the University of Liège [18]. The RCM MAR (for “Modèle
Atmosphérique Régional” in French) characterizes the current and future evolution of hydroclimatic
conditions and also global radiation. For this purpose, historical simulations were performed over 1958–2016. Future projections (2020–2100) were then achieved under different IPCC future scenarios. The covered period ranges from 1976 to 2050 and 2100 (from 1976 to 2005 with the historical scenario + 2020 to 2100 with Representative Concentration Pathway (RCPs) of RCP2.6, RCP4.5, RCP6, and RCP8.5 scenarios. The RCPs are greenhouse gas concentration trajectories adopted by the IPCC [16]. The horizontal resolution used for both historical and future simulations is 5 km.
3. Materials and Methods
The analysis presented in this paper builds on the study [19,20] that investigated the energy performance of a single-family freestanding house in East Belgium [19,20]. For the study, an integrated modeling approach was developed to analyze the building energy use and thermal
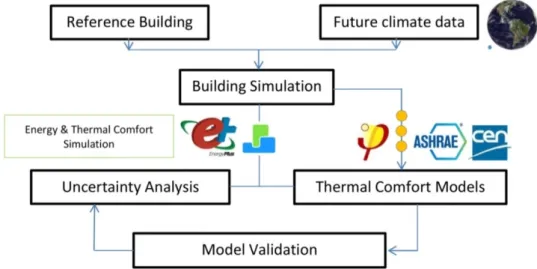
comfort conditions, including overheating hours, in a naturally ventilated nearly zero energy building. Figure 2 illustrates the used methodology and the conceptual study framework.
3.1. Future Weather Data
The overheating risks of residential buildings are assessed under different climate scenarios. Four climate scenarios are selected to represent historical data (i) 1959–2014 global-warming observations and (ii) for 2006–2100 under diverse Representative Concentration Pathways (RCP) scenarios. The resolution used for both historical and future simulations is 5 km. The regional climate model MAR outputs, developed by Belgian climatologists, are compared with ground-based measurements from 20 Belgian weather stations over 2008–2014 [21]. For this study, we use three different RCP scenarios that have been assessed in IPCC (2014) [22]:
• RCP 4.5: Strategies for reducing greenhouse gas emissions cause radiative forcing to stabilize at 4.5 W/m2 before the year 2100.
• RCP 6: emissions peak and radiative forcing will reach 6 W/m2 around 2080 and then decline.
• RCP 8.5: Increased greenhouse gas emissions mean that radiative forcing will reach 8.5 W/m2 by
the year 2100.
The results show that MAR allows downscaling of the spatial and temporal variability of the Belgian climate with a low range of error [23]. The biases found in the MAR results are non-significant, and the correlation coefficients are satisfying concerning temperature, humidity, wind speed, global radiation, and cloudiness. Weather data were extracted for Liege Bierset, located at 50.6412° N, 5.4479° E, and 201 m above sea level). The climate file of Liege Bierset represents the closest weather station to our case study in Kettenis, Belgium. Our case study is located 45 km east of Liege Bierset weather station. The weather in Kettenis, Belgium, is known as a temperate oceanic climate based on the climatic classification of Köppen-Geiger [24].
Figure 2. Conceptual study framework.
3.2. Case Study
The case study is a freestanding single-family house constructed in 2008 in Belgium [19]. The house participated as an exemplary project under the “Construire avec energie” project to stimulate the design and construction of high-performance buildings. The building was chosen as a special project by the regional government of Wallonia. Besides, the project is an example of sustainable construction advocating for energy neutrality and low embodied carbon. The project is well documented, and its performance is monitored. Moreover, the building complies with the Belgian Passive House standard requirements [25] and has photovoltaic units mounted on the roof, which qualifies it as a nearly zero energy building. The building is located in Kettenis (Belgium) and is designed by the architect Léo Michaelis (50.6473° N, 6.0469° E) [26,27]. To obtain the Passive House label, the external wall
conductivity (u-value) is 0.132 W/m2K with 30 cm insulation and net energy requirements for the
heating below 150 MJ/m2/year. The triple glazing has a u-value of 0.5 W/m2K. The triple glazing is
composed of three panes of 4 mm separated from each other by 12 mm of a mixture of Argon-Krypton. The measured total energy use is 25 kWh/m2/year. The airtightness has been verified
through an airtightness test and is 0.5 (n50) at 50 Pa. The house is a timber construction with a timber truss frame. Its wider geometrical side is oriented perpendicular to the North-South axis, as shown in Figure 2. The roof is gabled with a 35° slope and rises on two floors with the daily activities areas (kitchen, living room, and dining room) on the ground floor and night activities (bedrooms and bathroom) are located upstairs (see Figure 2). A nonheated garage is annexed to the house.
A detailed energy audit and building characterization took place by De Meester de Betzenbroeck [19]. Windows have internal solar protection. The house occupies an area of 174 m2 for a heated
volume of 536 m3. The house is highly insulated, i.e., is heated by a pellet heating system. Domestic
hot water is produced by a gas water heater, assisted by preheating by solar collectors (6 m2). This
house is equipped with a double-flow mechanical ventilation system (System D) with a heat recovery unit (90%). Further details on the building energy efficiency characteristics can be found in the study of De Meester de Betzenbroeck (2008) [19].
3.3. Building Energy Modeling and Calibration
The building energy model was constructed in DesignBuilder (v6.1.5.002) [28]. The simulation took place in the dynamic energy simulation program EnergyPlus v9.0. The multizone model included the ground and first floor as heating space. The garage and the atrium were modeled as nonheated spaces (see Figures 3 and 4). We synthesized several scenarios to represent future weather conditions in the sleeping room and living room, each containing a time series of 8760-time steps. The schedules for occupancy, lighting, and equipment in the sleeping and living rooms are modeled based on the audit of De Meester de Betzenbroeck [19]. The number of household occupants is four people. Mechanical ventilation has a minimum flow rate of 110 m3/h. The air changes correspond to
approximately 30 m3/h/person. This flow rate depends on the function of the room and its surface.
Windows are open at night if the indoor temperature is higher than 22 °C, allowing for ventilative cooling. The operative temperature is used to control the ideal air loads system. Active heating is assumed all year long. The heating setpoint is set at 21 °C during occupancy and 16 °C for other moments. The summer comfort conditions are explained in the following section. The calibration of the building simulation model is described in the results section.
Figure 3. Freestanding single-family house, in Kettenis, Belgium (architect: Leo Michaelis) [19,26,27].
3.4. Thermal Comfort Modeling
Thermal comfort temperature boundaries reflect within which temperature range the indoor environment is assumed to be comfortable for occupants [29]. In this study, several thermal comfort models were tested, similar to the study of Attia et al. (2015) [30]. We used the Passive House Standard static comfort model to set reference conditions. Then, we tested the building against ISO 17772, EN 15251, and ASHRAE 55. To calculate the optimal comfort condition according to the Fanger comfort model, we assume that the dry-bulb air temperature is equal to the mean radiant temperature (hence equal to the operative temperature), indoor air relative humidity is equal to 50%, air velocity
amounts to 0.1 m/s, metabolic activity is 1.3 met (normally sedentary activities), and clothing resistance is 0.4 clo in summer and 1.0 clo in winter.
Figure 4. Multizone building energy model in DesignBuilder [20]. 4. Results
4.1. Climate Change Impact on Thermal Comfort
The results of the building performance simulation are presented in Figure 5 and Figure 6. Figure 5 illustrates the effects of climate change on overheating hours under the static comfort conditions of the Passive House Standard. Under the current (reference/TDY) climate conditions, the operative temperature in the sleeping room (355 h) and living room (399 h) remain under the acceptable 5% (of all (8760) hours) range mandated by the Passive House standard (max. 438 h). In 2050, the number of hours with the indoor operative temperature that exceeds 25 °C increases up to 474 h (5.4%), 697 h (7.9%), and 1102 h (12.5%) under the RCP 4.5, RCP 6, and RCP 8.5, respectively. In 2050, the worst thermal comfort scenario is found in living rooms, where overheating hours can reach 1195 h (13.6%) under RCP 8.5.
Figure 5 illustrates the impact of climate change on overheating hours under static comfort in 2100. In 2100, the number of hours with the indoor operative temperature that exceeds 25 °C increases up to 790 h (9%), 1268 h (14.4%), and 1598 h (18.2%) under the RCP 4.5, RCP 6, and RCP 8.5, respectively. In 2100, the worst thermal comfort scenario is found in living rooms, where overheating hours can reach 1732 h (19.7%) under RCP 8.5.
Figure 6 illustrates the impact of climate change on overheating hours under the adaptive comfort conditions of EN 15,251 Standard. Under the current (reference/TDY) climate conditions, the operative temperature in the sleeping room (285 h) and living room (355 h) remain under the acceptable 5% (of all (8760) hours) range. In 2050, the number of hours with the indoor operative temperature that exceeds the upper comfort threshold reaches 400 h (4.5%), 610 h (6.9%), and 950 h (9.7%) under the RCP 4.5, RCP 6, and RCP 8.5, respectively. In 2050, the worst thermal comfort scenario is found in living rooms, where overheating hours can reach 1028 h (11.7%) under RCP 8.5.
Figure 5. Results of climate and building thermal performance modeling under the Passive House
comfort model.
Figure 6 illustrates the impact of climate change on overheating hours under adaptive comfort in 2100. In 2100, the number of hours with the indoor operative temperature that exceeds the upper comfort thresholds reaches 675 h (7.7%), 1120 h (12.7%), and 1395 h (15.9%) under the RCP 4.5, RCP 6, and RCP 8.5, respectively. In 2100, the worst thermal comfort scenario is found in living rooms, where overheating hours can reach 1489 h (16.9%) under RCP 8.5.
Figure 6. Results of climate and building thermal performance modeling under the European
adaptive comfort model.
4.2. Future Scenarios against Different Comfort Models
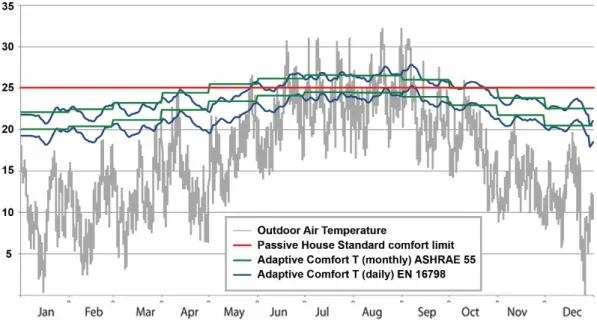
The findings presented in Figure 5 and Figure 6 indicate that the RCP 8.5 scenario has the worst impact of thermal comfort in sleeping and living rooms. To put those findings under more profound scrutiny, Figure 7 compares the future weather file of 2050 under the RCP 8.5 scenario against three comfort models, namely, the European adaptive comfort model as stated in EN 15251-2:2018, American adaptive comfort model as reported in ASHRAE 55, and the Passive House comfort model, using the climate data of Liege. Figure 7 confirms that the adaptive comfort model EN 15251 will stretch the comfort zone compared to the Passive House Standard and will absorb most overheating hours due to climate change. However, the figure presents a frequent presence of heatwaves with
higher outdoor temperatures intensity and longer duration. Based on Figure 7, we identified more than six heatwaves during the summer season.
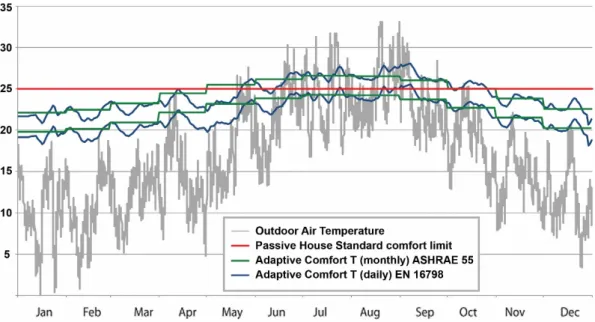
Further, Figure 8 compares the future weather file of 2100 under the RCP 8.5 scenario against the four comfort models using Liege’s climate data. Figure 8 shows that the adaptive comfort model EN 15,251 will fail to absorb most overheating hours. By 2100, the overheating hours will be significantly high. Based on Figure 8, we identified more than 10 heatwaves during the summer season.
4.3. Models Validation
The validation procedure involved the weather model validation and the building model validation. For the weather files, four types of parameters, with significant volatility and no standard distribution, are selected as uncertain parameters, i.e., temperature, relative humidity, wind speed, and global solar radiation. A simple probability distribution calculation of these parameters is performed. The Kumaraswamy distribution was used, which is considered a fast simulation of random variables from the distribution to reduce computational time and reduce computational time [31,32]. The hourly and summer seasonal variations were only modeled for the 2050 and 2010 RCP 8.5 scenarios of Liege, Belgium. In Figure 5, the aggregated range of uncertainty of the estimated annual overheating hours, by 2050 due to weather variations, ranges from −6.0% to +22.7%. Moreover, the aggregated range of uncertainty by 2100 ranges from −16.8.0% to +37.7%. Under the adaptive comfort model (see Figure 6), the aggregated range of uncertainty of the estimated annual overheating hours, by 2050 due to weather variations, ranges from −7.3% to +26.8%. Moreover, the aggregated range of uncertainty by 2100 ranges from −18.9.0% to +43.5%.
Figure 7. The comparison of four models concerning the outdoor operative temperature of Liege, in
Figure 8. Comparison of three comfort models concerning the outdoor air temperature of Liege, in
2100, under RCP 8.5 scenario.
The building simulation model monthly energy use consumption and the hourly indoor air temperature were calibrated against measured data (2015–2018) to verify the models’ accuracy. The calibration included several iterations and is based on the ASHRAE Standard 140-2017 [33,34]. The calibration was based on calculating the normalized mean bias error (NMBE) and the coefficient of variation of root square mean error (CV (RMSE)) between the observed and simulation building performance, see Equations (1) and (2).
NMBE (normalized mean bias error)
𝑁𝑀𝐵𝐸 =∑ 𝑀𝑖 − 𝑆𝑖
∑ 𝑀𝑖 % . (1)
CV (RMSE) (coefficient of variation of root square mean error)
𝐶𝑉 𝑅𝑀𝑆𝐸 =1 𝑀
∑ 𝑀𝑖 − 𝑆𝑖
𝑁𝑝 . (%) (2)
In Equations (1) and (2), Np is the total number of data values, Mi (where i = 1, 2 … Np) represents the mean measured data, and Si (where i = 1, 2 … Np) represents the mean simulated data. The simulated model is considered calibrated because NMBE is not larger than 10% and CV (RMSE) is not larger than 30%, based on the hourly data (air temperature). Further details on the calibration outcomes can be found in the work of Gobin [20].
5. Discussion
Climate change will increase the overheating hours in freestanding houses significantly. The challenge of defining a relevant climate data source, including climate change and heatwaves, clearly is crucial. Without adaptive thermal comfort models to estimate overheating, existing, nearly zero energy buildings will suffer from low comfort. The use of adaptive thermal comfort models to evaluate and quantify overheating hours might be helpful and objective. By 2050 and under the most optimistic climate change scenario, nZEB will be hot during summers. External solar protection, ventilative cooling, and thermal mass are essential to avoid solar heat gains and dissipate the internal heat. The intensive use of mechanical ventilation for air displacement during the night is another critical design strategy. Ventilative air displacement of 4–8 air changes per hour offers excellent results to reduce the overheating hours. However, overestimating the effects of ventilative cooling and thermal mass can further increase thermal discomfort. The construction of residential houses is
historically dominated by concrete and materials with high thermal storage [35]. Under the increasing cost of high-performance buildings, timber constructions form 15% of all new constructions in Belgium (2009–2019) [36]. The market transformation towards low-carbon construction is accelerating, and the European Union will push the national regulations in this direction. Even though the presented case study is an example of a timber construction with medium thermal mass, increasing thermal mass will not always provide an ideal solution, especially in dense urban cities where the urban heat island effects will alter the microclimate. Besides, counting on the occupants’ thermal adaptation by wearing more relaxed clothes and reducing their level of activity is not helpful to keep the daily mean indoor temperature below 28 °C during summer.
Therefore, we strongly recommend researchers and Belgian governments to act through policy decisions and research projects to develop accurate overheating calculation methods and indicators next to building adaptation and urban mitigation measures. There is a need for weather stations that take into account the sky cover conditions and solar radiation. In addition, there is a need for urban weather stations that can assess the urban heat island effect and the real potential of night cooling. In densely populated cities, there is an overestimation of night cooling effects [37]. Therefore, there is a need to measure apparent sky temperature and total downward radiant heat flux emitted by the atmosphere and couple it to the indoor environmental performance assessment.
Existing and future dwellings will face an ever-increasing risk of overheating. Heat exhaustion is a significant risk during heatwaves because people are exposed to prolonged heat. Extreme heat can affect people’s ability to fall asleep, stay asleep, and feel refreshed from sleep. With many non-air-conditioned office buildings in Belgium, the use of active cooling systems in dwellings might be a counterbalance necessary to avoid adverse health effects and maintain productivity. In the last century, building professionals focused on inventing measures to keep Belgian households warm during winter [38]. However, until the need for this century, there will be a remarkably increasing need to keep buildings fresh during summer in a sustainable way. There is a strong need to encourage passive design such as solar protection, thermal mass, and ventilative cooling for summer-proof homes in Belgium. We are aware that the proposed RCP scenarios (RCP2.6, RCP4.5, RCP6, and RCP8.5) will soon become obsolete as the new ssp585 and ssp454 from CMIP6 project scenarios will replace them [39]. In addition, we are aware that all future data are projections and not predictions. However, we warn from a surge in cooling demand that would increase the electricity demand peaks during heatwaves on the Belgian electricity grid. Besides, comfortable housing means fewer emergency hospital admissions during heatwaves. The well-being of vulnerable persons during summer heat must be a quality requirement for housing.
6. Conclusions
This study contributes to quantifying the impact of climate change on annual overheating hours in newly constructed nZEB. The overheating hours of the 2050 and 2100 scenarios with static and adaptive thermal comfort models exceed the acceptable upper thresholds of discomfort hours in residential buildings. For a freestanding residential building model simulated in East of Belgium under the Passive House Standard comfort model, the worst thermal comfort scenario (by 2050) is found in living rooms. Overheating hours can reach 1195 h (13.6%) under RCP 8.5. Under the adaptive comfort model (EN 15251:2018), the number of hours with the indoor operative temperature that exceeds the upper comfort threshold reaches 400 h (4.5%), 610 h (6.9%), and 850 h (9.7%) under the RCP 4.5, RCP 6, and RCP 8.5, respectively, in 2050. In 2100, the number of hours with the indoor operative temperature that exceeds the upper comfort thresholds reaches 675 h (7.7%), 1120 h (12.7%), and 1395 h (15.9%) under the RCP 4.5, RCP 6, and RCP 8.5, respectively. In 2100, the worst thermal comfort scenario is found in living rooms, where overheating hours can reach 1489 h (16.9%) under RCP 8.5. The study findings confirm that overheating in naturally ventilated nZEB cannot be avoided using passive design measures. Without addressing overheating risks during design, active cooling might be the most convenient choice for tenants and owners. The consequences will be catastrophic, resulting in an increase in carbon emissions and hampering the energy transition [10]. Despite the significant uncertainty of the study findings (−7.3% to +26.8% for the 2050 scenario and −18.9% to
+43.5% for the 2100 climate scenarios), we confirm the remarkable presence of overheating. Future research should investigate the uncertainties derived from the regional weather file against a local weather file, taking into account the urban heat island effect. More importantly, there is a need for a Belgian climate change adaption strategy and plan for the building sector’s energy transition. Author Contributions: Conceptualization, S.A. and C.G.; Data curation, S.A. and C.G.; Formal analysis, C.G.;
Investigation, S.A. and C.G.; Methodology, S.A. and C.G.; Project administration, S.A.; Supervision, S.A.; Validation, S.A.; Visualization, C.G.; Writing – original draft, S.A. and C.G.; Writing – review & editing, S.A. All authors have read and agreed to the published version of the manuscript.
Funding: This research was funded by the Walloon Region under the call “Actions de Recherche Concertées
2019 (ARC)” and the project OCCuPANt, on the Impacts of Climate Change on the indoor environment and energy PerformAnce of buildiNgs in Belgium during summer.
Acknowledgments: We would also like to acknowledge the Sustainable Building Design (SBD) laboratory to
monitor equipment in this research and valuable support during the experiments and the analysis of data. We would also like to acknowledge the Laboratory of Climatology and Topoclimatology of the University of Liège to access the weather data set. The authors would like to recognize the Walloon Region and Liege University for funding gratefully.
Conflicts of Interest: The authors declare no conflicts of interest. References
1. Elrawy, O.O.; Attia, S. The impact of climate change on Building Energy Simulation (BES) uncertainty-Case study from a LEED building in Egypt. IOP Conf. Ser. Earth Environ. Sci. 2019, 397, 012005.
2. Gaterell, M.R.; McEvoy, M. The impact of climate change uncertainties on the performance of energy efficiency measures applied to dwellings. Energy Build. 2005, 37, 982–995.
3. Vardoulakis, S.; Dimitroulopoulou, C.; Thornes, J.; Lai, K.M.; Taylor, J.; Myers, I.; Heaviside, C.; Mavrogianni, A.; Shrubsole, C.; Chalabi, Z.; et al. Impact of climate change on the domestic indoor environment and associated health risks in the UK. Environ. Int. 2015, 85, 299–313.
4. Attia, S. Net Zero Energy Buildings (NZEB): Concepts, Frameworks and Roadmap for Project Analysis and Implementation; Butterworth-Heinemann: Oxford, UK, 2018.
5. Hamdy, M.; Carlucci, S.; Hoes, P.-J.; Hensen, J.L. The impact of climate change on the overheating risk in dwellings—A Dutch case study. Build. Environ. 2017, 122, 307–323.
6. Berardi, U.; Jafarpur, P. Assessing the impact of climate change on building heating and cooling energy demand in Canada. Renew. Sustain. Energy Rev. 2020, 121, 109681.
7. Jylhä; K.; Jokisalo, J.; Ruosteenoja, K.; Pilli-Sihvola, K.; Kalamees, T.; Seitola, T.; Mäkelä, H.M.; Hyvönen, R.; Laapas, M.; Drebs, A. Energy demand for the heating and cooling of residential houses in Finland in a changing climate. Energy Build. 2015, 99, 104–116.
8. Yang, Y.; Nik, V.M. Assessing the impacts of climate change on the German building stock. In Proceedings of the 16th IBPSA Conference, Italy, Rome, 2–4 September 2019, pp. 3563–3570.
9. Ramon, D.; Allacker, K.; van Lipzig, N.P.; De Troyer, F.; Wouters, H. Future Weather Data for Dynamic Building Energy Simulations: Overview of Available Data and Presentation of Newly Derived Data for Belgium. In Energy Sustainability in Built and Urban Environments; Springer: Berlin/Heidelberg, Germany, 2019, pp. 111–138.
10. Attia, Goede praktijken voor zonwering en EPB-berekening, Expert day Zomercomfort Pixii—Passiefhuis-Platform, Gent, Belgium, 10 October 2020. Available online: https://orbi.uliege.be/handle/2268/251437 (accessed on 14 October 2020).
11. KMI. Klimaatverandering: Waarnemingen in België. Available online: https://www.klimaat.be/nl-be/klimaatverandering/belgie/waarnemingen-belgie (accessed on 2 October 2020).
12. Moazami, A.; Nik, V.; Carlucci, S.; Geving, S. Impacts of the future weather data type on the energy simulation of buildings–Investigating long-term patterns of climate change and extreme weather conditions. Appl. Energy 2019, 238, 696–720.
13. Stocker, T.F.; Qin, D.; Plattner, G.-K.; Tignor, M.; Allen, S.K.; Boschung, J.; Nauels, A.; Xia, Y.; Bex, V.; Midgley, P.M. Climate change 2013: The physical science basis. In Contribution of Working Group I to the Fifth
14. Ehret, U.; Zehe, E.; Wulfmeyer, V.; Warrach-Sagi, K.; Liebert, J. HESS Opinions “Should we apply bias correction to global and regional climate model data?” Hydrol. Earth Syst. Sci. Discuss. 2012, 9, doi:10.5194/hess-16-3391-2012.
15. Haddeland, I.; Heinke, J.; Voß; F.; Eisner, S.; Chen, C.; Hagemann, S.; Ludwig, F. Effects of climate model radiation, humidity and wind estimates on hydrological simulations. Hydrol. Earth Syst. Sci. 2012, 16, 305–318. 16. Giorgi, F.; Gutowski, W.J., Jr. Regional dynamical downscaling and the CORDEX initiative. Annu. Rev.
Environ. Resour. 2015, 40, 467–490.
17. Nik, V. Making energy simulation easier for future climate–Synthesizing typical and extreme weather data sets out of regional climate models (RCMs). Appl. Energy 2016, 177, 204–226.
18. Wyard, C. Climate Change in Belgium: Recent and Future Evolution of Global Radiation and Hydroclimatic Conditions Favouring Floods Using the Regional Climate Model MAR. Ph.D. Thesis, Université de Liège, Liège, Belgique, 2018.
19. Meester, T.D. Etude du Comportement Thermique et Energétique d’une Maison Passive par Modélisation Dynamique. MSc Thesis, Université Catholique de Louvain, Ottignies-Louvain-la-Neuve, Belgium, 2008. 20. Gobin, C. Bâtiments D’aujourd’hui, Climat de Demain: Évaluation de L’impact du Réchauffement
Climatique sur le Confort Thermique et L’efficacité Energétique d’un Bâtiment Résidentiel Passif Existant en Belgique. Master’s Thesis, Université de Liège, Liège, Belgique, 2016.
21. Wyard, C.; Fettweis, X. The MAR Model Performances over Belgium. Ph.D. Thesis, Liege University, Liège, Belgium, 2016.
22. Pachauri, R.K.; Allen, M.R.; Barros, V.R.; Broome, J.; Cramer, W.; Christ, R.; Church, J.A.; Clarke, L.; Dahe, Q.; Dasgupta, P.; et al. Climate Change 2014: Synthesis Report. Contribution of Working Groups I, II and III to the
Fifth Assessment Report of the Intergovernmental Panel on Climate Change; IPCC: Geneva, Switzerland, 2014.
23. Wyard, C.; Doutreloup, S.; Belleflamme, A.; Wild, M.; Fettweis, X. Global radiative flux and cloudiness variability for the Period 1959–2010 in Belgium. Atmosphere 2018, 9, 262.
24. Kottek, M.; Grieser, J.; Beck, C.; Rudolf, B.; Rubel, F. World map of the Köppen-Geiger climate classification updated. Meteorol. Z. 2006, 15, 259–263.
25. Mlecnik, E.; Attia, S.; Van Loon, S. Net zero energy building: A review of current definitions and definition development in Belgium. Passiv. House Symp. 2011. Available online: http://www.task42.iea-
shc.org/data/sites/1/publications/T40B3.1-Net_zero_energy_building-A_review_of_current_definitions_and_definition_development_in_Belgium_PHS2011.pdf (accessed on 15 June 2020).
26. Une Maison à Ossature Bois Projet: Habitation à KETTENIS. 2007. Available online: http//energie.wallonie.be (accessed on 15 June 2020).
27. Hauglustaine, J. M.; Michaelis, L. Méthode graphique d'optimisation de la consommation de chauffage et du risque de surchauffe: application à une maison presque passive. Symposium "Passief Huis Happening, Alost, Belgium, 2005; pp 47-53.Tindale, A. Designbuilder Software; Design-Builder Software Ltd.: Stroud, UK, 2020.
28. Tindale, A. Designbuilder Software; Design-Builder Software Ltd.: Stroud, UK, 2020.
29. Pérez-Fargallo, A.; Pulido-Arcas, J.A.; Rubio-Bellido, C.; Trebilcock, M.; Piderit, B.; Attia, S. Development of a new adaptive comfort model for low income housing in the central-south of Chile. Energy Build. 2018,
178, 94–106.
30. Attia, S.; Carlucci, S. Impact of different thermal comfort models on zero energy residential buildings in hot climate. Energy Build. 2015, 102, 117–128.
31. Jones, M.C. Kumaraswamy’s distribution: A beta-type distribution with some tractability advantages. Stat.
Methodol. 2009, 6, 70–81.
32. Narayan, A.; Ponnambalam, K. Risk-averse stochastic programming approach for microgrid planning under uncertainty. Renew. Energy 2017, 101, 399–408.
33. ASHRAE. Standard Method of Test for the Evaluation of Building Energy Analysis Computer Programs; American Society of Heating, Refrigerating and Air-Conditioning Engineers, Inc.: Atlanta, GA, USA, 2001; Volume 140. 34. Judkoff, R.; Neymark, J. Model Validation and Testing: The Methodological Foundation of ASHRAE Standard 140;
National Renewable Energy Lab. (NREL): Golden, CO, USA, 2006.
35. Gauvreau-Lemelin, C.; Attia, S. Benchmarking the environmental impact of green and traditional masonry
wall constructions. Available online: https://orbi.uliege.be/bitstream/2268/212318/1/PLEA2017%20Paper.pdf (accessed on 15 June 2020).
36. Amer, M.; Attia, S. Identification of sustainable criteria for decision-making on roof stacking construction method. Sustain. Cities Soc. 2019, 47, 101456.
37. Caluwaerts, S.; Termonia, P.; Hamdi, R.; Duchêne, F.; Berckmans, J.; Degrauwe, D.; Wauters, G. Monitoring the urban climate of the city of Ghent, Belgium. Urban Clim. News 2016, 61, 15–20.
38. Singh, M.K.; Attia, S.; Mahapatra, S.; Teller, J. Assessment of thermal comfort in existing pre-1945 residential building stock. Energy 2016, 98, 122–134.
39. O’Neill, B.C.; Tebaldi, C.; Van Vuuren, D.P.; Eyring, V.; Friedlingstein, P.; Hurtt, G.; Knutti, R.; Kriegler, E.; Lamarque, J.F.; Lowe, J.; et al. The scenario model intercomparison project (ScenarioMIP) for CMIP6. Geosci.
Model Dev. 2016, 9, 3461–3482, doi:10.5194/gmd-9-3461-2016.
Publisher’s Note: MDPI stays neutral with regard to jurisdictional claims in published maps and institutional
affiliations.
© 2020 by the authors. Licensee MDPI, Basel, Switzerland. This article is an open access article distributed under the terms and conditions of the Creative Commons Attribution (CC BY) license (http://creativecommons.org/licenses/by/4.0/).
![Figure 1. Evolution of the average temperature in Belgium (compared to normal 1961–1990) for the period 1951–2100 (adapted from RMI) [11]](https://thumb-eu.123doks.com/thumbv2/123doknet/6195000.159692/2.892.126.780.237.491/figure-evolution-average-temperature-belgium-compared-normal-adapted.webp)
![Figure 3. Freestanding single-family house, in Kettenis, Belgium (architect: Leo Michaelis) [19,26,27]](https://thumb-eu.123doks.com/thumbv2/123doknet/6195000.159692/4.892.150.759.781.955/figure-freestanding-single-family-kettenis-belgium-architect-michaelis.webp)
![Figure 4. Multizone building energy model in DesignBuilder [20].](https://thumb-eu.123doks.com/thumbv2/123doknet/6195000.159692/5.892.116.780.170.344/figure-multizone-building-energy-model-designbuilder.webp)