Université de Montréal
Rat protease-activated receptor–1 (rPAR1) expression and characterization in Sf9 cells
par Maria Lavalle
Département de physiologie moléculaire et intégrative Faculté de Médecine
Mémoire présenté à la Faculté de Médecine
en vue de l’obtention du grade de Maître ès sciences (M.Sc.) en physiologie moléculaire, cellulaire et intégrative
juillet 2014 ©Maria Lavalle, 2014
ii
Université de Montréal Faculté de Médecine
Ce mémoire intitulé:
Rat protease-activated receptor - 1(rPAR1) expression and characterization in Sf9 cells
Présenté par: Maria Lavalle
a été évalué par un jury composé des personnes suivantes : Dr Réjean Couture (Ph.D.) Président-rapporteur Dr Madhu Anand-Srivastava (Ph.D.) Membre du jury Dr Jean-Louis Schwartz (Ph.D.) Directeur de recherche
iii
DEDICATION
To my family, for their continual encouragement and support. And to my research director, for his guidance, generosity and friendship
iv RÉSUMÉ
Connue pour son rôle dans la cascade de coagulation, la thrombine, une protéase à sérine, peut également agir par l’intermédiaire de PAR1, un récepteur activé par protéase et couplé aux protéines G liant le GTP (GPCR). La thrombine se lie et clive l’extrémité
N-terminale du PAR1 entre l’Arg41 et la Ser42, exposant une nouvelle extrémité terminale qui agit elle-même comme un ligand. La thrombine et une séquence peptidique de cinq acides aminés, composée des résidus Ser42 à Arg46,nommée PAR1-AP, déclenchent dans diverses cellules de mammifères une réponse intracellulaire comportant une composante calcique.
Dans cette étude, le système d’expression par baculovirus dans les cellules Sf9 d'insecte nous a permis d'exprimer le récepteur PAR1 du rat à la surface de ces cellules et de réaliser son couplage fonctionnel à leur signalisation intracellulaire (modèle rPAR1-Sf9). La composante calcique de celle-ci, en réponse au PAR1-AP, a ensuite été étudiée en détail à l’aide de la sonde fluorescente Fura-2 et de plusieurs inhibiteurs agissant sur les canaux calciques ou d'autres éléments de la cascade de signalisation du calcium intracellulaire.
Lorsque le milieu extracellulaire contient du calcium (Ca2+), la thrombine ou PAR1-AP déclenchent un signal calcique qui consiste en une augmentation rapide de [Ca2+]i suivi d’un plateau relativement soutenu, puis d'un retour lent vers le niveau de base initial. En l'absence de Ca2+ dans le milieu extracellulaire, l'augmentation initiale rapide de [Ca2+]i est suivie d'un retour rapide vers le [Ca2+]i de base.
À l’aide d’inhibiteurs de canaux calciques, tels que le lanthane, la nifédipine et le D-600, l'entrée du calcium du milieu extracellulaire dans les cellules est inhibée, abolissant le plateau soutenu de [Ca2+]i. L’inhibition de la pompe Ca2+-ATPase par la thapsigargine supprime la réponse au PAR1-AP après épuisement des sites de stockage de
v
Ca2+intracellulaire. Le TMB-8 agit de façon discordante quant à l’inhibition de la libération de Ca2+ dessites de stockage intracellulaires. La réponse à PAR1-AP n’est pas affectée par le D-609, un inhibiteur de la phospholipase β. L’inhibition de la protéine kinase C (PKC) par le bisindolylmaléimide induit des oscillations en présence de Ca2+ extracellulaire et atténue fortement le signal calcique en absence de Ca2+ extracellulaire. En présence de Ca2+ extracellulaire, l’activation de la PKC par le PBDu tronque le flux de [Ca2+]i tandis que la réponse calcique est abolie en absence de Ca2+ dans le milieu extracellulaire. Le H-89, un inhibiteur de la protéine kinase A (PKA), cause une prolongation de la durée du plateau de [Ca2+]i dans un milieu riche en calcium et la suppression de la réponse à PAR1-AP lorsque le milieu extracellulaire est dépourvu de Ca2+.
Les résultats obtenus nous permettent de conclure que la PKC et possiblement la PKA jouent un rôle critique dans la mobilisation du Ca2+ induite par le PAR1-AP dans le modèle rPAR1-Sf9.
Mots clés: cellule Sf9, baculovirus, thrombine, récepteur activé par protéase (PAR), signalisation calcique, canal calcique, Fura-2
vi ABSTRACT
Thrombin’s serine protease activity allows for it to have a role in both the coagulation cascade as well as through a GTP- binding protein coupled receptor (GPCR) known as the protease-activated receptor-1 (PAR1). Thrombin binds to PAR1 at the N-terminal, cleaving between Arg41 and Ser42, and unmasking a new N-terminal which acts as a tethered ligand. Thrombin and a five amino acid peptide composed of the sequence of residues Ser42 to Arg46, known as PAR 1-AP, has been shown to mediate a number of signalling mechanisms in mammalian cells, including a calcium signalling pathway.
In the present study, the Sf9-baculovirus system allowed us to express the rat PAR1 (rPAR1-Sf9) on the cell surface and study its intracellular signalling. The calcium (Ca2+) signal was studied using the fluorescent probe Fura-2, and several Ca2+ channel inhibitors and calcium signal modulators were used to study the signal induced by PAR1-AP.
In the presence of extracellular calcium[Ca2+]e, thrombin and PAR1-AP produced a Ca2+ signal which consisted of an initial spike in [Ca2+]i followed by a relatively maintained plateau and a slow return towards baseline. In the absence of Ca2+ in the extracellular space, the initial Ca2+ increase is followed by a quick return to baseline [Ca2+]i.
Ca2+ channel inhibitors, lanthanum, nifedipine and D-600, inhibited the entry of Ca2+ from the extracellular space and abolished the plateau phase of the response to PAR1-AP. Inhibition of the Ca2+-ATPase with thapsigargin abolished the response to PAR1-AP after having depleted the Ca2+ stores involved in the initial spike in [Ca2+]i. TMB-8, expected to inhibit the release of Ca2+ from internal stores, inconsistently inhibited the [Ca2+]i response to PAR1-AP. The response elicited by PAR1-AP was not affected by D-609, an inhibitor of phospholipase Cβ. Inhibition of protein kinase C (PKC) with bisindolylmaleimide induced
vii
oscillations in the [Ca2+]i levels in the presence of extracellular Ca2+ while it significantly blunted the response in the absence of extracellular Ca2+. PDBu activation of PKC truncated the [Ca2+]i surge in Ca2+-rich conditions while abolishing it altogether in the absence of extracellular Ca2+. H-89 inhibition of protein kinase A (PKA) prolonged the plateau duration in Ca2+-rich medium while inhibiting the response to PAR1-AP in a Ca2+-deficient
environment.
Taken together, our results suggest that PKC and possibly PKA play a critical role in the mobilisation of Ca2+ in rPAR1-Sf9 by PAR1-AP.
Key words: Sf9, baculovirus, thrombin, protease-activated receptor (PAR), calcium signalling, calcium channel, Fura-2.
viii TABLE OF CONTENTS DEDICATION... iii RÉSUMÉ ... iv LIST OF FIGURES ... x LIST OF TABLES ... xi ABBREVIATIONS ... xii ACKNOWLEDGEMENTS ... xiv INTRODUCTION... 1 1.1 Coagulation cascade... 2
1.2 Thrombin and its receptor ... 3
1.2.1 Thrombin ... 3
1.2.2 Protease-activated receptor 1 (PAR1) ... 4
1.2.3 PAR1-mediated role of thrombin ... 8
1.3 Protease-activated receptor 1 (PAR1) activation ... 10
1.3.1 G-protein coupling to PAR1 and signalling cascade in mammalian cells ... 10
1.3.2 Focus on Ca2+ mobilisation and store-operated Ca2+entry (SOCE) ... 12
1.3.3 Inactivation of the receptor ... 14
1.3.4 Recent advances in understanding PARs ... 15
1.4Spodoptera frugiperda (Sf9) cell line ... 16
1.5 Rationale, hypothesis and objectives ... 18
MATERIALS AND METHODS. ... 20
2.1 Construction of the recombinant baculovirus rPAR1 and virus preparation ... 21
2.2 Infection procedure ... 22
2.3 Detection of expressed receptor in cell membranes ... 22
2.3.1 Receptor–antibody cross-linking studies in rPAR1-Sf9 cells ... 22
2.3.2 Western blot membrane preparation and endoglycosidase treatment of rPAR1 ... 23
2.3.3 Immunocytochemistry, fluorescence-activated cell sorting (FACS) and confocal microscopy ... 25
2.4 Functional assays ... 26
ix
2.4.2 Preparation and use of agonists and signal modulators ... 27
2.4.3 Microspectrofluorescence ... 28
RESULTS. ... 30
3.1 Sf9-baculovirus expression system of rPAR1 receptor ... 31
3.1.1 Successful expression of rPAR1 ... 31
3.1.2 Localization of the rPAR1 receptor expressed in Sf9 cells ... 32
3.2 Changes in [Ca2+]i concentration using octopamine... 34
3.3 Functional coupling of rPAR1 in Sf9 cells ... 38
3.3.1 Effect of thrombin ... 38
3.3.2 Effect of PAR1-AP ... 39
3.4 Modulation of the rPAR1-Sf9 cell signal ... 41
3.4.1 Effect of calcium-channel inhibitors ... 41
3.4.2 Effect of other calcium transport modulators ... 45
3.4.3 Signal cascade modulation ... 48
DISCUSSION. ... 53
4.1 Sf9-Baculovirus expression system ... 54
4.2 Effective coupling of rPAR1 and modulation of response in Sf9 cells ... 56
4.3 Store-operated Ca2+ entry ... 62
CONCLUSION AND FUTURE DIRECTIONS. ... 66
5.1 Conclusion ... 67
5.2 Future directions ... 68
APPENDIX.Calibration of Ca2+ concentration ... 69
x LIST OF FIGURES
INTRODUCTION
Figure 1: Thrombin’s molecular structure………... 4
Figure 2: Structure of human PAR1 with an antagonist...……… 5
Figure 3: PAR1 sequence...………... 6
Figure 4: Thrombin binding to PAR1 exodomain………... 8
Figure 5: PAR1 signalling cascade activation... 10
RESULTS Figure 6: Western blot analysis of rPAR1 infected Sf9 cells………... 32
Figure 7: FACS analysis of rPAR1 expression…...……….. 33
Figure 8: Different views of confocal micrographs of a single Sf9 cell expressing rPAR1. 34 Figure 9: Effect of octopamine on cytosolic calcium in wild-type Sf9 cells……… 35
Figure 10: Effect of infection time on intracellular Ca2+ concentration change in response to octopamine in baculovirus-Sf9 cells……….………...………... 36
Figure 11: Effect of thrombin on [Ca2+]i in Sf9 insect cells expressing rPAR1…………... 39
Figure 12: Effect of synthetic peptide PAR1-AP on [Ca2+]i in rPAR1-Sf9 cells…………. 40
Figure 13: Effect of La3+ pre-incubation on the [Ca2+]i response to PAR1-AP……… 42
Figure 14: Effect of La3+ applied during the [Ca2+]i surge triggered by PAR1-AP... 43
Figure 15: Effect of nifedipine on the Ca2+ flux produced by PAR1-AP activation in rPAR1-Sf9 cells...………... 44
Figure 16: Effect of D-600 on the [Ca2+]i response to PAR1-AP…...………. 45
Figure 17: Effect of thapsigargin on the [Ca2+]i response to PAR1-AP activation in rPAR1-Sf9..……….. 46
Figure 18: TMB-8 inhibition of Ca2+ release from the ER………... 47
Figure 19: Ineffective inhibition by TMB-8………. 47
Figure 20: Effect of D-609 on the [Ca2+]i response to PAR1-AP……… 49
Figure 21: Effect of bisindolylmaleimide on the [Ca2+]i response induced by PAR1-AP… 50 Figure 22: Effect of PDBu on the Ca2+ surge produced by PAR1-AP………. 51
Figure 23: Effect of H-89 on the [Ca2+]i response to PAR1-AP...……… 52
Figure 24: Ca2+ signal modulation in rPAR1-Sf9... 58
APPENDIX 1 Figure 25: Calcium signal calibration…...………... 70
xi LIST OF TABLES
Table 1: Summary of qualitative changes in Fura-2 fluorescence ratio reflecting
xii ABBREVIATIONS
AC adenylyl cyclase
AcMNPV Autographa californica nuclear polyhedrosis virus
ADP adenosine diphosphate
Arg arginine
Asp aspartic acid
ATP adenosine triphosphate
βARK2 beta-adrenergic receptor kinase - 2
BSA bovine serum albumin
BS3 bis (sulfosuccinimidyl) suberate
Ca2+ calcium ion
[Ca2+]i intracellular calcium concentration [Ca2+]e extracellular calcium concentration cDNA complementary deoxyribonucleic acid
Cl- chloride ion
D-600 methoxyverapamil
D-609 tricyclodecan-9-yl xanthogenate
DAG diacylglycerol
DNA deoxyribonucleic acid
DTS dense tubular system
EGTA ethylene-glycotetraacetic acid
ER endoplasmic reticulum
FACS fluorescence-activated cell sorter
FBS fetal bovine serum
F fluoride
GEF guanine exchange factor
GPRC GTP-binding protein coupled receptor
GSM Grace’s simplified medium
h hour H+ hydrogen ion H2O water H-89 N-[2-[[3-(4-bromophenyl)-2-propenyl]amino]ethyl]-5-1 isoquinolinesulfonamide Ig immunoglobulin IP3 inositol 1,4,5 triphosphate K+ potassium ion La3+ lanthanum ion Leu leucine M3 muscarinic receptor 3 M5 muscarinic receptor 5
MAP mitogen-activated protein MAPK mitogen-activated protein kinase MOI multiplicity of infection
xiii NCCE non-capacitative Ca2+ entry
nm nanometer
PAF platelet activating factor PAR protease-activated receptor PAR1 protease-activated receptor-1 PAR2 protease-activated receptor-2 PAR3 protease-activated receptor-3 PAR4 protease-activated receptor-4 PBS phosphate buffered saline
PCR polymerase chain reaction
PDBu phorbol 12, 13-dibutyrate
Phe phenylalanine
PI3K phosphoinoside 3-kinase
PIP2 phosphatidylinositol 4,5-biphosphate
PK protein kinase
PKA protein kinase A
PKC protein kinase C
PLC phospholipase C
PLD phospholipase D
Pro proline
RNA ribonucleic acid
rpm revolutions per minute
RT-PCR reverse transcriptase – polymerase chain reaction
s seconds
SDS-PAGE sodium dodecyl sulphate –polyacrylamide gel electrophoresis
Ser serine
Sf Spodoptera frugiperda
SOC store-operated calcium channel SOCE store-operated calcium entry SRE sterol responsive element STIM-1 stromal interaction molecule-1
TB tris (hydroxymethyl) aminomethane buffer
TMB-8 3,4,5-trimethoxybenzoic acid 8-(diethylamino)octyl ester Tris tris (hydroxymethyl) aminomethane
V volts
xiv ACKNOWLEDGEMENTS
A very special note of gratitude to my director, Dr Jean-Louis Schwartz, for his guidance and counsel throughout this process. Your continuous support was instrumental to the realization of this work.
To the jury members, Dr Rejean Couture and Dr Madhu Anand-Srivastava, a sincere thank you for your comments and suggestions in rendering this document final.
I would also like to thank the National Research Council of Canada and the staff at the Biotechnology Research Institute, including Dr Maureen O’Connor-McCourt and her staff, most notably Cathy Collins for her help in building the recombinant baculovirus.
As well, many thanks to Roseanne Tom, Léna Potvin and Narcisse Komas for their aid on various aspects of cell culture, microspectrofluorescence and confocal microscopy.
I would also like to thank Dr Morley D. Hollenberg, for his collaboration on designing this study, and his group for providing the antibodies used throughout the study.
A special acknowledgement to Dr Martin Noel and Dr Paul Poirier for the enthusiasm with which they provided editorial support.
Special thanks to the Canadian Institutes of Health Research for providing funding for this project through a collaborative research grant to M.H. and JL.S. and Biochem Pharma.
A particular thank you to AstraZeneca Canada for providing an environment whereby learning and development are encouraged as part of the corporate culture.
Finally, I would like to thank every member of my family, especially my parents, my husband Mike and our children (Anthony, Tessa-Marie, Joel and Kiara), for their love, support and encouragement over the course of this process.
1
2
Thrombin is a well-studied protein of the coagulation cascade. Its proteolytic activity has long interested cardiovascular physiologists, due to its critical involvement in the
formation of platelet plugs and subsequent clot formation. The proteolytic cleavage of fibrinogen to fibrin, by thrombin, is a critical step in clot stabilization. It is now known that thrombin’s actions go well beyond the cleavage of fibrinogen. Thrombin is involved in the pathophysiology of thrombosis, and in other processes including atherosclerosis [1], and even tumor growth [2].
By studying thrombin’s effects on different functional systems, investigators identified the thrombin receptor [3] as part of a unique subclass of G-protein coupled receptor (GPCR), activated through proteolytic cleavage of the extracellular domain. The subclass is known as the protease activated receptors (PARs). While thrombin’s serine protease action is a critical component of the coagulation cascase, activation of its receptor, the protease activated receptor-1 (PAR1), mediates much of thrombin’s cellular activity [2, 4-7].
1.1 Coagulation cascade
The coagulation cascade is integral to maintaining homeostasis and is divided into an intrinsic and an extrinsic system.
The intrinsic pathway, is activated by the exposure of subendothelial collagen, platelet phospholipids and the presence of ionized calcium and plays a secondary role in coagulation.
The extrinsic system is the principal pathway of blood coagulation. It involves both vascular and blood elements. Vascular injury damages endothelial cells and exposes tissue factor; a glycoprotein embedded in and around blood vessels and various other tissue cells. Tissue factor contributes to the activation of the extrinsic pathway of the coagulation cascade, which begins with an inactive form of Factor VII. A series of steps ensues whereby each
3
coagulation factor is activated by its predecessor [8], with the exception of those factors that are involved in the common pathway.
Lastly, blood components, in particular, leukocyte and monocyte derived
microparticles, can be recruited to sites of vascular injury, and express low levels of tissue factor as well, thus play a role in activating the coagulation cascade.
The common pathway refers to the final steps of the coagulation cascade common to both the intrinsic and extrinsic systems and consists of the activation of Factor X to form Factor Xa. This critical step is required for the cleavage of thrombin from its precursor state, prothrombin [9].
Thrombin is ultimately required for the cleavage of fibrinogen into fibrin through its serine protease activity. This final step in the coagulation cascade is responsible for clot stabilization and solidification [9].
1.2 Thrombin and its receptor 1.2.1 Thrombin
While thrombin is best known for its role in the circulatory system, it has also been identified as being involved in a multitude of different physiological systems including the vascular, respiratory, gastrointestinal, renal, musculoskeletal and nervous systems [6].
Within the circulatory system, inappropriate activation of thrombin leads to the formation of thrombi. These circulating blood clots may partially or fully occlude blood vessels, causing thrombosis, stroke or cardiac ischemia.
Thrombin’s structure consists of a globular protein (Figure 1A), composed of two chains which are 36 and 259 amino acids in length and linked by a single disulfide bond. It is
4
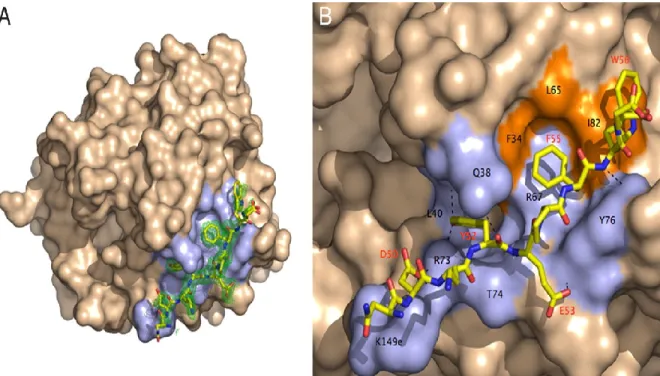
ellipsoid in shape and interacts with its substrates in a highly specific manner [7]. The structural details of this interaction are shown in Figure 1B.
Figure 1: Thrombin’s molecular structure. A: Thrombin structure. Thrombin’s active site is flanked by three catalytic amino acids (His43, Asp99, Ser205) at its base. This triad is
surrounded by the primary specificity pocket (Asp109) and two insertion loops [10].Two anion binding exosites are located at the extremities of the molecule and are responsible for
thrombin’s actions. Anion exosite 1 recognizes fibrinogen and the N-terminal of PAR1, while exosite 2 is involved in the interaction with heparin [11]. B: Thrombin–PAR1 interface. The hydrophobic regions of thrombin are coloured in orange and its polar regions are light blue. Thrombin’s residues involved in contact with PAR1 sit in the hydrophobic region with black labels representing thrombin’s residues and red labels representing the residues located on PAR1. The residues involved in the cleavage of the extracellular fragment of PAR1 have been labelled in red. The N-terminal of PAR1 fits into exosite 1 through polar and hydrophobic interactions. Hydrogen bonds which form between thrombin and PAR1 are depicted as broken lines [10]. (Adapted from [10])
1.2.2 Protease-activated receptor 1 (PAR1)
In addition to its role in the coagulation cascade, thrombin exerts its receptor-specific activity through PAR1 [6]. The PAR1 receptor is a member of the GPCR receptor
5
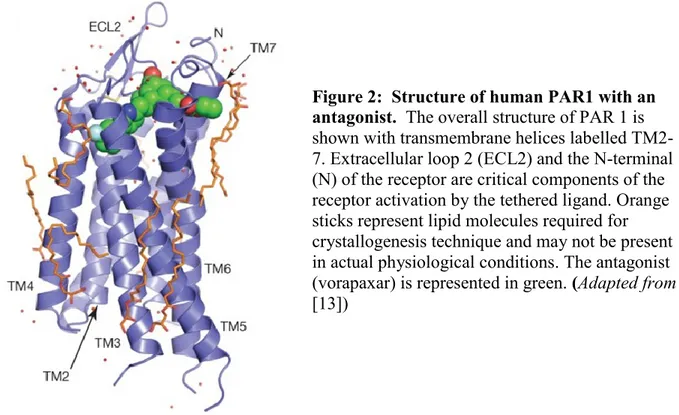
superfamily. The three-dimensional structure of the human PAR1 crystalized in the presence of vorapaxar, a PAR1 antagonist, has recently been elucidated [12] and is shown in Figure 2.
Figure 2: Structure of human PAR1 with an antagonist. The overall structure of PAR 1 is shown with transmembrane helices labelled TM2-7. Extracellular loop 2 (ECL2) and the N-terminal (N) of the receptor are critical components of the receptor activation by the tethered ligand. Orange sticks represent lipid molecules required for crystallogenesis technique and may not be present in actual physiological conditions. The antagonist (vorapaxar) is represented in green. (Adapted from [13])
The protein is 425 amino acids long, and is organized into seven helical
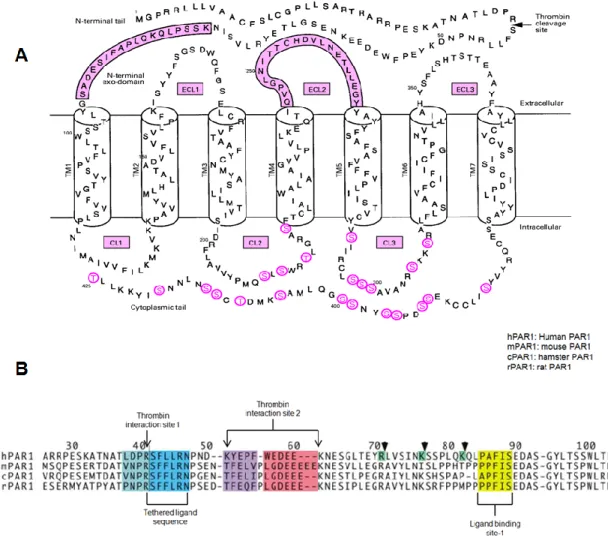
transmembrane domains with three intracellular and three extracellular loops (Figure 2 and Figure 3A). The N-terminal of the receptor is extracellular. This exodomain contains the thrombin cleavage site and the region that will form the new ligand after cleavage. Figure 3B shows the primary sequences of the human, mouse, hamster and rat PAR1 exodomains, as well as the tethered ligand sequences, the thrombin interaction sites and the ligand binding sites. They display a high level of homology. The C-terminal of PAR1 is located
6
Figure 3: A: PAR1 sequence. The amino acid sequence includes the thrombin cleavage site, the extracellular domain, extracellular loops (ECL) and cytoplasmic loops (CL). Intracellular phosphorylation sites appear in red letters. Pink boxes include the extracellular domains where the newly cleaved terminal interacts with the ligand binding site-1 (located in the
N-terminal exodomain above) and extracellular loop 2 (ECL2). (Adapted from [14]) B. PAR1 exodomain sequences in various species. Considerable sequence homology exists in PAR1 exodomains across species. Thrombin molecules interact with the receptor through thrombin interaction sites 1 and 2. Cleavage of the peptide bond between Arg41 and Ser42 yields a new N-terminal. The peptide sequence located at the new N-terminal is referred to as the tethered ligand sequence. The receptor’s N-terminal binds at ligand binding site-1 to activate
downstream signalling. (Adapted from [15])
Thrombin activates its receptor through a highly specific (Km of 15-30 M) proteolytic cleavage at a site located between residues Arg41 and Ser42 (Figure 3)[15-17]. Thrombin’s receptor mediated activity depends on its ability to bind to the PAR1 receptor’s N-terminal
7
exodomain (Figure 4) and cleave a peptide bond between Arg41 and Ser42, yielding a new N-terminal [9].
Receptor activation occurs through two thrombin interaction sites on the receptor; the first immediately N-terminal to Arg41 and the second between residues 53 (responsible for the recognition of the receptors’ cleavage site) and 64 (involved in an interaction with one of the anion binding exosites on thrombin). PAR1 requires interaction of the Arg-Asp-Pro-Leu segment with the apolar pocket of the thrombin molecule [18]. In the interaction of thrombin with its receptor, an initial contact is made between exosite-1 (Figure 4) on thrombin and the receptor’s thrombin interaction site-1 (Figure 3B). The N-terminal then becomes newly oriented, and a hydrogen bond between Asp39 and Arg41is disrupted, freeing the arginine and allowing cleavage of the receptor to occur through thrombin’s active site (Figure 3) [14, 15]. Cleavage creates a new, tethered, N-terminal sequence starting after Arg41, which binds to the ligand binding site-1 [15] located within the N-terminal exodomain [19]. Although
extracellular loop 2 is the main site for binding of the tethered ligand (Figure 3A), binding also involves domains present on extracellular loop 1 as well as on extracellular loops 3 and 4 [15].
Synthetic peptides corresponding to the new N-terminal sequence have been shown to activate the receptor, generating downstream signals in mammalian cells [15, 20]. While the tethered ligand sequences shown in Figure 3B are made up of six amino acids ending with Asp, a minimal peptidomimetic compound, PAR1-activating peptide (PAR1-AP), corresponds to the five amino acids, Ser-Phe-Leu-Leu-Arg, that immediately follow the cleavage site.
8
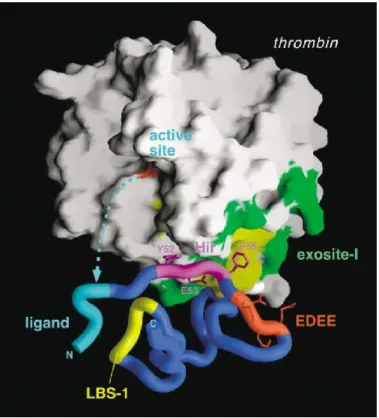
Figure 4: Thrombin binding to PAR1 exodomain. The globular protein thrombin binds to the exodomain of the PAR1through polar and hydrophobic interactions. The extremity of the N-terminal fits into thrombin’s active site where it is cleaved, yielding a new N-terminal (denoted as N in figure) which acts as a tethered ligand. The tethered ligand (marked ligand in figure) can then activate cell signalling through an interaction with another area of the
exodomain labelled ligand binding site-1 (LBS-1).The minimal peptidic sequence known to activate PAR1 corresponds to the five amino acid sequence Ser-Phe-Leu-Leu-Arg. (adapted
from [15])
1.2.3 PAR1-mediated role of thrombin
The thrombin receptor was the first PAR to be identified in its subclass, which is the reason for it having been named PAR1. It is a well-studied member of the PAR superfamily. Genetic and physical mapping of this receptor led to the recognition of additional protease-activated receptor subtypes, including PAR2 [21], PAR3 [22], and PAR4 [23]. While PAR1, PAR3 and PAR4 are activated by thrombin, PAR2 is activated by the Tissue Factor/VIIa binary complex and by Factor Xa [6]. While mostly colocalized within 90kb of each other on
9
chromosome 5q13 [24], the human PAR4 gene is located on chromosome 19p12 [25]. PARs are often co-expressed and coactivation has been identified as a mechanism of action for some PARs in in-vitro testing [5].
For the purpose of this work, focus will be placed on PAR1, the first receptor identified in the PAR-superfamily.
As thrombin results from the cleavage of prothrombin in the circulatory system, it is intuitive to deduce that blood components would be amongst the key targets of thrombin. In particular, the PAR1 receptor plays a substantial role in platelet activation, particularly at low thrombin concentrations [8]. PAR1 activation in platelets is associated with platelet shape change, aggregation and granular secretion responsible for hemostasis which involves
adenosine diphosphate (ADP), 5-hydroxytryptamine [26], platelet activating factor (PAF), and thromboxane [9]. Platelet shape change results in increased platelet adhesion to exposed tissues. Platelet degranulation serves to amplify platelet aggregation. Activation of the platelet increases the cell-surface expression of glycoproteins IIb/IIIa – a fibrin cross-linking site essential for clot solidification.
The inappropriate activation of platelets through the action of PAR1 can lead to serious medical conditions caused by the formation of thrombi, including myocardial infarct and stroke. For this reason, PAR1 has the potential to be a useful pharmacological target.
Zontivity™ (vorapaxar) which has been approved by the US Food and Drug Administration in May 2014 is the first pharmaceutical antagonist of PAR1.
(www.fda.gov/NewsEvents/Newsroom/PressAnnouncements/ucm396585.htm, 8/5/2014). In addition to its expression on platelets, PAR1 is also expressed on other cells. For example, macrophages [27], endothelial cells [7] and vascular smooth muscle cells [1] have.all
10
been shown to express PAR1 and are involved in a thrombin-mediated response to vascular injury [6].
1.3 Protease-activated receptor 1 (PAR1) activation
1.3.1 G-protein coupling to PAR1 and signalling cascade in mammalian cells The subtype of G-protein activated by a given receptor depends upon the
transmembrane segments of receptors in concert with the cytoplasmic loops [28]. In the case of PAR1, coupling occurs in a promiscuous fashion with multiple G-protein families: Gα12/13 [29], Gαq [9] and Gαi/z [8], thus allowing for modulation of a number of intracellular
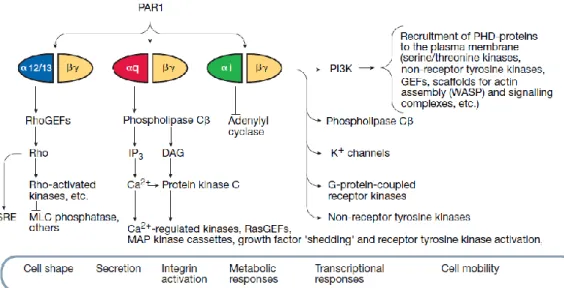
signalling pathways, as described below and represented schematically in Figure 5. The first of these, Gα12/13, modulates shape change, the initial phase of platelet activation. The 12/13 subunit activates myosin light-chain phosphatases via Rho-guanine exchange factors (GEFs), activated Rho (small G-protein) and Rho-activated kinases. In some nucleated cells, this pathway mediates the function of cadherins, catenins and sterol-responsive element (SRE) required for permeability and migration in endothelial cells [9].
Figure 5: PAR1 signalling cascade activation. The figure shows the downstream signalling cascades activated by the thrombin receptor in mammalian cells. (Adapted from [9])
11
The Gβγ subunits can activate phosphoinositide 3-kinase (PI3-kinase), phospholipase Cβ (PLCβ), K+- ion channels, and GPCR-kinases and non-receptor tyrosine kinases [9].
Gαq coupling with PAR1 activates PLC and is primarily responsible for the formation of inositol 1,4,5-triphosphate (IP3) and diacylglycerol (DAG), the by-products of hydrolysis of phosphatidylinositol 4,5-biphosphate (PIP2) [30]. Increased intracellular IP3 causes
Ca2+mobilization from its intracellular stores, activation of plasma membrane Ca2+ channels , and activation of Ca2+ kinases including PKC, tyrosine kinases, mitogen-activated protein kinases (MAPKs) and RasGEFs [4].
DAG activates the protein kinase C (PKC) pathway. PKC’s activation mediates MAPKs, RasGEFs, Ca2+ activated kinases and receptor tyrosine kinases. The substrates of these kinase reactions are also part of the Ras/MAPK cascade, thereby acting to enhance the initial response further and act as a feedback mechanism which terminates the activation of the signalling cascade [14]. In human platelets, a store-independent, non-capacitative Ca2+ entry (NCCE) pathway activated by DAG has been identified as a contributor to the thrombin-induced increase in [Ca2+]i [31].
The PLC substrate pool is replenished via PI3-kinase activity. Phosphorylation of pp125FAK, through the stimulation of Rho by the Gα subunit will precipitate pp125FAK binding to Src, which will also initiate downstream signalling and PI3K activation [14], thereby allowing for the DAG pathway to complement the actions of the IP3 pathway.
Phospholipase D (PLD) activity can also be secondary to thrombin’s activation of PLCthrough phosphatidylinositol 4,5-bisphosphate and low molecular mass G-proteins (not shown in Figure 5). PLD catalyzes the formation of phosphatidate from phosphatidylcholine
12
which is responsible for the production of arachidonic acid in platelets [14] which leads to platelet activation.
The Gαi/z pathway is mainly responsible for PAR1’s inhibition of adenylyl cyclase (AC). AC catalyzes the conversion of ATP to cAMP and the inhibition of this conversion lowers cAMP levels and causes a corresponding decrease in protein kinase A (PKA) activation [9]. This cascade serves to modulate Raf activation via Ras activation. Raf then relieves the inhibition of AC shutting down the cascade [14]. The βγ subunits, per se, may play a role in the transcriptional response and cell mobility through effectors such as PI3-kinase, PLCβ, K+ channels, and G-protein coupled and non-receptor tyrosine kinases.
However, particularly in platelets, the function of the βγ subunits is less well-established [30]. Finally, PAR1 has also been shown to signal through a 33 kDa serine-threonine protein kinase (PK33) in platelets. PK33 is activated within seconds of either thrombin or PAR1-AP addition to platelets, and may be linked to potentiating the aggregation [32] which is induced by the PLC pathway.
Therefore, activated PAR1 couples with several signalling cascades which are interrelated and interdependent, and coordination of the receptor’s activity relies heavily on switch kinases which provide relay stations for the integration of intracellular signals.
1.3.2 Focus on Ca2+ mobilisation and store-operated Ca2+entry (SOCE)
The present study assessed the signalling mechanism related to the mobilization of Ca2+in response to PAR1-AP in PAR1-Sf9 cells using pharmacological tools in an attempt to dissect out its various components.
13
In a GPCR signalling system, Gαq has been associated with the mobilisation of Ca2+. As previously mentioned, the PAR1-Gαq interactionleads to the activation of PLCβ.
Activation of PLCβ, which can be inhibited by using D609, mediates the hydrolysis of phosphatidylinositol 4,5-biphosphate (PIP2) and subsequent formation of IP3 and DAG. Newly formed IP3 binds to IP3 receptor (IP3R)- Ca2+ channels, located in the membrane of the endoplasmic reticulum (ER), and activates an efflux of Ca2+ from the ER into the cytosolic space [33]. These Ca2+ channels are importantly regulated by the presence of IP3 and Ca2+ sensors located directly on the channel as well as by a number of protein kinases including PKA and PKC [33]. IP3R- Ca2+ channels can be inhibited either specifically through the use of TMB-8 [34] or concurrently with plasma membrane Ca2+ channels by using D-600 [35].
The intracellular Ca2+ concentration ([Ca2+]i) is regulated by a plasma membrane Ca2+ pump mediated transport which extrudes Ca2+ from the cytosolic space out of the cell which is energized by adenosine triphosphate and by a thapsigargin-sensitive Ca2+-ATPase which transports cytosolic calcium into the ER and other organelles [36].
Inhibition of the activity of PKA through the use of H-89 [37] would remove its contribution to modulating the IP3R- Ca2+ channel activation.
The depletion of Ca2+ from the ER is detected by stromal interacting molecule-1 (STIM-1) [38]. The activation of STIM-1 allows for its translocation to puncta, which refers to the interface between the ER and the plasma membrane. Once translocated to puncta, STIM-1 activates Orai-1 channels [39]. Orai-1 channels belong to a novel class of Ca2+ channels which may function as L-type Ca2+ channels and are lanthanum ion (La3+)-sensitive [38, 39].
14
The entry of Ca2+ from the extracellular space can be controlled either by using a Ca2+ -free medium or by inhibiting Ca2+ entry with Ca2+ channels inhibitors, such as La3+ [40], nifedipine [35] or D-600 [35].
The second by-product of PIP2 hydrolysis is DAG. DAG is a principal activator of PKC within cells. PKC, so named as it is a Ca2+-sensitive protein kinase, is a key modulator in the mobilization of Ca2+ throughout the cell. PKC activity is associated with Ca2+ channel phosphorylation and inactivation, including the inactivation of Orai-1 channel phosphorylation [41]. It may also play a role in the phosphorylation of IP3R-activated Ca2+ channels [33, 42].
The inhibition of PKC with bisindolylmaleimide [43] would prolong any increase in [Ca2+]i while the use of PDBu would potentiate PKC activity [44, 45], hastening the
phosphorylation of PKC targets, including Ca2+ channel phosphorylation and inactivation.
1.3.3 Inactivation of the receptor
PAR1 inactivation is a two-step process. Initially, phosphorylation of serines and threonines on the cytoplasmic C-tail occurs, and is attributed to at least two protein kinases. The first is a PKC, and the second is a presumed G-protein receptor specific kinase, the beta-adrenergic receptor kinase-2 (ARK2) [45]. Approximately 85% of the cell surface receptors are internalized in coated pits within one minute of activation; most of these are targeted to lysosomes [46]. Receptor internalization is specific to activated PAR1 [47] and the rate of reappearance of the cell’s response to thrombin suggests that de novo synthesis of the receptor is required. However, recovery from the desensitized state, in response to PAR1-AP addition, can occur in mammalian cells within 30 to 60 minutes [47], suggesting some receptor
15
In endothelial cells and fibroblasts, a population of PAR1s located in intracellular pools has been identified [48]. These are transported to the cell surface following thrombin stimulation, allowing the cell to be reactivated rapidly. In platelets, it is unlikely that
reappearance of receptors at the surface is required since platelets are activated only once [8].
1.3.4 Recent advances in understanding PARs
Numerous biochemical advances have been made since the initial discovery of PAR1. To begin with, other proteases have recently been shown to cleave and activate
PAR1, including factor Xa [49], plasmin [50], kallikreins [51, 52], activated protein C (APC) [53], matrix metalloproteinase-1(MMP1) [54], neutrophil elastase (NE) [55] and neutrophil proteinase-3 (PR3) [55]. The cleavage by these proteases reveals receptor-activating sequences that differ from each other [55] and are classified as ‘non-canonical’ tethered ligands. Synthetic peptides derived from this ‘non-canonical’ cleavage of PAR1 (e.g. TLDPRSF-NH2 for a PR3 tethered ligand derived-activating peptide, or RNPNDKYEPF-NH2 for a NE tethered ligand-derived activating peptide) can serve as ‘biased’ agonists of PAR1 to activate selective components of signalling, like MAPK, but not calcium signalling [55].
At present, PAR signalling is known to activate several major signal pathways. First, and that which is the focus of this study, is the ‘classical pathway’ in which receptor activation causes signalling via G-proteins and downstream targets.
It is, however, important to note that two additional pathways have been associated with PAR1 activity. The first of these includes a beta-arrestin signalling pathway involving ligand-regulated scaffolds [56]. Arrestin-bound GPCRs are uncoupled from their classical
G-16
proteins to activate other signalling pathways [57]. Arrestin-dependent signals can be initiated by ‘biased’ agonists, creating the potential for drugs that can modulate specific GPCR
function.
It has recently been discovered that PARs are able to function both as monomeric receptors and as partners in a variety of complexes including homo- and heterodimers consisting of PAR-PAR, PAR-GPCR and PAR-non-GPCR [58]. This transactivation of a variety of receptors [58] and other signalling constituents (e.g. ion channels) is thought to occur through specific signalling components rather than by a physical interaction.
The advances in the understanding of PARs point to the importance of studying the components of the PAR1 Ca2+ signalling cascade in that it could be critical to regulating one or more of the actions of the receptor.
1.4 Spodoptera frugiperda (Sf9) cell line
Sf9 cells originate in the ovary of the fall armyworm Spodoptera frugiperda. These cells are susceptible to infection by baculovirus type viruses. The baculovirus expression system is widely used for heterologous expression since it provides a eukaryotic environment which is ideal for the production of viable proteins, including mammalian proteins. The use of recombinant baculovirus has previously been used as a high-output expression system for mammalian proteins, including cell-surface receptors [59]. The baculovirus expression system functions in a simple viral fashion. Infectious particles enter the host cells by
receptor-mediated endocytosis [60] and the viral DNA is uncoated in the nucleus. Within 6 hours the entire viral DNA begins to replicate, at first releasing viral particles into the extracellular environment (also known as the budded virus). The budded virus is responsible for the
17
infection in cell culture [60]. The later phase of infection is characterized by the appearance of occluded virus particles embedded in a polyhedrin protein.
This polyhedrin protein is maximally expressed in the late phase of infection.
However, this phase is not necessary for the viability of the virus in cell culture. Insertion of heterologous DNA in place of the polyhedrin allow for replication to be controlled by the polyhedrin promoter, thus producing recombinant baculovirus in large quantity. Infection of Sf9 cells according to this method allowed us to express a rat PAR1 which was believed to have proper folding, disulfide bonds, oligomerization, and most post-translational
modifications.
It is believed that the pharmacology of GPCR expressed using the Sf9/baculovirus system is similar to that in mammalian systems [40].
It is well known that Sf9 cells possess an intrinsic seven transmembrane, GPCR for octopamine, a neurotransmitter. Functional studies have established that activation of this receptor and coupling to Gαs yields an increase in intracellular calcium through the release of Ca2+ from intracellular stores [61]. The Sf9 cell membrane is equipped with a potassium (K+)/hydrogen (H+) ion exchanger, a chloride (Cl-) channel, a muscarinic (M3)-G-protein coupled K+ channel and two distinct Ca2+ channels, one which is activated secondary to intracellular Ca2+ release from intracellular pools and is sensitive to lanthanum ions (La3+), and one which is muscarinic (M5) and is barium, gadolinium, and La3+-sensitive [40, 62].
The existence of several G-protein forms have been identified in Sf9 cells. These include Gαi/z., Gα12/13 , Gαs and Gαq [26]. Both Gαi/z, Gα12/13 are found at lower levels while higher levels of Gαs and Gαq have been identified [63].
18
It is believed that the insect cell Gαi/z-like proteins do not couple to mammalian GPCR whereas the remainingforms have been shown to couple to various mammalian receptors [40].
A number of additional signal transduction components have been identified in Sf9 cells, including the presence of AC, PLC, and GPCR kinase [40].
Therefore, expression of rPAR1 in Sf9 cells was meant to take advantage of a system made up of an isolated exogenous mammalian receptor coupled to the insect cell endogenous signalling cascades, especially that of intracellular calcium signalling, for the study of its activation by PAR1-AP, using Fura-2 microspectrofluoroscopy.
1.5 Rationale, hypothesis and objectives
The rationale of the current study was largely based on the material exposed in the previous sections. The important points that justify the present work are summarised below:
1. The Sf9 insect cell system is an excellent way to express membrane proteins in large amount and at low cost;
2. Sf9 cells have been shown to possess several components of the calcium
signalling cascade, including Gαi/z., Gα12/13 , Gαs and Gαq, several of them being also found in mammalian cells;
3. Calcium signalling is one of the several signalling mechanisms triggered by PAR1 activation in mammalian cells (Figure 5). The exact mechanisms involved in the calcium response to PAR1 activation remain largely unknown , but are believed to represent new therapeutic targets for PAR-related pathologies.
19 It was therefore hypothesized that:
1. the Sf9-baculovirus system represents a valid receptor expression tool for rPAR1, a mammalian GPCR, in isolation from other mammalian receptors;
2. this exogenous protein functionally couples to the intrinsic Ca2+ signalling apparatus of Sf9 cells.
Consequently, the objectives of the study, and the associated approaches were:
1. to determine whether rPAR1 is expressed and localized on the Sf9 cell surface, using immunofluorescence, confocal microscopy and fluorescence-activated cell sorting (FACS);
2. to demonstrate that the receptor is coupled to Sf9 cells' calcium signalling, using single cell Fura-2 microspectrofluoroscopy;
3. to identify components of Sf9 cells' calcium signalling machinery involved in mammalian rPAR1 activation, using pharmacological modulators that inhibit calcium transport in the plasma membrane channels (D-600, nifedipine, lanthanum), calcium sequestration in intracellular stores (thapsigargin) and calcium efflux from intracellular stores (TMB-8), and that modulate the functions of PLCβ (D-609, an inhibitor), PKA (H-89, an inhibitor) and PKC (PDBu, an activator; bisindolylmaleimide, an inhibitor).
20
21
2.1 Construction of the recombinant baculovirus rPAR1 and virus preparation
Construction of the rat PAR1 recombinant baculovirus was prepared using the Blu-Bac (Invitrogen, Life Technologies, Burlington, ON) system for viral production. Messenger ribonucleic acid (mRNA) was purified from male Sprague Dawley rat lung tissue and transformed into single stranded complementary deoxyribonucleic acid (cDNA) by reverse transcriptase-polymerase chain reaction (RT-PCR) using oligo (dT) primers and Moloney murine leukemia virus reverse transcriptase. Primers for nested PCR were designed according to the published sequence of the rPAR1 [64]. The primers:
TTGGATCCACAATGGGGCCCCGGCGCT-3’ (bp 71-89) and
5’thrrec-TTCCAAGGTACTTCTTTTCCCATGGCC-3’ (bp 1315-1334), used for second round PCR incorporated BamHI and KpnI restriction sites at the 5’ and 3’ ends of the amplified product. Purified bacmid PCR II containing the rat PAR1 sequence obtained after transformation into
E.coli MC1061 was sequenced and subcloned into the baculovirus transfer vector pJVETL at
the BamHI/KpnI sites. Cotransfection into Sf9 cells with linearized Autographa californica nuclear polyhedrosis virus (AcMNPV) using the lipofectin reagent yielded the recombinant virus.
The recombinant virus was plaque purified through three rounds and blue plaques were selected in the presence of 5-bromo-4-chloro-3-indolyl-beta-D-galacto-pyranoside (X-Gal) and tested for the presence of occlusion virus. At each stage of plaque purification, the presence of receptor cDNA was confirmed by dot-blot analysis of infected cell lysates hybridized to a 784bp cDNA probe. Virus stocks were amplified, at 22oC, in Sf9 cells by infection of 40ml of cells at 1 x 10⁶ cells/ml for 72 hours and collected.
22 2.2 Infection procedure
The Sf9 cells were grown in shaked capped Erlenmeyer flasks (Corning, Montreal, QC) at room temperature (22oC). The growth medium, Grace’s Simplified Eagle’s Medium (Gibco BRL Life Technologies, Burlington, ON), was supplemented with 10%
heat-inactivated fetal bovine serum (FBS) (Hyclone, ThermoScientific,Menomonee Falls, WI, USA), and 0.1% pluronic acid F-68.
The cells were grown between passages 6 and 65. Immediately after each passage, densities ranged from 2 to 6x10⁵ cells/ml. They were then grown to densities between 1.5 and 3 x10⁶ cells/ml. Cell seeding for infection was performed by allowing cells to attach to the bottom of capped plastic culture flasks and further grown to cell counts in the range of 3 to 8 x10⁵ cells/ml with virus addition performed at a multiplicity of infection (MOI) of 15.
rPAR1-Sf9 cells were used for experiments between 25-48 hours following virus infection, and all assays were conducted at room temperature (22oC).
2.3 Detection of expressed receptor in cell membranes
2.3.1 Receptor–antibody cross-linking studies in rPAR1-Sf9 cells
The binding assay was performed in essentially the same manner as the cross-linking assay, although the latter required the addition of a cross-linker. Cells were prepared by growing to confluency in 6 well plates and rinsed three times with a refrigerated 0.1% bovine serum albumin (BSA)/ phosphate buffered solution (PBS), each rinsing occurring at 10 minute intervals with intermittent refrigeration. In individual centrifuge tubes, 500l of solution containing the desired concentration of ligand diluted with 0.1% BSA/PBS was added, along with rPAR1 expressing cells, and incubated on ice for three hours. The tubes were labelled in the following manner: tube 1, 30nM hot; tube 2, 200nM hot; tube 3, 1000nM hot: tube 4, 30nM hot + 6M
23
cold; tube 5, 200nM hot + 40M cold; and tube 6, 1000nM hot + 200M cold (where: ‘hot’ refers to iodine labelled PAR1-AP while ‘cold’ refers to the non-iodinated PAR1-AP) The ligand was then aspirated and the cells washed once with ice cold PBS. In the cross-linking experiment the cross-linker was added by the addition of 5mM bis (sulfosuccinimidyl) suberate (BS3) in PBS, followed by incubation and refrigeration for 5 minutes, addition of 100mM glycine, another 5 minute incubation, and rinsing twice with 2ml PBS. In all assays cell lysis was important, and was performed by the addition of a modified PBS solution made up of 1% triton X-100, 1mM ethylene-glycotetraacetic acid (EGTA) (Caledon Labs, Georgetown, Ontario, Canada), 1mM phenyl methyl sulfonyl floride, 10g/ml pepstatin (Sigma-Aldrich Chemicals, Milwaukee, WI, USA), 10g/ml leupeptin, 10g/ml antipain, 10g/ml benzamidine hydrochloride (HCl), 10g/ml soybean trypsin inhibitor, 10g/ml aprotinin.
After centrifugation for 10 minutes at 13000 revolutions per minute (rpm) and 4oC, the supernatant containing the receptor was retrieved and placed in a gamma-counter prior to
resolution on a 3-15% linear gradient sodium dodecyl sulfate polyacrylamide gel electrophoresis (SDS-PAGE) and autoradiographed.
2.3.2 Western blot membrane preparation and endoglycosidase treatment of rPAR1 Crude membranes were obtained according to the method previously described by Vouret-Craviari & al, 1995 [65] with slight modifications. Sf9 cells in culture were infected with baculovirus rPAR1 at an MOI of 15, grown for 48 hours and collected at 500 x g. Cells were rinsed twice with 10mM tris (hydroxymethyl) aminomethane (Tris), pH 7.5, 1mM EGTA before harvesting in tris (hydroxymethyl) aminomethane buffer (TB) (5mM Tris, pH 7.5) 0.5mM EDTA; 10g/ml each of the protease inhibitors leupeptin, aprotinin, pepstatin,
24
1mM PefablocR and phosphatase inhibitors 1mM orthovanadate and 50mM sodium fluoride (NaF) and incubated on ice for 5 minutes. Subsequently, cells were disrupted by sonification and nuclei were removed by centrifugation (2000 rpm for 10 minutes at 4oC). After
centrifugation, crude membranes were resuspended in the same buffer and treated with endoglycosidase F according to the New England Biolabs’ (Ipswich, MA) protocol, except that all indicated procedures were carried out at room temperature. Treated membranes were then applied onto a 7.5 % electrophoretic gel left running at 50 volts (V) for 2 hours. The separation gel was prepared for immunoblot with a solution comprised of 60ml methanol, 3ml 0.1% SDS, 909mg tris and 4.3mg glycine in a total volume of 300ml water (H2O).
Samples were separated on sodium dodecyl sulphate-polyacrylamide gel
electrophoresis (SDS-PAGE) and blotted onto Hybond-C nitrocellulose membranes. The membranes were blocked with 0.5% I-Block (Applied Biosystems distributed by Life Technologies, Burlington, ON) and 0.3% Triton X-100 (Sigma-Aldrich Chemicals,
Milwaukee, WI, USA) in PBS at 4°C and incubated for 1 hour (h) with specific antibodies (supplied by Dr. M.D. Hollenberg of the University of Calgary, Department of Medicine): anti-rPAR1 antibody (1:500 dilution), anti-mPAR2 antibody (1:500 dilution) or pre-immune serum (1:500 dilution). After a 30 minute wash, the membranes were incubated with anti-rabbit horseradish peroxidase-linked secondary antibody for 1h and washed for another 30 minutes. Immunoreactive protein signals were detected using the chemiluminescence (ECL) detection system from Amersham (distributed by GE Life Sciences, Baie d’Urfé, QC).
25
2.3.3 Immunocytochemistry, fluorescence-activated cell sorting (FACS) and confocal microscopy
FACS allows for a quantitative analysis using cell sorting and laser-activated detection in a flow cytometer system whereby a suspension of cells is held in a funnel-like chamber. The system uses hydrodynamic focusing of the suspended cells (cell sorting), around a light source typically found in the narrower portion of the chamber. The addition of a fluorescent probe (Oregon green-tagged polyclonal antibodies) to the cell suspension mixture increases the amount of fluorescence measured by the detection system located in close proximity to the light source, the scattered light, and any background fluorescent light. The fluorescence intensity is plotted as a function of cell number.
Confocal microscopy is a high resolution imaging technique in which the excitation of a fluorophore (in our experiments, Oregon-green tagged polyclonal antibodies) is ensured through laser excitation of the sample, using a xenon lamp. A confocal microscope uses the illumination of a single point of the sample and a pinhole in the emitted light pathway to measure the intensity of emitted light from a restricted field and in a narrow-thickness of sample slices. Only the light in a given spatial plane is detected at a given time within a corresponding confocal slice of about 0.2 to 0.3μm in width. Individual images of slices are obtained by scanning the sample line by line and three dimensional images are reconstructed using sequential vertical slices of the sample.
Sf9 cells infected with rPAR1-cDNA were grown for 48h using the techniques described above. Cells in suspension FACS or plated on glass coverslips (for confocal microscopy) were washed twice with PBS (three times for confocal microscopy) and fixed with fresh 3% (v/v) formaldehyde in PBS for 20 minutes. Non-specific binding sites were blocked with PBS containing 1% I-Block (PBS-I-Block) for 1h at room temperature. The cells
26
were then incubated for 1h at room temperature with anti-rPAR1 receptor antibodies or pre-immune serum diluted 1:50 in 0.5% Block. After three washings with 0.5% PBS-I-Block, cells were incubated with Oregon-green-conjugated anti-rabbit immunoglobulin (Ig) G (1:2000 dilution, 1h at room temperature), used to reveal the primary antibodies. The cells were detected using a Beckman-Coulter XL-MCL flow cytometry system (Mississauga, ON).
For confocal microscopy, rPAR1-Sf9 cells were left to adhere to 24mm circular glass coverslips for 30 minutes using the same method as that described for
microspectrofluorescence. Cell surface receptors were detected by Molecular Dynamics CLSM 2001 confocal microscope with inverted Nikon Diaphot fluorescent microscope (Amersham Biosciences, Sunnyvale, CA, USA) using techniques previously described [66-68].
2.4 Functional assays 2.4.1 Solutions
Measurements of calcium transients were conducted in one of three experimental media: 2.8 Grace simplified medium (GSM), 6.8GSM, or 0GSM. The media were composed of either 2.8mM or 6.8mM CaCl2, 2 H2O or 2mM EGTA, 54.6mM KCl, 11.4mM MgCl2 X 6 H2O, 11.3mM MgSO4 X 7 H2O, 11.2mM NaCl, 7.14mM dipotassium salt, 2.86mM PIPES-acid, 3.9mM D-glucose and adjusted to 340-380mOsm with sucrose, and a pH=6.4 with KOH.
All peptidomimetic compounds were prepared in distilled and deionized H2O to a stock concentration of 5mM and subsequently diluted to a final volume of 500l in the experimental solution.
27
2.4.2 Preparation and use of agonists and signal modulators
Octopamine was used as a 5mM stock solution in H2O. Experiments were conducted using 20l of stock solution in 480l of 2.8 or 0GSM.
Aliquots of thrombin were prepared using thrombin from human plasma (Sigma-Aldrich Chemicals, Milwaukee, WI, USA) diluted in H2O to produce a stock solution of 250U/ml. Experiments were also conducted using 20l of stock solution with 480l of 2.8 or 0GSM. PAR1-AP was provided by the Peptide Synthesis Facility at BioChem Therapeutics (Laval, Quebec) as lyophylized powder. A 2mM stock solution was prepared using 20% EtOH / 20% DMSO / 60% H2O. Experiments were conducted using 50l of stock solution in 450l of 2.8 or 0GSM, to a final, supra-maximal dose of 100M.
A solution of 5mM La3+ was prepared using 50ml H2O and 1.021g LaCl3 (Calbiochem, La Jolla, CA, USA) to produce a stock solution of 55mM. Experiments were conducted using 50l LaCl3 solution in 500l of 2.8GSM.
Stock solutions for 3,4,5-trimethoxybenzoic acid 8-(diethylamino)octyl ester (TMB-8) (Alomone Labs, Jerusalem, Israel) as well as N-[2-[[3-(4-bromophenyl)-2-propenyl]amino] ethyl]-5-1 isoquinolinesulfonamide (H-89) (Sigma-Aldrich Chemicals, Milwaukee, WI, USA) and were prepared using H2O and tricyclodecan-9-yl xanthogenate (D-609) (Alomone Labs, Jerusalem, Israel),phorbol 12,13 dibutyrate (PDBu) (Sigma-Aldrich Chemicals, Milwaukee, WI, USA) and bisindolylmaleimide (Sigma-Aldrich Chemicals, Milwaukee, WI, USA) were prepared using DMSO (Sigma-Aldrich Chemicals, Milwaukee, WI, USA) in a manner similar to La3+.
28
Nifedipine (Calbiochem, La Jolla, CA, USA) and methoxyverapamil (D-600)
(Calbiochem, La Jolla, CA, USA) were diluted in DMSO to obtain stock solutions of 0.5mM and 5mM, respectively. Serial dilution of 20l of stock solution in 230l of GSM was performed and subsequently added to the experimental chamber which contained a starting volume of 250l, for a total final volume of 500l.
A stock solution of 50M thapsigargin (Alomone Labs, Jerusalem, Israel), was also prepared using DMSO, and cells were bathed with 50M thapsigargin in 500l 0GSM for 5 minutes prior to the addition of 100M PAR1-AP.
2.4.3 Microspectrofluorescence
Functional coupling of rPAR1 in the rPAR1-Sf9 cells was studied using a Photon Technology International’s DeltaRam/microscope (PTI) photometer system. A xenon lamp was used as a light source, and emitting light at alternating wavelengths of 340 and 380 nanometres (nm), directed via a 40x epifluorescence objective, at the Sf9 cells plated on coverslips and loaded with Fura-2 (Molecular Probes, Eugene, Oregon). The fluorescent probe Fura-2
fluoresces in response to this excitation, with the amount of light being a function of the [Ca2+]i . The emitted fluorescence is captured through a 505nm emission filter by a photon-counting detector connected to a computer.
Fura-2 cell loading was realized by using the Fura-2 AM fluorophore (Molecular Probes, Eugene, Oregon), a cell permeant compound. Fura-2 AM is hydrolyzed by intracellular esterases to form Fura-2 which remains trapped in the cells. Upon binding to Ca2+, the excitation spectra of 2 undergoes a shift in fluorescence to lower wavelength. This spectral property of Fura-2 was used for high-sensitivity determination of intracellular Ca2+ concentration. Using the ratio
29
of Fura-2 intensities from cells excited at 340nm and 380nm provides higher dynamic range and makes the measurements largely independent of volume change artefacts. Therefore,
fluorescence ratio versus time was used to determine the cellular response in the functional assays. The procedure to obtain intracellular calcium concentration from fluorescence intensities and ratios is described in Appendix 1.
Between 25 and 48 hours post infection, 500 μl of cells were plated onto 24mm circular glass slides and left to adhere for 30 minutes. Once attached, the cells were rinsed twice with 6.8GSM. Cells were then loaded with the Ca2+-insensitive Fura-2 AM and washed three times following 30 minutes of incubation at room temperature.
Fura-2 measurements were performed on single cells that were optically isolated under microscopic observation by means of an adjustable rectangular aperture located in the emission path of the microspectrofluorometer.
Results are presented as normalized ratio, with baseline [Ca2+]i levels adjusted to ratio level 1, for simplicity sake.Fluorescence ratios were normalized according to the following transformation:
(F340/F380)/(F340/F380)t=0
Glass coverslips were then mounted in a custom-made experimental chamber containing a final volume of 1ml of 2.8GSM or 0GSM.
30
31
3.1 Sf9-baculovirus expression system of rPAR1 receptor 3.1.1 Successful expression of rPAR1
In order to establish the successful expression of rPAR1 using the Sf9-baculovirus expression system, assays were initially conducted as described in the Materials and Methods (section 2.3).
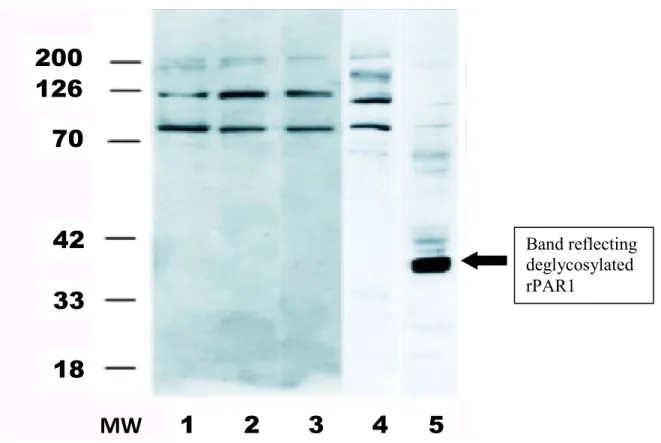
To evaluate protein expression of rPAR1 in rPAR1-cDNA-containing baculovirus infected Sf9 cells (rPAR1-Sf9), western blots were performed as shown in Figure 6. Western blot analysis uses gel electrophoresis to separate proteins by molecular weight. Smaller proteins migrate more quickly through the polyacrylamide gel while larger proteins migrate more slowly. The anti-PAR1 antibody recognized a band in membranes obtained from Sf9 insect cells infected with ratPAR1-cDNA containing baculovirus, as shown in Figure 6, lane 5. The band seen with the anti-rPAR1 antibody was specific to rPAR1 since it was absent in the non-infected Sf9 cells (lane 4) and the pre-immune serum (lanes 1-3).
Given that potential sites for N-linked glycosylations are present on rPAR1, freshly prepared membranes from rPAR1-Sf9 or Sf9 wild type were treated with N-glycosidase F to remove all asparagine-linked carbohydrates from the protein. The deglycosylation resulted in a decrease in the apparent molecular mass for rPAR1 to approximately 40kDa. This is
consistent with the literature which indicates that while the mature receptor has a molecular mass ranging from 68 to 80 kDa, N-linked glycosylations represent 32-40 kDa [65].
Anti-rPAR1 antibodies (supplied by Dr. M.D. Hollenberg of the University of Calgary, Department of Medicine) were used to perform western blot analysis.
Binding and cross-linking studies were attempted using radioiodinated peptides in order to confirm the binding specificity of the PAR1-AP. A total of three attempts failed to be
32
successful, and it was later discovered that the antibody iodination process had been unsuccessful and further cross-linking studies were not attempted. However, various other assays were used to determine successful receptor expression.
MW
1 2 3 4 5
200
126
70
42
33
18
Figure 6: Western blot analysis of rPAR1 infected Sf9 cells. MW: molecular weight markers (kDa). Lanes 1-3: pre-immune serum in non-infected Sf9 (lane 1), rPAR1 infected Sf9 (lane 2), and mPAR2 infected Sf9 (lane 3). Lanes 4 and 5: anti-rPAR1 antibody: non-infected Sf9 cells (lane 4), rPAR1 non-infected Sf9 cells (lane 5).
3.1.2 Localization of the rPAR1 receptor expressed in Sf9 cells 3.1.2.1 Receptor localization using FACS
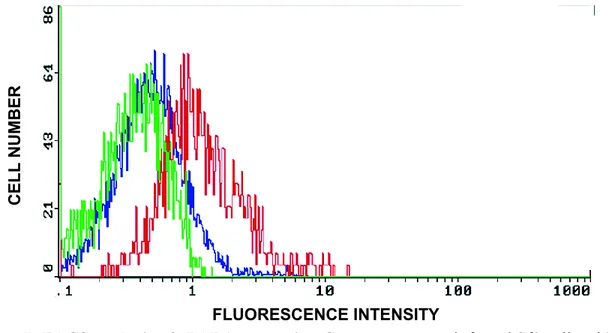
Assays were performed using immunocytochemistry techniques to determine whether translocation of the protein to the cell surface had been successful. The first of these were conducted using FACS. Results are shown in Figure 7. The baseline level of scattering and
Band reflecting deglycosylated rPAR1
33
emission of light by the rPAR1 infected Sf9 cells is shown in green (control). This control contains neither preimmune serum nor tagged-antibody. The blue line depicts the
fluorescence measured in rPAR1-Sf9 cells which have been treated with preimmune serum (serum-control). Results are virtually superimposed, with fluorescence being only slightly affected by the incubation with pre-immune serum, which may mainly be due to
autofluorescence of serum proteins. As shown by the red curve, the rPAR1-Sf9 cells treated with anti-rPAR1 tagged antibodies emitted a higher level of intensity due to the cell-surface linked fluorescent probes, demonstrating the successful expression of the rPAR1 on the cell plasma membranes of infected Sf9 cells (Figure 7).
Figure 7: FACS analysis of rPAR1 expression Green curve: non-infected Sf9 cells with no preimmune serum and without tagged antibodies. Blue curve: rPAR1-infected Sf9 cells with preimmune serum. Red curve: rPAR1-infected Sf9 cells with anti-rPAR1-antibody. The shift to the right of the curve indicates linking of fluorescent-tagged secondary antibodies. Samples were made of 100 cells each.
3.1.2.2 Receptor localization using confocal microscopy
Confocal microscopy was also used to establish successful rPAR1 expression and to find out where the receptor was localized. As shown in Figure 8, confocal images using
C E LL N U M B E R FLUORESCENCE INTENSITY
34
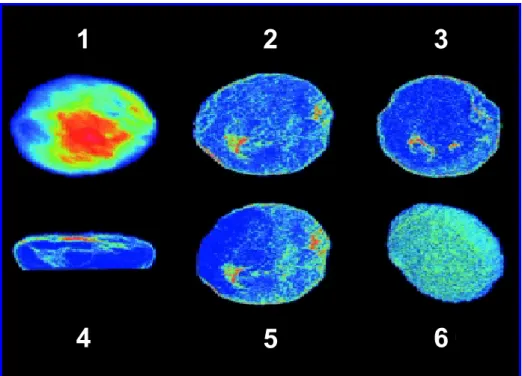
Oregon-green tagged polyclonal antibodies demonstrated that the rPAR1 receptors were expressed and translocated mainly onto the surface of rPAR1-Sf9 cells (Figure 8 images 4 and 6). The results showed also that some receptors were located in the cytoplasmic space (Figure 8 images 2, 3 and 5), representing either a mature or a functional receptor pool, or both, or were simply reflective of receptor cycling.
Figure 8: Different views of confocal micrographs of a single Sf9 cell expressing rPAR1. 1: top view of the cell. 2, 3 and 5: view of individual cell slices showing fluorescent receptors concentrated along the periphery of the cell as well as areas of increased receptor density in the cytoplasmic space (in green) . 4: vertical view of the cell, clearly demonstrating the location of the rPAR1 along the cell surface. 6: bottom surface of the cell (closest to the glass coverslip) showing dense localization of the fluorescent receptors on the cell surface.
3.2 Changes in [Ca2+]i concentration using octopamine
Control experiments were conducted to establish that [Ca2+]i changes could be observed in wild-type and infected Sf9 cells in response to the endogenous agonist
octopamine [69]. Wild-type Sf9 cells are known to respond to octopamine as the activation of
1
2
3
35
the cell-surface receptors yields intracellular Ca2+ signals detected using Fura-2 [70].
Therefore, the octopamine test was used to ensure the physiological competence of wild-type and baculovirus-infected Sf9 cells used in the present work.
Figure 9 (green trace) shows the [Ca2+]i of a single wild-type Sf9 cell following the addition of 100 M octopamine in the absence of external calcium (0GSM). As expected, 100 M octopamine induced a surge in [Ca2+]
i. In the calcium-containing experimental medium (2.8GSM), the initial [Ca2+]i surge was followed by a second phase consisting of a longer-lasting plateau (Figure 9, violet trace). Initial studies suggested that the octopamine response may point to an influx of Ca2+ [70], and subsequent studies supported the findings that this second phase of the octopamine response was likely a calcium influx through Ca2+ channels of the cell membrane [69].
Figure 9: Effect of octopamine on cytosolic calcium in wild-type Sf9 cells.
Sf9 cells were stimulated by the addition of 100 M octopamine (as indicated by the arrow) in the presence of extracellular Ca2+ (violet trace) or in the absence of extracellular Ca2+ (green trace). Data reported is representative of three identical experiments.
time (seconds) 0 50 100 150 200 250 300 350 Ratio reflecti ng [Ca 2+] i 0 1 2 3 _____octopamine in 2.8GSM ______ octopamine in 0GSM Time (s) Rat io ref lect ing [Ca 2+] i 3 2 1 0 0 100 200 300
36
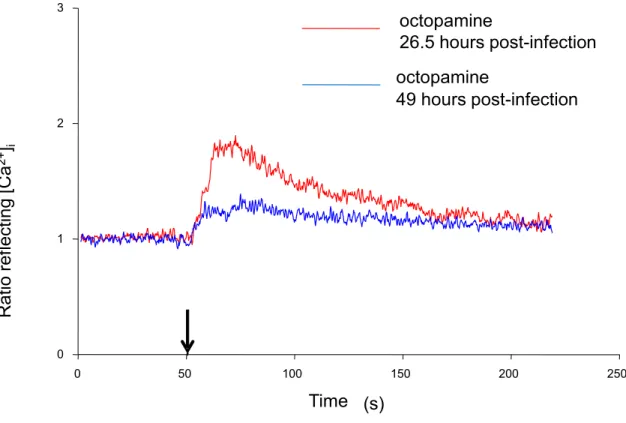
The octopamine test was used in infected cells to determine whether the pathogen would ultimately affect the Sf9’s functionality and to determine the optimal time window to be used for the functional assays of rPAR1expressed in the cells. Although biphasic responses were generally recorded, a significantly reduced competency of the cells was observed after prolonged viral exposure (Figure 10). These experiments demonstrated also that the
octopamine receptors remained functional in rPAR1 expressing cells.
time (seconds) 0 50 100 150 200 250 Rat io ref lect ing [Ca 2+] i 0 1 2 3 Time (s) octopamine 26.5 hours post-infection octopamine 49 hours post-infection
Figure 10: Effect of infection time on intracellular Ca2+ concentration change in response to octopamine in baculovirus-Sf9 cells. The experiment was conducted in the presence of extracellular Ca2+. Each trace represents the response of a single Sf9 cell to the addition of 100 M octopamine at t=50 seconds. Red trace: calcium transient in cell 26.5 hours post infection. Blue trace: calcium transient in cell 49 hours post infection. Data shown is representative of three identical experiments.
The Sf9-baculovirus system was shown to express significant levels of exogenous viral proteins as early as 22 hours following infection [60] and could be detected as far as 60 hours
![Table 1: Summary of qualitative changes in Fura-2 fluorescence ratio reflecting [Ca 2+ ] i](https://thumb-eu.123doks.com/thumbv2/123doknet/2067892.6415/52.918.120.803.413.754/table-summary-qualitative-changes-fura-fluorescence-ratio-reflecting.webp)
