1
MIF Program
Research Paper
Do Mergers and Acquisitions Transactions Create Value
for Shareholders?
A Theoretical and Empirical Approach on Value Creation in
Cross-Border Mergers and Acquisitions Transactions in the
Consumer Goods Industry
Tobias Tietz
Under the Supervision of
Professor Patrick Legland
2 Abstract
This study examines the nature of wealth changes in cross-border M&A transactions in the consumer goods industry as well as the sources of gains and losses in these transactions in the light of different underlying motives: synergy, managerialism and hubris. Concerning overall value creation it was found that on average total gains are positive for all transactions and that significant positive gains accrue to target shareholders. Moreover, it was found that the results are in line with the author’s expectations, that multiple sources of value creation exist in cross-border M&A with positive total gains: financial diversification, market seeking and bank governance systems. However, for negative total gains transactions, no statistically significant results could be found. The results provided by this study reinforce the importance of considering different behavioral assumptions in empirical research for value creation in M&A and cross-border M&A.
Acknowledgments:
I would like to express my sincere gratitude to Professor Patrick Legland for accepting the supervision of my thesis and for his continued support and guidance that have made this thesis possible. Moreover, I would like to thank all HEC staff that have helped with the administration and all communication related activities for the mater thesis. I would like to thank especially the library staff, since they helped me to gain access to crucial data sources without which I would not have been able to conduct my analysis.
3
Table of Contents
List of Abbreviations ... 5 List of Figures ... 6 List of Tables ... 7 List of Variables ... 8 I. Introduction ... 9 I.1 Background ... 9I.2 Problem Discussion and Thesis Outline ... 10
II. Theoretical Background on Mergers and Acquisitions ... 10
II.1 Creating Value in Mergers and Acquisitions ... 10
II.1.1 Definitions ... 10
II.1.2 Shareholder Value Creation in Mergers and Acquisitions ... 11
II.1.3 The Impact of Market Efficiency on Shareholder Wealth Creation ... 12
II.1.4 Measuring Value Creation through Cumulative Abnormal Returns (CAR) ... 13
II.2 Cross-Border Mergers and Acquisitions ... 14
II.2.1 Value Creation in Cross-Border Mergers ... 14
II.2.2 Developments in the Consumer Goods Industry ... 15
II.3 Rationales for Mergers and Acquisitions in a Cross-Border Context ... 17
II.3.1 Synergies as Strategic Rationale for Mergers and Acquisitions ... 17
II.3.2 Managerialism Hypothesis as Rationale for Mergers and Acquisitions ... 20
II.3.3 Hubris Hypothesis as Rationale for Mergers and Acquisitions ... 21
III. Empirical Analysis and Predictions ... 22
III.1 Hypotheses ... 22
III.1.1 The Relationship between Target and Acquirer Gains to Total Gains ... 22
III.1.2 The Explanation of Total Gains through a Linear Regression ... 26
IV. Methodology ... 28
IV.1 Sample and Data ... 28
IV.2 Event Study Methodology ... 29
IV.3 Regressions ... 36
IV.3.1 Regression Model for the Relationship between Target and Acquirer Gains ... 36
IV.3.2 Explanation of Variables ... 37
IV.3.3 Regression Model ... 40
V. Findings and Analysis ... 42
V.1 Cumulative abnormal Returns and Total Gains ... 42
4
V.3 Analysis of Hypotheses ... 45
V.3.1 Analysis of Hypotheses concerning the Relationship between Target and Acquirer Gains to Total Gains ... 45
V.3.2 Analysis of Hypotheses concerning the Relationship between Total Gains and the independent Variables ... 48
VI. Conclusion and Implications for Future Research ... 54
VI.1 Conclusion ... 54
VI.2 Implications for Future Research ... 55
VII. Publication bibliography ... 57
VIII. Appendix ... 64
VIII.1 Deal Overview ... 64
VIII.2 Regressions ... 65
5
List of Abbreviations
CAR Cumulative Abnormal Returns DSC Dollar Shave Club e.g. for example, from Latin exempli gratia et al. and others, from latin (et alii) GDP Gross Domestic Product i.e. that is, from Latin id est M&A Mergers and Acquisitions NAV Net Asset Value OLS Ordinary Least Squares UK United Kingdom USA United States of America VIF Variance of Inflation
6
List of Figures
Figure 1: Illustration for development of M&A industry taken from
https://publishing.dealogic.com/ib/DealogicGlobalMAReviewFullYear2016FINALMEDIA.p df
Figure 2: Illustration for development of cross-border M&A taken from http://crossbordermaindex.bakermckenzie.com/fmcg-q4-2016
Figure 3: Illustration of average abnormal returns to target shareholders in %
Figure 4: Illustration of average abnormal returns to acquirer shareholders in %
Figure 5: Illustration of average cumulative abnormal returns to both target and acquirer shareholders
7
List of Tables
Table 1: Summary of studies concerning value creation in M&A (studies with significant results are highlighted)
Table 2: Summary of Studies concerning Value Creation in Cross-Border M&A (Studies using Abnormal Returns and CAR are displayed)
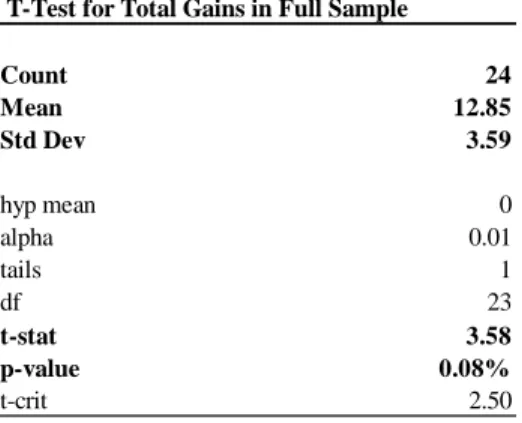
Table 3: Illustration of the t-test for the variable %TOTGAIN in the full sample Table 4: Illustration for the binomial tests for the number of positive transactions
Table 5: Illustration of descriptive statistics for the sample of transactions
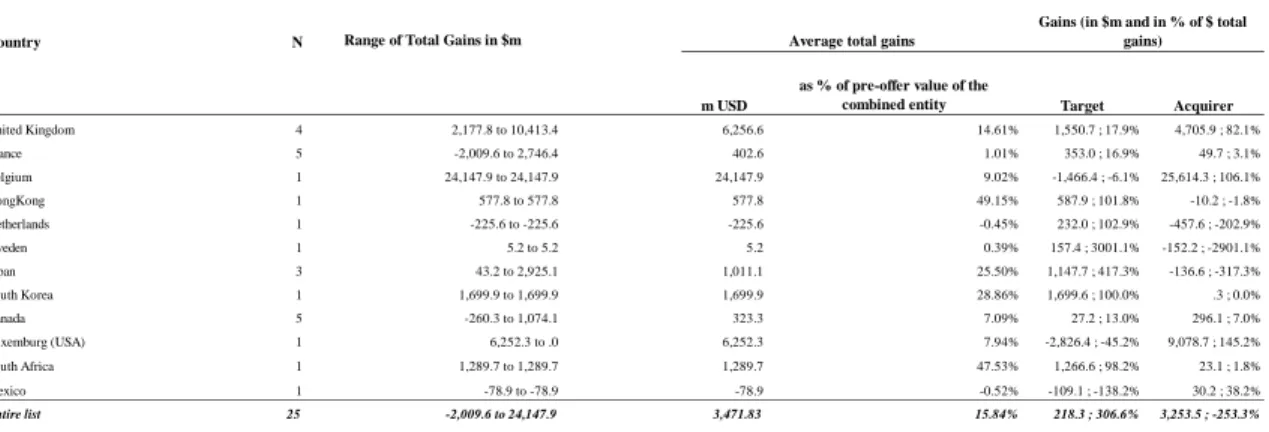
Table 6: Total Gains of the Combined Firm and Value Creation for Acquirers and Targets for each Country
Table 7: Illustration of the t-test for the variable %TOTGAIN in the full sample for target gains
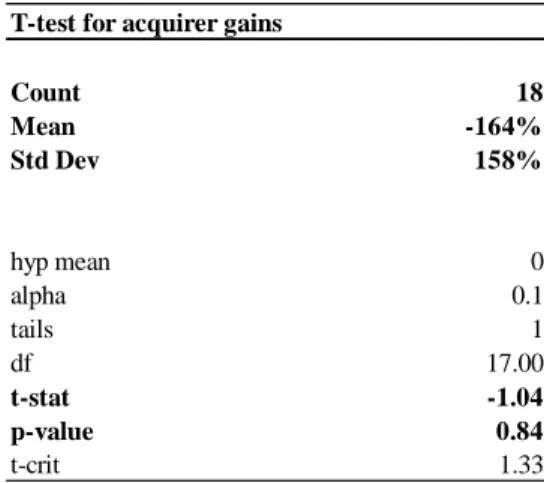
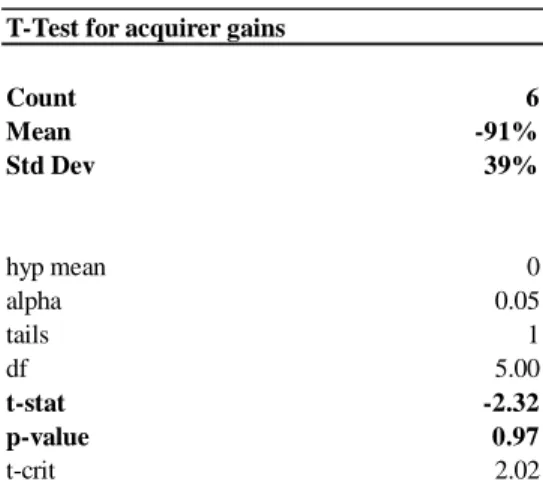
Table 8: Illustration of the t-test for the variable %TOTGAIN in the full sample for acquirer gains
Table 9: Illustration of the t-test for the variable %TOTGAIN in the sample with positive gains for target gains
Table 10: Illustration of the t-test for the variable %TOTGAIN in the sample with positive gains for acquirer gains
Table 11: Illustration of the t-test for the variable %TOTGAIN in the sample with negative gains for target gains
Table 12: Illustration of the t-test for the variable %TOTGAIN in the sample with negative gains for acquirer gains
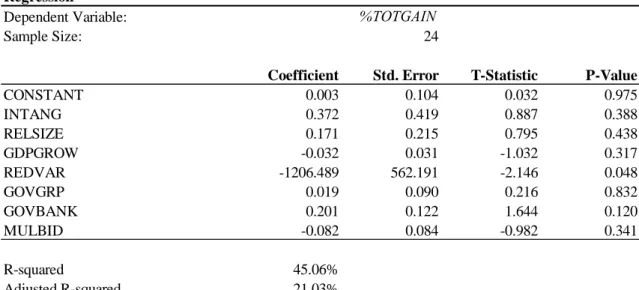
Table 13: Ouput for OLS Linear Regression for %TOTGAIN Variable for the full sample Table 14: Ouput for OLS Linear Regression for CARBID Variable for the full sample
Table 15: Correlation matrix for Independent Variables
Table 16: Output for OLS Linear Regression for %TOTGAIN in Synergy Sample Table 17: Output for OLS Linear Regression for CARBID in Synergy Sample
8
List of Variables
%TOTGAIN Total gains for both target and acquirer shareholders around the
announcement of the transaction
CARBID Gains accruing to acquirer shareholders around the announcement of
the transaction
INTANG Variable describing the reverse internalization benefits from a
transaction
RELSIZE Variable describing the economies of scale and economies of scope
benefits arising from a transaction
RELGDP Variable describing the relation between the GDP-growth rates of the
acquirer’s country and the United States or Canada
GDPGROW Variable derived from the variable RELGDP capturing the market
seeking motives of the acquirer
REDVAR Variable capturing the financial diversification benefits arising from the
transaction
GOVMKT Dependent dummy variable describing countries with
“market-systems”
GOVGRP Independent dummy variable describing countries with
“group-systems”
9
I. Introduction
I.1
Background
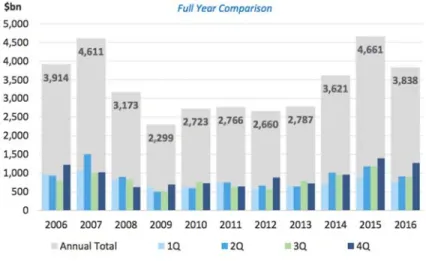
Since the beginning of the financial crisis in 2008, the M&A industry suffered a downturn, which can be partially explained through managerial risk aversion in uncertain times and the sheer unavailability of sufficient debt financing. In the years following this crisis, however, M&A activity has been restored to pre-crisis levels culminating in 2015 with a total volume of 4,661 billion USD.
Figure 1: Yearly and quarterly overview of global M&A activity from 2006 to 20161(Roopray)
In this environment, especially the consumer goods industry has experienced a trend of consolidation. Due to the liberalization of foreign investments and the ever-present subject of globalization, a large percentage of these transactions occurs on a cross-border or global basis. This development was explained by industry experts in response to fast-changing consumer preferences and the inability of large corporations to respond in time through organic growth in their own markets. While the motives for M&A are numerous the overarching question remains if such transactions result in any value creation for shareholders of both target and acquirer companies in such transactions. This very issue has been debated extensively in the business world as well as in academia over the past decades. However, barely any empirical analysis of shareholder value creation in cross-border consumer goods M&A has been undertaken so far. Hence, this study will add to existing literature and attempt to provide insight into the shareholder value creating effects of M&A transactions.
10
I.2
Problem Discussion and Thesis Outline
Do cross-border M&A transactions create value in the consumer goods industry? This question of wealth effects through M&A activity has been discussed heavily in the past as indicated above. So far, however, no general consensus among researchers has been reached.
One can distinguish between mainly three different types of questions when considering M&A transactions. The fist concerns the motive of such activity. The second and third ask if value is created for target and/or acquirer shareholders respectively (Seth et al. 2002, p.923). Since existing literature is divided concerning the answers to these questions, this study will try to provide insight into the value creating effects of M&A in the consumer goods industry based on an analysis of recent transactions.
After discussing past literature and evidence on the subject, the author will evaluate the motives for M&A empirically as well as the wealth effects for target and acquirer shareholders and the company as a whole. The United States and Canada were chosen as target markets, as they have displayed the highest volume in M&A activity over the recent years and thus this study expects them to be suitable to assess the question of value creation for target and acquirer shareholders.
II. Theoretical Background on Mergers and Acquisitions
II.1 Creating Value in Mergers and Acquisitions
II.1.1 Definitions
Existing literature provides several definitions for the term mergers and acquisition. Sudarsanam (2010), for instance, argues that a combination of businesses can be referred to as either a “merger” or an “acquisition (Sudarsanam 2010, p.21). A more detailed explanation is provided by the wording of the International Accounting Standards, IAS 22. It refers to mergers as “uniting of interests” and to acquisitions as a “purchase”. An acquisition is defined as “a business combination in which one of the enterprises, the acquirer, obtains control over the net assets and operations of another enterprise, the acquiree, in exchange for the transfer of assets, incurrence of a liability or issue of equity” (Deloitte). A merger is defined as “as a business combination in which the shareholders of the combining enterprises combine control over the whole, or effectively the whole, of their net assets and operations to achieve a continuing mutual sharing in the risks and benefits attaching to the combine entity such that neither party can be identified as the acquirer. Also called a pooling of interests” (Deloitte).
11
A merger transaction involves corporations that join forces in order to achieve shared objectives. As far as shareholders are concerned, they often remain shareholders of the newly established combined entity and sustain their interest in the company. Since none of the parties can be identified as an acquirer, such a transaction is often referred to as a “merger-of-equals” (Sudarsanam 2010, p.3).
In an acquisition, on the other hand, one firm purchases the assets of the other using several possible means such as cash, shares or a combination of the two. Contrary to a merger, the acquired firm becomes a subsidiary of the acquirer, and the shareholders (of the acquired company) cease to have an interest in the company post-acquisition (as long as they are solely paid in cash). Commonly, an acquisition is often described as a takeover, since one of the parties involved is usually the dominant player.
Mergers are usually categorized as horizontal, vertical or conglomerate (Gaughan 2007, p.13). A merger is horizontal when two competitors combine as they are on the same level of the supply chain. Vertical mergers, on the other hand, occur when two companies come together that have a buyer-seller-relationship and are at different levers within the same value chain. A conglomerate merger takes place when the companies involved are not competitors and do not have a buyer-seller relationship (Gaughan 2007, p.13).
II.1.2 Shareholder Value Creation in Mergers and Acquisitions
One of the most fundamental questions in M&A is how and for whom value is created through transactions. This discussion often involves shareholders and other stakeholders opposing each other in terms of who management should create value for first in the combined entity post-acquisition.
According to finance theory, shareholder wealth maximization is the supreme goal of the corporate investment and financing decisions (Sudarsanam 2010, p.52). It has been shown by Koller et al. (2015) that companies, that are dedicated to value creation are healthier and more robust – and that investing for sustainable growth builds stronger economies and higher living standards (Koller et al. 2015, p.6). The legal frameworks for the jurisdictions of the acquiring countries all indicate a fiduciary duty of directors to act in the best interest of the shareholders. Pursuing shareholder value creation, however, does not necessarily imply that no value is created for other stakeholders (Koller et al. 2015, p.7). Koller et al. name employees as an example for possible stakeholders. A company trying to boost profits by providing a subpar work environment, by underpaying employees, or by skimping on benefits will have trouble
12
attracting and retaining high-quality employees. (Koller et al. 2015, p.7). This will lead to a higher staff churn rate and consequently higher recruiting as well as training costs. The same logic applies to most stakeholders that are affected by the board of directors’ decisions. Consequently, if managers want to create value for shareholders in the long term, they must consider the effects of their decisions on stakeholder wealth as well.
II.1.3 The Impact of Market Efficiency on Shareholder Wealth Creation
Previous studies have typically evaluated shareholder wealth creation through the application of the event-study methodology. Tuch and O’Sullivan (2007) have shown that research varies regarding the length of the event window (Tuch, O'Sullivan 2007, p.144). This lack of consensus concerning event windows has its roots in the question of at what point in time all deal information is reflected in the respective stock prices. That is because capturing the changes in stock prices induced by a transaction is essential to the evaluation of shareholder value creation. When and how information is reflected in the stock prices is dependent on the form of efficiency the market is assumed to show.
The efficient-market hypothesis has been a topic of heated debate for the last decades. This theory claims that all information is reflected in the prices of securities. Consequently, the only mean to get a higher return is to take on more risk. This theory was first introduced by Fama in 1969, who introduces three different forms of market efficiency: (1) weak-form efficiency, (2) semi-strong form efficiency and (3) strong-form efficiency.
Under the weak-form efficiency it is assumed that current stock prices reflect all information contained in past prices. Consequently, under this form of efficiency, one should not be able to generate profits through technical analysis.
Under the semi-strong form efficiency, current prices reflect all information contained in past prices as well as all publicly available information. In this case, the stock price will adjust immediately to newly available public information such as the announcement of a transaction.
Finally, under the strong-form efficiency, current prices reflect all past information and all publicly available as well as private information. Here, not even insiders should be able to generate an abnormal return, since private information is already contained in the stock price. Moreover, the stock price should not be affected on the announcement date, since the announcement is already expected and thus already incorporated in the stock price.
13
Existing studies have assumed the semi-strong form efficiency for their event studies, indicating that share prices react in a timely and unbiased manner to new information and that the size of the gains reflects the value of the firm in forthcoming periods (Tuch, O'Sullivan 2007, p.142-143). Following this generally accepted assumption, this study will also assume the semi-strong form efficiency.
II.1.4 Measuring Value Creation through Cumulative Abnormal Returns (CAR)
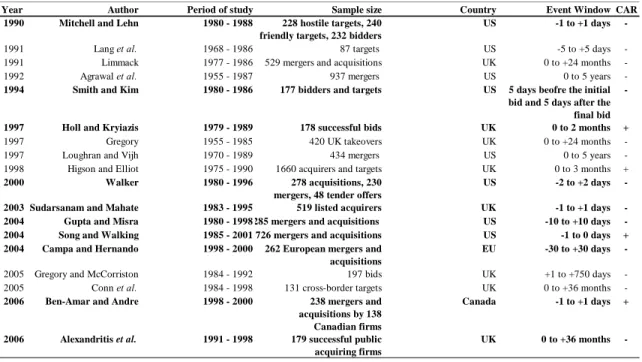
Existing studies on the topic of value creation in M&A measured through cumulative abnormal returns vary in both research method and results. A summary of the most important studies and their findings can be found in the table below.
Table 1: Summary of studies2concerning value creation in M&A (studies with significant results are highlighted)
As can be seen from the table above, the majority of studies has been conducted on the UK or US market and find mostly negative returns. Moreover, this summary illustrates the range of event windows used, indicating that there is no consensus among scholars regarding which time frame to apply. The dispersion of both significant and insignificant negative or positive results contribute to this lack of consensus. Thus, one cannot identify a clear trend in past literature concerning value creation measured through cumulative abnormal returns.
2
This table was taken from Tuch and O’Sullivan (2007) and includes studies from 1990 onwards, namely: Mitchell, Lehn 1990; Lang et al. 1991; Limmack 1991; Agrawal et al. 1992; Smith, Kim 1994; Holl, Kyriazis 1997; Gregory 1997; Loughran, Vijh 1997; Higson, Elliott 1998; Walker 2000; Sudarsanam, Mahate* 2003; Gupta, Misra 2004; Song, Walking 2004; Campa, Hernando 2004; Gregory, McCorriston 2005; Conn et al. 2005; Ben-Amar, Andre 2006; Antoniou et al. 2006, 2006
Year Author Period of study Sample size Country Event Window CAR
1990 Mitchell and Lehn 1980 - 1988 228 hostile targets, 240 friendly targets, 232 bidders
US -1 to +1 days
-1991 Lang et al. 1968 - 1986 87 targets US -5 to +5 days -1991 Limmack 1977 - 1986 529 mergers and acquisitions UK 0 to +24 months -1992 Agrawal et al. 1955 - 1987 937 mergers US 0 to 5 years
-1994 Smith and Kim 1980 - 1986 177 bidders and targets US 5 days beofre the initial bid and 5 days after the final bid
-1997 Holl and Kryiazis 1979 - 1989 178 successful bids UK 0 to 2 months +
1997 Gregory 1955 - 1985 420 UK takeovers UK 0 to +24 months -1997 Loughran and Vijh 1970 - 1989 434 mergers US 0 to 5 years -1998 Higson and Elliot 1975 - 1990 1660 acquirers and targets UK 0 to 3 months +
2000 Walker 1980 - 1996 278 acquisitions, 230 mergers, 48 tender offers
US -2 to +2 days
-2003 Sudarsanam and Mahate 1983 - 1995 519 listed acquirers UK -1 to +1 days -2004 Gupta and Misra 1980 - 1998285 mergers and acquisitions US -10 to +10 days -2004 Song and Walking 1985 - 20015726 mergers and acquisitions US -1 to 0 days + 2004 Campa and Hernando 1998 - 2000 262 European mergers and
acquisitions
EU -30 to +30 days
-2005 Gregory and McCorriston 1984 - 1992 197 bids UK +1 to +750 days -2005 Conn et al. 1984 - 1998 131 cross-border targets UK 0 to +36 months
-2006 Ben-Amar and Andre 1998 - 2000 238 mergers and acquisitions by 138 Canadian firms
Canada -1 to +1 days +
2006 Alexandritis et al. 1991 - 1998 179 successful public acquiring firms
-14
II.2 Cross-Border Mergers and Acquisitions
II.2.1 Value Creation in Cross-Border Mergers
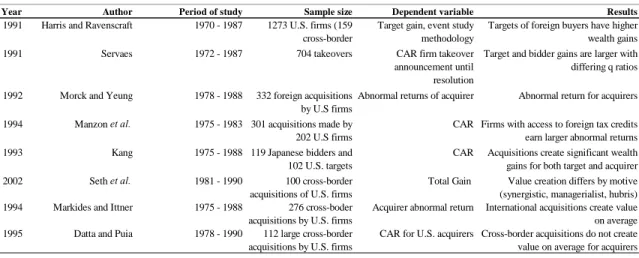
The theory for positive returns from cross-border M&A follows the assumption that firms seek to enter foreign markets, to exploit its firm-specific resources in international markets by taking advantage of market imperfections (Shimizu et al. 2004, p.336). Existing literature states that cross-border M&A provide the benefits of internalization, risk diversification and synergy - therefore creating value for both the target and acquirer (Kang 1993, p.369; Morck, Yeung 1991, p.185; Markides, Ittner 1994, p.360). Regarding the tools to measure value creation however, a large variety of approaches can be found. The table below provides a summary of existing literature concerning the value creation in cross-border M&A.
Table 2: Summary3 of studies concerning value creation in cross-border M&A (studies using abnormal returns and CAR are
displayed)
The question of value creation in cross-border M&A has been covered extensively by existing literature. The preferred methodology for assessing wealth increases has been the event study methodology, which computes cumulative abnormal returns to both target and acquirer shareholders around a specified date using stock price data. This paper will therefore also employ this approach.
In contrast to studies concerning regular M&A (Tuch and O’Sullivan (2007)), these studies find largely positive gains to both target shareholders and acquirers shareholders, indicating that cross-border M&A has a higher potential for value creation over domestic M&A.
3This table was taken from Shimizu et al. 2004 and contains results from the following studies: Harris, Ravenscraft 1991; Servaes 1991;
Morck, Yeung 1991; Manzon et al. 1994; Kang 1993; Seth et al. 2002; Markides, Ittner 1994; Datta et al. 2013
Year Author Period of study Sample size Dependent variable Results
1991 Harris and Ravenscraft 1970 - 1987 1273 U.S. firms (159 cross-border
Target gain, event study methodology
Targets of foreign buyers have higher wealth gains 1991 Servaes 1972 - 1987 704 takeovers CAR firm takeover
announcement until resolution
Target and bidder gains are larger with differing q ratios 1992 Morck and Yeung 1978 - 1988 332 foreign acquisitions
by U.S firms
Abnormal returns of acquirer Abnormal return for acquirers 1994 Manzon et al. 1975 - 1983 301 acquisitions made by
202 U.S firms
CAR Firms with access to foreign tax credits earn larger abnormal returns 1993 Kang 1975 - 1988 119 Japanese bidders and
102 U.S. targets
CAR Acquisitions create significant wealth gains for both target and acquirer 2002 Seth et al. 1981 - 1990 100 cross-border
acquisitions of U.S. firms
Total Gain Value creation differs by motive (synergistic, managerialist, hubris) 1994 Markides and Ittner 1975 - 1988 276 cross-boder
acquisitions by U.S. firms
Acquirer abnormal return International acquisitions create value on average 1995 Datta and Puia 1978 - 1990 112 large cross-border
acquisitions by U.S. firms
CAR for U.S. acquirers Cross-border acquisitions do not create value on average for acquirers
15
II.2.2 Developments in the Consumer Goods Industry
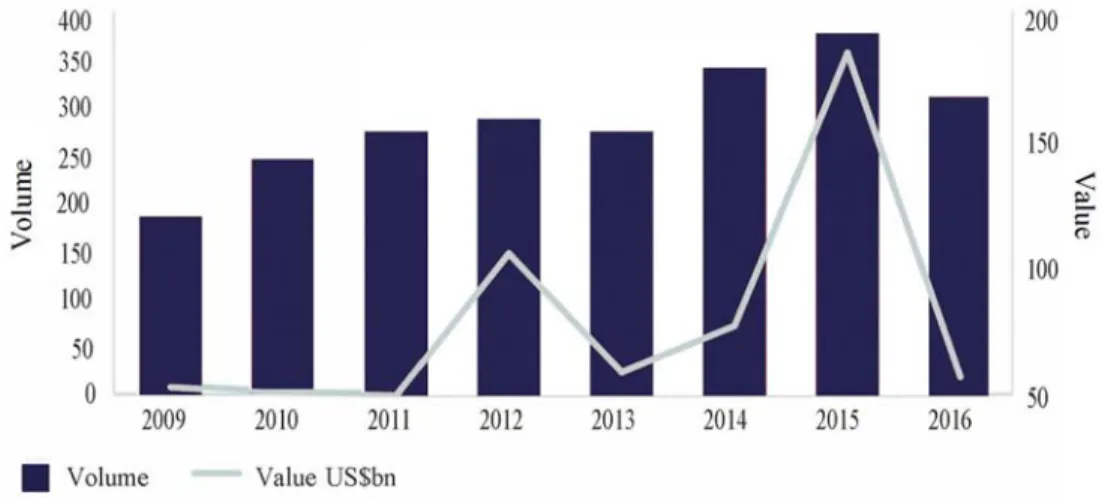
For the past seven years, with the exception of 2016 and 2013, cross-border M&A in the consumer goods industry has seen a steady increase, both in volume and in value.
This increase in transaction activity is mainly due to two major trends in consumer preferences and behavior: Health-conscious living and Digitalization
Health-Conscious Living
In the past years, the awareness for organically sourced products and environmentally friendly manufacturing has increased steadily and has become a major purchase factor for a significant number of consumers, as evidenced by the following quote: “Organic, local, additive and cruelty-free are the labels that consumers crave – particularly millennials” (Baker McKenzie 2016). These products, however, are not cheap but consumers are willing to a pay a premium. According to Baker McKenzie’s David Scott, “healthier and premium products are driving, and will continue to drive a lot of growth in [consumer goods] M&A” (Baker McKenzie 2016). Moreover, he asserts that the margins in this sector are very attractive, indicating the revenue generation potential behind this trend.
Since large corporates are usually unable or too slow to meet changing consumer demands in time they turn to inorganic growth in the required sub-segments through M&A. Such an example would be the deal of Danone, which acquired WhiteWave Foods, a natural, health-focused beverage producer for a total consideration of 12bn USD in July 2016, making it the biggest deal in the consumer goods industry in this year (Baker McKenzie 2016). This
Figure 2: Volume and value of cross-border M&A from 2009 to 2016 taken from Baker McKenzie (Baker McKenzie 2016)
16
transaction enhanced Danone’s healthy products portfolio and expanded its footprint in the USA.
Enhancing the company’s bottom line, however, is not the only appealing factor driving M&A in the consumer goods industry. Premium products can lift brand perception for the corporation as a whole and increase pricing power. According to Baker McKenzie’s Tim Gee “Unilever, for example, is moving into premium products in the personal care space, because it enables them to exert a bit more authority across the range” (Baker McKenzie 2016)
By allying the business with environmentally friendly and premium products, one can enhance the company’s perception with consumers, increase retention and through higher pricing power, achieve an increased bottom line.
Digitalization
The pace of digitalization has increased exponentially over the last ten years and has had a significant impact on every industry, especially consumer goods. New platforms and business models are emerging every day, revolutionizing delivery systems and consequently making it easier and faster for customers to gain access to their desired products. Due to the pace of development, it is often not feasible for corporates to build their own platforms and new delivery systems. “[Consumer goods] companies are not good at developing their own technology platforms” (Baker McKenzie 2016) says Baker McKenzie’s David Fleming. This, however, does not at all mitigate the willingness of corporates to take advantage of the new opportunities that digitalization offers. One approach chosen by some companies is the use of an incubator or an accelerator in their own corporation. Two examples would be Axel Springer’s “Plug and Play” and Deutsche Telekom’s “Hub:Raum”. These investment vehicles are allocated a certain amount of money, with which they undertake strategic investments to enhance the corporation’s portfolio and potentially gain access to above mentioned disruptive technologies.
The second, and more commonly chosen approach, is to engage in M&A. Digital innovation is creating a new type of transaction, since M&A in the consumer goods industry is no longer necessarily about vertical or horizontal integration but focuses on digital capability. According to Tim Gee, the most important innovation that companies will focus on, when engaging in M&A. is online sales since he considers this particular sector to be an area of growth. (Baker McKenzie 2016)
17
An example of such a deal would be Unilever’s acquisition of the Dollar Shave Club (DSC) for a total of 1 billion USD. This company offered online subscriptions for shaving products on a monthly or weekly basis. Business models such as DSC are disrupting a previously unchallenged market and thus provide room for M&A in this sector. Tim Gee argues that “you will see plenty of corporate venture transactions where the majors buy up recently established, blossoming micro brands and then see if they can globalize them” (Baker McKenzie 2016).
The above-mentioned trends provide an overview of potential motives to engage in cross-border M&A in the consumer goods industry and illustrate the attractiveness of consolidation in this particular sector. The North American markets have been the most targeted in the consumer goods industry for cross-border M&A (Baker McKenzie 2016). Due to this high volume of M&A activity, this study expects the United States to represent an appropriate market to test the motives and extent of value creation for target and acquirer shareholders.
II.3 Rationales for Mergers and Acquisitions in a Cross-Border Context
The following section will outline the three main motives or rationales for engaging in in cross-border M&A, which are namely: synergies, managerialism and hubris.
II.3.1 Synergies as Strategic Rationale for Mergers and Acquisitions
There are various sources of synergies in cross-border acquisitions. Before elaborating on these aspects, however, basic definitions shall be given. Synergies in the case of M&A translate into the ability of the combined firm to be more profitable than the individual parts of the firms (Gaughan 2007, p.124). This anticipation of benefits allows the bidding firm to incur the expenses of such a transaction and still be able to pay target shareholders a premium (Gaughan 2007, p.124). Despite the premium paid and the acquisition cost, the existence of synergies allows the firm to have a positive net asset value (NAV) (Gaughan 2007, p.124).
In this equation, is equal to the value of the combined firms. and are equal to the value of the target and the acquirer respectively. The variable P represents the premium paid by the bidder and E represents the transaction costs.
18
Here displays the synergy effect and represents the costs incurred by the bidder for the transaction. This equation illustrates that as long as the synergy effect is larger than the costs associated with a transaction the bidding firm should go through with the merger.
Especially in the context of cross-border M&A, various aspects concerning synergies need to be considered. The synergy hypothesis assumes that a company’s unique and specialized resources are not costlessly appropriable by other firms and that market frictions exist preventing the firm from trading its stock of valuable excess resources (Seth et al. 2000, p.389). Such frictions include restrictions on information sharing, government regulation and differing levels of managerial skills across countries. Previous studies have argued that synergies may arise from domestic acquisition due to (1) high investments needs of entering into a new market, (2) the time and financial means required to establish the firm in a new market and (3) the entry barriers that may be overcome by acquiring an incumbent (Singh, Montgomery 1987, p.378-379).
Considering cross-border M&A additional factors are introduced that do not necessarily play a role in domestic transactions. The general theory of foreign direct investment suggests that “Internationalization serves to determine the reasons for the foreign production and sales of the [multi-national enterprise], namely that these activities take place in response to imperfections in the goods and factor markets” (Rugman 1980, p.24). The Heckscher-Ohlin model of free trade assumes frictionless markets, zero transportation costs and homogenous tastes (Rugman 1980, p.25; Caves 2007, p.45). In such a perfectly competitive environment there would be no incentive for a company to relocate and produce in another country since free flow and movement of goods will ensure that supply meets demand and the prices will be equalized across economies (Calvet 1981, p.50; Seth et al. 2002, p.924). As this is, however, only a theory, previous literature has examined the various potential sources of value creation in cross-border M&A, of which some are going to be addressed in this paper in the context of the consumer goods industry.
Caves (2007) argues that one source of value creation that can be derived from cross-border M&A lies in the potential of the combined firm to share intangible assets in the context of imperfect international markets (Caves 2007, p.50). Should a firm have, for example, certain know-how under its control and the sale or lease of those assets is inefficient, then the firm should use it within the organization (Seth et al. 2002, p.924). Some advantages arising from such an internalization may be that the firm is able to work a new plant at designed capacity
19
sooner than a competitor or a product innovation coming from the parent company may present economies of scale in a subsidiary (Caves 2007, p.72). Previous research agrees that transacting in an international environment does entail various costs, which will in turn reduce the value of the intangible assets owned by the firm (Buckley, Casson 2003, p.220; Seth et al. 2002, p.925). If these costs prevent the firm from selling or leasing such assets, it is the best option to internalize them.
Another source of value may be associated with the opposite view of internalization, or “reverse-internalization”. In the case of reverse-internalization, the bidding firm acquires intangible assets from the target company that can be considered valuable in the bidder’s home market (Seth et al. 2002, p.925). Despite the fact that internalization and reverse-internalization may seem quite similar a crucial difference lies in the direction of the flow of knowledge (Seth et al. 2002, p.925).
In the case of imperfect national capital markets characterized by information asymmetry or capital controls, previous research has shown that it is possible for the multinational corporation to reduce the risk of their profits by engaging in foreign operations (Rugman 1976, p.75). This is due to the imperfect correlation of different national markets, resulting in a reduction in overall return variability. In the case of domestic acquisitions, such benefits cannot be realized since shareholders can simply recreate the company’s diversification strategies. In an international context however, a single shareholder is unlikely to be able to reproduce the exact diversification benefits of the corporation due to differences in transaction costs. Thus, one can assume that risk reduction activity in an international context does create shareholder value.
Value may also be realized through the reallocation of certain inputs to other areas of use. Penrose (2009) argues that inputs that are absorbed in one activity, may present a more profitable opportunity when put to a different use (Penrose 2009, p.155). If growth at home is limited, firms may seek to invest their excess resources abroad to assure long-run profitability of the organization. Similarly, for example in the presence of trade restrictions, exporting enterprises may only be able to take advantage of business opportunities in foreign markets through direct investment. This study will test the synergy hypothesis empirically in the context of cross-border M&A.
20
II.3.2 Managerialism Hypothesis as Rationale for Mergers and Acquisitions
The managerialism hypothesis as argued by Berkovitch and Narayanan (1993) suggests that “takeovers occur because they enhance the acquirer management’s welfare at the expense of acquirer shareholders” (Berkovitch, Narayanan 1993, p.350). They found a negative correlation between acquirer gains and total gains in a subset of US acquisitions, which provides evidence for the hypothesis that managers pursue their own well-being at the expense of their principals. This constitutes the classical principal-agent conflict. While managerialism was proven before in domestic transactions, it may also present a valid argument for cross-border M&A. In the past mainly two types of motives have found interest in research questions: empire building and risk reduction (Seth et al. 2002, p.926).
The notion of empire building was first introduced by Berle and Means (1933) through their analysis of the relationship between ownership and control in the corporation. They suggest that “stockholders have traded their legal position of private ownership for the role of recipient of capital returns” (Berle, Means 1997, 1991, p.9). Several studies built on the idea introduced by Berle and Means, deriving various models that address the sales or growth maximizing ambitions pursued by managers at the expense of their shareholders (Mueller 1969; Marris 1964; Williamson 1963). This is due to the fact that management compensation is often positively connected to the amount of assets under their control, thus leading them to pursue an increase in assets rather than in profits (Seth et al. 2002, p.926). While all managerial theories share the same goal in that they intend to maximize the managers’ welfare, they are limited by constraints put on them by the capital market (Trautwein 1990, p.287). Marris’ model introduces the concept of sustainable growth as the goal for managers (Marris 1964, p.40-41). Williamson, on the other hand introduced the idea of managers’ expense preferences, which were modeled as a variable containing factors such as excess staff or company cars (Trautwein 1990, p.288; Williamson 1963, p.40). Mueller argued that managers “maximize, or at least pursue as one of their goals, the growth in physical size of their corporation rather than its profits or stockholder welfare” (Mueller 1969, p.644).
The second concept that has been treated at length by existing literature is the pursuit of risk reduction by managers. Amihud and Lev (1981) addressed the idea of managers reducing their employment risk through conglomerate mergers. Such employment risk is closely related to the firm’s risk, since management compensation is based on, e.g. profit-sharing agreements, bonuses and the value of stock options (Amihud, Lev 1981, p.606). Since human capital is not tradable managers cannot diversify their employment risk, which is why they engage in
21
conglomerate mergers in order to stabilize the corporation’s income streams and thus the basis upon which their compensation is computed (Amihud, Lev 1981, p.606). As argued before, domestic diversification attempts do not create shareholder value, since the arising diversification benefits can be replicated by the shareholders themselves. Assuming that international capital markets are not segmented but integrated, the benefit from cross-border M&A in terms of reduction in return variability also ceases to exist (Seth et al. 2002, p.926). Managers may still, however, seek to smooth the earnings streams of their corporation given low earnings correlation in different countries. Consequently, they may engage in foreign acquisitions as vehicles for risk reduction and in the absence of control mechanisms, they may overpay for these transactions (Seth et al. 2002, p.926). This study will test the managerialism hypothesis empirically in the context of cross-border M&A in the consumer goods industry
II.3.3 Hubris Hypothesis as Rationale for Mergers and Acquisitions
The hubris hypothesis as presented by Roll (1986) indicates that a large part of the price increase in target firms may represent a simple transfer of wealth from the bidding firm. That is, the observed takeover premium overstates the increase in economic value of the corporate combination (Roll 1986, p.198). If no potential synergies exist, but some bidding firms think there are, this hypothesis argues that the valuation of the target itself can be considered a random variable with the target firm’s current market price as mean (Roll 1986, p.199). When this variable exceeds the mean, an offer is made, whereas outcomes in the left tail of the distribution are never observed, i.e. the distribution is truncated to the left (Roll 1986, p.199). Thus, the takeover premium simply represents a random error made by the bidding firm and the observed error is always in the same direction (Roll 1986, p.199). In case there do exist some gains for certain corporate combinations, at least part of the observed takeover premium may still be prone to valuation error and hubris (Roll 1986, p.200).
Previous research has found evidence for the hubris hypothesis. Their findings can be summarized as follows: Should any synergistic gains exist in a transaction, a manager acting in the best interest of his shareholders will pursue such an opportunity. Despite the fact that these synergies may be positive, due to a flawed calculation of the target’s value managers may overpay in some transactions, resulting in value destruction for the bidding firm’s shareholders (Roll 1986). This study will test the hubris hypothesis empirically in the context of cross-border M&A.
22
III. Empirical Analysis and Predictions
III.1 Hypotheses
Synergy, hubris and managerialism, as outlined in the previous section, may all represent valid motives for cross-border M&A. Their importance in the context of cross-border acquisitions represents an empirical question. In order to answer this question, the average gains to both target and acquirer and the total gains arising from the acquisition were computed. Moreover, the proportion of acquisitions with positive total gains was computed (Bradley et al. 1988, p.14; Roll 1986, p.202; Seth et al. 2000, p.392). This paper will also test the relationships between target and acquirer gains and between target and total gains. In a second step, following Seth (2002), this study will test the overall total gains from an acquisition using a regression with several different independent variables. The following section will outline the hypotheses that will be tested empirically. The approach used by this study does consider the fact that all three reasons (synergy, and hubris) may be present in the samples.
III.1.1 The Relationship between Target and Acquirer Gains to Total Gains
The synergy hypothesis proposes that acquisitions occur when the value of the combined firms is larger than the value of the individual firms (Bradley et al. 1988, p.4). These total gains are shared between the target and acquirer, where the former commonly receives a larger proportion as there is competition in the bidding process for the target (Seth et al. 2002, p.924). As the target is expected to extract more gains from the transaction than the acquirer, a positive relationship between target gains and total gains is expected. Depending on the level of competition in the market, acquirer gains may be close to zero. In such a case, the expected relationship between target and acquirer gains will be also close to zero. One may also argue, that the target will not be able to extract all of the synergistic gains associated with the acquisition due to differences in bargaining power. In this case, the shareholders of the acquiring firm will capture some gains as well (Seth et al. 2000, p.392). These predictions lead to the following hypotheses concerning the synergy:
Hypothesis 1: The main driver for cross-border acquisitions is synergy. Due to this fact, the following will be observed:
a) Positive total gains in acquisitions on average
b) Acquirers will receive, on average, non-negative gains c) Targets will receive, on average, positive gains
23
e) Target and acquirer gains will show a non-negative relationship f) Target and total gains will show a positive relationship.
As presented above, the hubris hypothesis argues that M&A transactions represent simply a transfer of value from the acquirer to the target. This leads to the prediction that around the time of announcement of a merger, (a) the combined value of the firm should remain the same, (b) the value of the target should increase and (c) the value of the acquirer should decrease. Since the hubris hypothesis indicates that acquisitions are a mere transfer of value, there should be no correlation between total gain and gains to the target. Moreover, there should be a negative relationship between gains to acquirer and gains to target (Seth et al. 2000, p.392). These predictions lead to the following hypotheses concerning hubris:
Hypothesis 2: The main driver for cross-border acquisitions is hubris. Due to this fact, the following will be observed:
a) Zero total gains in acquisitions on average
b) Acquirers will receive, on average, negative gains c) Targets will receive, on average, positive gains
d) There will be a proportion of acquisitions with positive total gains, equal to that expected by chance
e) There will be a negative relationship between target gains and acquirer gains f) There will be no relationship between target gains and total gains
The managerialism hypothesis, as argued before suggests that bidder’s managers engage in takeovers to enhance their own welfare at the expense of bidder’s shareholders (Berkovitch, Narayanan 1993, p.350). In an acquisition, the bidder has identified the target as being the most suitable to increase the acquirer’s welfare. Due to this fact, target shareholders have some bargaining power over the bidder’s management, which is why positive gains to target shareholders can be expected (Berkovitch, Narayanan 1993, p.350). Since the acquisition is undertaken at the expense of acquirer shareholders, their wealth should decline. Moreover, since there is some transfer of wealth from the combined entity to the acquirer management, total gains in such an acquisition will be negative. As target shareholders will be able to extract some value from the transaction due to their bargaining power, a positive relationship between target gains and total value loss is expected. Furthermore, a positive relationship between loss in welfare to acquirer shareholders and gains to target shareholders is expected (Seth et al. 2000, p.393). These predictions, lead to the following hypotheses concerning managerialism:
24
Hypothesis 3: The main driver for cross-border acquisitions is managerialism. Due to this fact, the following will be observed
a) Negative total gains in acquisitions on average b) Acquirers will receive, on average, negative gains c) Targets will receive, on average, positive gains
d) There will be a higher proportion of negative total gains than expected by chance e) There will be a negative relationship between target gains and acquirer gains f) There will be a negative relationship between target gains and total gains
The listed hypotheses as stated above are mutually exclusive as they identify separate ways to test the three explanations (synergy, hubris, managerialism) for cross-border acquisitions in the full sample. However, because some acquisitions may present evidence for more than one of the explanations, it is possible that all three are present in the full dataset used in this study. The hypotheses as stated make opposing predictions for some of the tests, which is why their effects may cancel out (Seth et al. 2000, p.393). Therefore, this study assesses the effects of the three explanations on the subsets of transactions with positive and negative total gains.
As discussed above, transactions that present characteristics of managerialism often show negative total gains. Consequently, this hypothesis can be eliminated in the subset with positive total gains and it remains to analyze the effects of synergy and hubris. This study supposes that the synergy hypothesis is going to play a major explanatory role. It is, however, possible that at the same time hubris is also present. As discussed above, both hypotheses predict positive total gains on average to targets. If the synergy hypothesis represents a major explanatory factor, then acquirer gains should also be positive on average. Should hubris be present, it will have the effect of driving down these gains to acquirers. In order to establish to which extent one or the other affects the gains to targets and acquirers in the subset of positive total gains several tests will be applied to determine the relationship between target and acquirer gains. Within the subset of positive total gains acquirer gains may be positive or negative and this study analyzes, whether the relationship between target gains and acquirer gains is the same for the group of transactions with positive and negative acquirer gains respectively (Seth et al. 2000, p.394). If hubris is negligible, a positive relationship between the acquirer gains and the target gains should be displayed and this effect should be observable for both groups of transactions, i.e. with either positive or negative acquirer gains (Seth et al. 2000, p.394). If there is, on the other hand, coexistence of synergy and hubris, a strong positive relationship between gains to acquirers and targets for the group of transactions with positive acquirer gains is expected, as
25
suggested by the synergy hypothesis. In the group with negative acquirer gains, a strong negative relationship between gains to targets and acquirers is expected, as suggested by the hubris hypothesis (Seth et al. 2000, p.394). Moreover, a strong negative relationship between these two subsets is expected. The above predictions lead to the following hypotheses:
Hypothesis 4: In the subset with positive total gains, synergy is the main motive for cross-border acquisitions. Thus, one will observe:
a) Acquirers will receive, on average, positive total gains b) Targets will receive, on average, positive total gains
c) A positive relationship between target and acquirer gains and there will be no difference between this relationship for the group with positive acquirer gains relative to the group with negative acquirer gains
Hypothesis 5: In the subset with positive total gains, synergy and hubris are the main motives for cross-border acquisitions. Thus, one will observe:
a) Acquirers will receive, on average, positive total gains b) Targets will receive, on average, positive total gains
c) A positive relationship between target and acquirer gains for the group with positive acquirer gains and a negative relationship for the group with negative acquirer gains. A similar assessment of the subset with negative total gains must be undertaken. For acquisitions with negative total gains one can assume that the synergy hypothesis is eliminated, since it predicts positive gains to both target and acquirer shareholders. This leaves hubris and managerialism as possible explanations for the observed returns. Both predict for this subset that acquirers will receive negative gains and targets will receive positive gains. Moreover, a negative relationship between target and acquirer gains is predicted (Seth et al. 2000, p.395). In order to examine whether managerialism or hubris dominates the subset, the relationship between target gains and total gains is assessed. If managerialism is the dominant explanation, there will be a negative relationship between target and total gains. As discussed above, managerialism suggests that targets will receive some of the gains extracted by the firm’s managers from their shareholders, by virtue of their bargaining power in the transaction (Seth et al. 2000, p.395). According to the hubris explanation, however, such a relationship does not exist. These predictions lead to the following hypotheses:
26
Hypothesis 6: In the sub-sample with negative total gains hubris is the main motive for cross-border acquisitions. Thus, one will observe:
a) Acquirers will receive, on average, negative gains b) Targets will receive, on average, positive gains c) No relationship between target and acquirer gains
Hypothesis 7: In the sub-sample with negative total gains, Managerialism is the main motive for cross-border acquisitions.
a) Acquirers will receive, on average, negative gains b) Targets will receive, on average, positive gains
c) A negative relationship between target and acquirer gains
As mentioned above, the second part of this study aims to provide an empirical evaluation of the total gains associated with the transaction in the data sample using a regression with various independent variables.
III.1.2 The Explanation of Total Gains through a Linear Regression
Referring to section II.3.1, various sources of value may coexist in synergistic acquisitions. In the above section, four different possibilities for value creation have been identified: (a) asset sharing, (b) reverse internalization, (c) market seeking and (d) financial diversification (Seth et al. 2002, p.925). If these concepts can provide an explanation for value creation in the dataset, one can predict a positive relationship between variables that act as proxies for the above possibilities and total gains. Thus, we can formulate the following hypothesis.
Hypothesis 8: Transactions in which synergies, i.e. positive total gains can be observed, a positive relationship will be observable between:
a) Value creation and asset sharing
b) Value creation and reverse internalization c) Value creation and market seeking
d) Value creation and financial diversification
Referring to section II.3.2 this study will examine if one or both of the agency problems described above is associated with value loss in transactions with negative total gains i.e. transactions that can be considered managerialist. Assuming that both empire building and risk reduction correspond to value destruction, a negative relationship is predicted between the variables that act as their proxies and total gains. In turn, a positive relationship between those
27
proxies and acquirer losses is expected (Seth et al. 2002, p.927). According to these predictions the following hypotheses can be formulated:
Hypothesis 9: For transactions which can be characterized as managerialist, i.e. which feature negative total gains, a positive relationship will be observable between:
a) Value destruction and empire building b) Value destruction and risk reduction
Hypothesis 10: For transactions which can be characterized as managerialist, i.e. which feature negative total gains, a positive relationship will be observable between:
a) Bidder losses and empire building b) Bidder losses and risk reduction
28
IV. Methodology
This chapter will discuss the methodological approach used in the study as well as its reliability and validity.
IV.1 Sample and Data
If the results of a research paper are to be reliable, the data used to conduct the study has to be chosen in a way that the reader of the study is able to replicate the results achieved by a research paper. Consequently, reliability is defined by Stenbacka (2001) as: “a measurement method’s ability to produce the same research result over and over again” (Stenbacka 2001, p.552). The following section will elaborate on the data used for this study, to infer its reliability.
The sample of M&A transaction for this study was obtained from the mergermarket database. In order to check the reliability of the data from this source, the deal information was double-checked with respective press releases. Since mergermarket did not provide the information on the number of bidders involved in the M&A process, this information had to be sourced manually from press and news reports. For some of the transactions, this data was rather difficult to obtain, and since the data research was done manually, certain mistakes may have occurred over the data sourcing process.
The stock price data of the companies involved in the transactions was obtained from Bloomberg., which is considered to be a reliable data base, as it is widely used in practice and research. This data base was used, since it contains stock price data from delisted companies – an important feature, as in M&A deals the target company’s shares are often removed from the stock market post-merger. The stock price data used was adjusted by Bloomberg for potential stock splits and dividends in order to represent the most reliable information.
All other data used for the calculation of the variables in the regression was also obtained from Bloomberg in order to ensure consistency in data base usage across all parameters. Furthermore, all statistical calculations were computed using the software SPSS and should thus provide accurate results.
Another crucial factor one has to consider when conducting empirical research is the external and internal validity of results. Internal validity considers the question whether the conclusions derived from an experiment truly imply cause (Cooper, Schindler 2014, p.201). External validity, on the other hand, considers the question whether the conclusions derived from an experiment can be generalized (Cooper, Schindler 2014, p.201).
29
The research approach used by this study measures if the announcement of a deal is value creating for both target and acquirer shareholders. To answer this question, several factors have to be considered. Firstly, is it possible to measure the effects of such an announcement through share price development? Should this be the case, one requires a model to estimate the expected stock prices, had the event not taken place. The approaches used by existing literature are numerous concerning both the applied event windows, as well as the models used for calculating the normal, or expected, return. The methods used in this study are in line with past research and can thus be considered to be valid (Seth et al. 2002; Seth et al. 2000).
Regression analysis is used in this study to establish a causal relationship between firm-specific variables and share price performance of both the target and the acquirer. The variables used in this paper are in line with past research and thus validity can be assumed (Seth et al. 2000; Seth et al. 2002).
The external validity, as mentioned above, considers the question if one can generalize the results generated by this study. Since the results found by existing literature are numerous and often vastly different, one cannot make a clear statement about the validity of this study’s results. Their external validity will be only known in the future.
IV.2 Event Study Methodology
Event studies have been used to establish shareholder wealth creation for various corporate events including M&A. The first research on this topic was conducted by James Dolley in 1933, who assessed share price effects in split-ups (Dolley 1933). His early efforts provide evidence that event studies have been of interest to the world of finance for almost eighty years. This research paper will follow the approach used by MacKinley (1997), who separates the process of conducting such a study into three distinct steps (MacKinlay 1997, p. 14).
Event Definition
The first step in measuring the value creating effect of M&A for target and acquirer shareholders through the event study methodology is to define the event itself. This study will use the approach outlined by Warner (1985), defining the event date as the day of the announcement of the merger (Brown, Warner 1985, p. 6).
In the next step, one has to define an event window in which to assess the effects of the event on the share prices of both target and acquirer. As mentioned above, we will assume for this study that the markets are in the semi-strong form according to Fama (1969) where “current
30
prices “fully reflect” all obviously publicly available information ” (Fama 1969, p.404). From this rationality of markets we can infer that “the effect of an event will be reflected immediately in asset prices” (MacKinlay 1997, p.149).
Concerning the length of the event window, one can find hardly any consensus in existing literature. They range for example from three days [-1;+1] (Sudarsanam, Mahate* 2003, p.308) to eighty-one days [-40;+40] (Weston et al. 2001, p.171), where the announcement date is 0. So far, not many studies have been conducted on value creation in cross-border M&A transactions. Due to this fact, this paper will follow to a certain extent Seth et. al. (2002), who used a twenty-day event window for their event studies. The event studies used for this study expanded this window to, where possible, forty-one days, i.e. [-20;+20]. Such a large event window, however, introduces a certain amount of noise into the model. Some research suggests that the statistically most reliable results come from short-term event windows, such as three days (Andrade et al. 2001, p.109). However, since the results of this event study will be used later for the calculation of total gains to target and acquirer shareholders, a prolonged event window is more likely to gather any and all value creating or destroying impacts from the respective M&A transaction and is thus considered to be more applicable.
Selection Criteria
After identifying the event date for the study, it is now necessary to determine the selection criteria for the inclusion of a given firm in the study (MacKinlay 1997, p.151). As mentioned above this study uses information from the data base mergermarket. The announcements that were studied include transactions that were subject to the following restricting criteria:
The sample includes data from 01/01/2009 to 31/12/2016
Both target and acquirer companies had to be listed on an exchange at the time of the transactions and stock price data has to be available through the databases that were at disposal.
The target company is based in North America.
The acquiring company may not be from the same country as the target. Both target and acquirer belong to the consumer goods industry
The acquirer has to purchase a controlling stake in the company, i.e. own less than 50% pre-transaction and more than 50% post-transaction.
31
The dates were chosen to show recent developments in the consumer goods industry over a short time frame. As this study’s aim is to assess the value creation effect in the context of North-America-bound M&A, the target company had to be headquartered in North America. Moreover, since this paper assesses the overall value creation in M&A transactions both target and acquirer have to be publicly listed at the time of the acquisitions (Seth et al. 2002, p.930). As some of the companies studied are not publicly listed anymore due to delisting procedures after the closing of the merger, it was crucial to the reliability of the study to obtain this data. Due to the very comprehensive nature of Bloomberg’s data offering, the necessary data was easily found. In order to limit the sample to control transaction, the 50% criterion was adopted (Seth et al. 2002, p.928). These criteria result in a sample of a total of 24 transactions, 18 of which showed positive total gains and the remainder of which featured negative total gains. Normal and abnormal returns
In order to evaluate the impact of the event, we have to define a measure for the abnormal return. The abnormal return can be defined as ”the actual ex-post return of the security over the event window minus the normal return of the firm over the event window” (MacKinlay 1997, p.151). Thus, we first need to establish a measure for the normal return for the shares of both acquirer and target company.
To establish the normal return, one first has to calculate the actual return on the stock for the time period considered in the study. The following equation was used:
, ,
, 1 (1)
, is the actual return on security i today. Accordingly, , represents the last price of
security i at time t=1, and , represents the last price of security I at time t=0. For this calculation, last price data from Bloomberg was used instead of average bid/ask price of the respective security. This may raise issues, since the last price is quoted as either the bid or the ask price. According to Blume (1983), this may result in an upwards bias of recorded closing prices, especially in smaller firms (Blume, Stambaugh 1983, p.388). Since all transactions included in the data sample represent M&A from larger companies, however, this effect should not compromise the calculation of the abnormal return.
The second step involved in calculating the abnormal return of a security, is the computation of the normal return, which can be defined as “(…) the return that would be expected if the event did not take place” (MacKinlay 1997, p.151). According to Weston et al.
32
(2001) there are basically three models of calculating the normal return: (1) The mean-adjusted return model; (2) The market model; (3) The market adjusted return model (Weston et al. 2001, p.171).
In the mean adjusted return model, a so-called clean period is chosen for which the average daily return is calculated. This period is always before, after or before and after the event period, but never during the event period (Weston et al. 2001, p.171).
The market adjusted return model simply assumes that the predicted or normal return during the event period is equal to the return of the chosen market index (Weston et al. 2001, p. 172).
Lastly, the market model is a statistical method and is estimated by performing a regression for the days in the period considered (Weston et al. 2001, p.172). One of the advantages of the market model over the market adjusted return and mean adjusted return model is that it reduces the variance in the abnormal return by removing the portion of return that is related to variation (MacKinlay 1997, p.155). Previous research suggests nonetheless that all models yield similar results (Brown, Warner 1985, p.25; Weston et al. 2001, p.171). Due to this fact, this paper will use the market model methodology to compute abnormal returns, since it provides some benefits over the market adjusted and mean adjusted return models.
, ∗ , , (2)
The above formula was used for the computation of the expected return , for security
i. In this equation, , represents the return of the market portfolio at time t, and and
represent the parameters of the model. The parameter , describes the zero mean disturbance
term (MacKinlay 1997, p.155).
As described above, the abnormal return represents the ex post return of a security less the expected return if the announcement had never happened. This results in the following computation:
, , , , ∗ , (3)
In this equation , , , and , represent the abnormal return, the actual return and the return of the market portfolio of security i at time t. The coefficients and are the regression estimates for the estimation period before the announcement date.
33 Estimation Procedure
To calculate the normal return, a choice has to be made concerning the index and the estimation period, i.e. how many days of return data will be considered. As far as the index is concerned, this paper chose the MSCI WORLD/CONSUMER Index. This selection was made since all companies involved in the dataset belong to the consumer goods industry but are listed on different exchanges. The MSCI WORLD/CONSUMER Index captures all firms in the dataset and thus allows to reduce variation in the data sample.
For the estimation of the market mode,l one needs to use historical data for the pre-event window. There is no consensus among scholars concerning both the estimation period and the frequency at which the returns are measured. Some research suggests that the parameter estimates improve when one increases the number of returns measured (Merton 1980, p.354). Others suggest that the opposite is the case and that due to, for example, microstructure noise the values of the parameters may be distorted (Ryu 2011, p.1). Scholes and Williams (1977) argue that, because the closing prices that are reported typically present trades prior to the actual close of the trading day, returns measured tend to deviate from true returns. The resulting non-synchronization in returns for different securities introduces into the market model an econometric problem of errors in variables (Scholes, Williams 1977, p.324). They argue that this problem is especially severe with daily returns and thus advise to use monthly or weekly data. According to Brown and Warner (1985), however, even when biases in β exist, they do not necessarily imply misspecification in an event study (Brown, Warner 1985, p.16). They argue that by construction the OLS residuals for a security sum up to zero in the period considered, which consequently eliminates any bias in β through a bias in α (Brown, Warner 1985, p.16).
The author believes Brown and Warner’s (1985) assessment to be correct. Due to data availability issues for some transaction different time frames had to be chosen. For most transactions, however, a total of 205 days was chosen in the window [-225;-20].
Testing Procedure
As mentioned above, the results of the event study were used to calculate the total gain (%TOTGAIN) associated with the announcement to acquire a target company (Seth et al. 2000, p.396). In order to do so, the cumulative abnormal returns (CARs) for each security are calculated over the event window [ ; . This will be done using the following formula: