HAL Id: pastel-00786531
https://pastel.archives-ouvertes.fr/pastel-00786531
Submitted on 8 Feb 2013
HAL is a multi-disciplinary open access archive for the deposit and dissemination of sci-entific research documents, whether they are pub-lished or not. The documents may come from teaching and research institutions in France or abroad, or from public or private research centers.
L’archive ouverte pluridisciplinaire HAL, est destinée au dépôt et à la diffusion de documents scientifiques de niveau recherche, publiés ou non, émanant des établissements d’enseignement et de recherche français ou étrangers, des laboratoires publics ou privés.
In vivo monitoring of elastic changes during cancer
development and therapeutic treatment
Heldmuth Latorre Ossa
To cite this version:
Heldmuth Latorre Ossa. In vivo monitoring of elastic changes during cancer development and ther-apeutic treatment. Medical Physics [physics.med-ph]. Université Paris-Diderot - Paris VII, 2012. English. �pastel-00786531�
THESE
pour obtenir le titre de
Docteur de l’Université Paris Diderot
Spécialité : Physiquepréparée à l’Institut Langevin
dans le cadre de l’Ecole Doctorale Matière condensée et interfaces
présentée le 15 novembre 2012 par :
Heldmuth Latorre Ossa
In vivo monitoring of elastic changes during cancer
development and therapeutic treatment
Directeur de thèse : Mickaël Tanter Co-directeur de thèse : Jean-Luc Gennisson
Devant le jury composé de : Lori Bridal Aline Criton Stefan Catheline Patrice Flaud Jean-Luc Gennisson Mickaël Tanter Rapporteur Examinateur Rapporteur Examinateur Co-directeur de thèse Directeur de thèse
Many people contributed to this work in one way or another during this three-year adventure called PhD. Hence, I would need tons of paper if I was to name each of them. I would love to write everybody’s name, but unfortunately, I do not have the amount of paper or the time such a task would require.
I would specially like to thank:
La Fondation Pierre Gilles de Gennes, which financially supported me during three years through their PhD fellowship.
My two directors Mickaël Tanter et Jean-Luc Gennisson for their unconditional support throughout this long but enriching process. They were always beside me, not to let me give up when I thought I was about to.
My colleagues from the different research teams with whom I collaborated: Foucauld Chamming’s, Laure Fournier and Olivier Clement (Hôpital Européen Georges Pompidou); Johanne Seguin and Nathalie Mignet (Faculty of Pharmacy of l’Université Paris Descartes); Emmanuel Farge, Maria Elena Sanchez and Sandrine Barbier (Institut Curie-Mechanics and Genetics of Embryonic and Tumoral Development group); and Anne Tardivon and Alexandra Athanasiou (Institut Curie-Radiology department).
My colleagues at l’Institut Langevin: Patricia Daenens and Abdelhak Souilah for their technical support.
My colleagues and close friends at l’Institut Langevin: Mademoiselle Christelle Jacquet et Maximin Jean Emmanuel Cès, who became an additional reason for me to come to the institute every day.
All the members of the jury, who devoted hours of their busy time to read the manuscript, suggest modifications and attend the defence.
My family, who always believed I was going to succeed despite the difficulties I encountered.
This PhD has been a tough but excellent experience. My bosses would say that I have learned about ultrasonic imaging, Matlab programming and elastography imaging among other subjects. All this is true. However, if someone asks me what I have learned from my PhD, I would reply: “I’ve learned that there’s nothing a human being cannot accomplish if things are done with passion. I’ve learned that self-confidence is extremely important if we are to achieve a goal, and I’ve learned that there will always be some people who will try to make you believe you will not be able to succeed, but that there will also be many more who will believe you can”.
TABLE OF CONTENTS
General Introduction ... 1
1. Chapter 1. Elastography: an important medical imaging research field ... 4
1.1 Introduction ... 4
1.1.1 Static Elastography ... 5
1.1.2 Dynamic Elastography ... 7
1.1.2.1 Monocromatic ... 7
1.1.2.1.1 Sonoelastography ... 7
1.1.2.1.2 Magnetic Resonance Elastography (MRE)... 10
1.1.2.1.3 Vibro-acoustography ... 11
1.1.2.2 Transient Elastography ... 13
1.1.2.2.1 1D Impulse Elastography... 13
1.1.2.2.2 2D Impulse Elastography... 15
1.1.2.2.3 Acoustic Radiation Force Imaging (ARFI) ... 17
1.1.2.2.4 The Supersonic Shear Wave Imaging (SSI) Technic ... 19
1.2 Conclusion ... 22
References ... 23
2. Chapter 2. Monitoring Chemotherapy treatment by using 3D-Shear Wave Elastography (3D-SWE) ... 26
2.1 Introduction ... 26
2.2 Materials and Methods ... 27
2.2.1 Clinical protocol ... 27
2.2.2 3D-Ultrasound (3D-US) ... 28
2.2.3 3D-Shear Wave Ultrasound Elastography (3D-SWE)... 29
2.2.4 Magnetic Resonance Imaging (MRI) ... 29
2.2.5 Statistical analysis. ... 30 2.3 Results ... 30 2.3.1 Protocol I... 30 2.3.1.1 Statistical analysis ... 33 2.3.2 Protocol II ... 34 2.3.2.1 Tumour volume... 34 2.3.2.2 Tumour elasticity ... 38 2.4 Discussion ... 41 2.5 Conclusion ... 42 References ... 43
3.1 Materials and Methods ... 45
3.1.1 Tumour growth phase ... 46
3.1.1.1 Tumour model... 46
3.1.1.2 2D-Ultrasound and the Supersonic Shear Wave Imaging (SSI) technique ... 46
3.1.1.3 In vivo/ex vivo comparison of elasticity values ... 48
3.1.1.4 Pathological analysis... 48
3.1.1.5 Statistical analysis ... 49
3.1.2 Tumour treatment by chemotherapy ... 50
3.2 Results ... 50
3.2.1 Tumour growth ... 50
3.2.1.1 Tumour model... 50
3.2.1.2 The Supersonic Shear Wave Imaging (SSI) technique ... 51
3.2.1.3 In vivo/ex vivo comparison of elasticity values ... 53
3.2.1.4 Pathology ... 54
3.2.2 Tumour treatment by chemotherapy ... 56
3.3 Discussion ... 57
3.4 Conclusion ... 59
References ... 60
4 Chapter 4. Characterization of ectopic and orthotopic colon carcinoma CT26 using Ultrasound and the Supersonic Shear Wave Imaging (SSI) technique... 61
4.1 Introduction ... 61
4.2 Materials and Methods ... 62
4.2.1 CT26 tumour model ... 62
4.2.2 Histological tumour cellularity and Micro Vascular Density characterization ... 62
4.2.3 Animals ... 63
4.2.4 Ectopic tumour implantation ... 63
4.2.5 Orthotopic tumour implantation ... 64
4.2.6 Combretastatin A4 Phosfate treatment ... 64
4.2.7 2D-US and the SSI technique ... 65
4.2.8 In vivo calliper measurements... 66
4.2.9 Statistical analysis ... 67
4.3 Results ... 67
4.3.1 Measurement of the tumour volume and elasticity ... 67
4.3.1.2 Tumour elasticity ... 70
4.4 Discussion ... 74
4.5 Conclusion ... 76
References ... 76
5. Chapter 5. Nonlinear shear elastic parameter quantification ... 78
5.1 Introduction ... 78
5.2 Materials and Methods ... 80
5.2.1 Acoustoelasticity theory ... 80
5.2.2 Experimental Setup ... 82
5.2.3 Imaging techniques and finite element simulation ... 83
5.2.3.1 Shear modulus computation using the Supersonic Shear Imaging technique ... 84
5.2.3.2 Displacement and Strain maps computation using the static elastography technique ... 84
5.2.3.3 Stress computation combining static elastography and SSI measurements ... 84
5.2.3.4 Nonlinear shear modulus (A) calculation ... 85
5.2.4 Finite element simulation... 87
5.3 Results ... 87
5.3.1 Experimental and simulated cumulative Strain maps ... 89
5.3.2 Experimental and simulated cumulative stress maps ... 90
5.3.3 Nonlinear shear modulus maps in agar-gelatin phantoms ... 92
5.3.4 Nonlinear shear modulus maps in ex vivo beef liver samples ... 92
5.4 Ex vivo application ... 93
5.4.1 Ex vivo strain and stress calculation in mouse colon tissues ... 93
5.4.1.1 US Imaging ... 94 5.4.1.2 Animal preparation ... 96 5.5 Discussion ... 98 5.6 Conclusion ... 101 References ... 102 General Conclusion ... 104
1
General Introduction
Medical imaging is an important, rapidly growing field which groups all the existent imaging modalities. The development of this field has been boosted by the necessity of better understanding and early detecting of a wide range of complex human pathologies. The characteristics of each imaging modality make them more or less suitable for an organ within the human body. Currently, there exist several techniques such as: Ultrasound Imaging (US), Magnetic Resonance Imaging (MRI), X-rays, Computer Tomography (CT), and Positron Emission Tomography (PET) among others. Amid these imaging modalities, US is one of the most popular among clinicians, due to being a “clean” technology which does not pose any risk to patients and to be much more affordable and easier to implement than other imaging techniques.
Ultrasound imaging is based on the propagation of acoustic waves in biological tissues. This technique allows to monitor the human body in real time and to acquire grayscale images from ultrasound signals which have been reflected by different types of biological tissues within the body. Therefore, the images offer only part of the information contained on the reflected waves. Nevertheless, in order to fully exploit information from the reflected signals, other ultrasound-based techniques have been developed during the past decades. For instance, “2D-Colour Flow Imaging” (better known as Doppler Imaging), which allows the retrieval of the blood flow, has become particularly useful in the diagnosis of cardio-vascular pathologies. Aiming to improve tissue characterization, as conventional ultrasonic images offer only qualitative morphological information, another technique called Static Elastography appeared by the late nineties. This technique permitted the qualitative estimation of the tissue elasticity, a parameter which plays a key role in tissue characterization. Later, a technique named Transient Elastography was developed during the doctorate of S. Catheline and L. Sandrin. This technique studied the generation and propagation of shear waves. In fact, at low frequency, the human body behaves like an elastic solid. Thus, it is possible to generate shear waves within the body and to assess their speed which is directly related to the medium elasticity. The impulse elastography technique opened the path for what is today known as the Supersonic Shear Wave Imaging (SSI) technique, which utilizes acoustic radiation force to excite the medium and generate shear waves and ultrafast imaging to track their displacement; offering a quantitative estimation of the tissue elasticity. Other dynamic elastography techniques such as sonoelastography and Magnetic Resonance Elastography which study the shear wave propagation have been developed. These dynamic elastography techniques possess their own advantages and limitations, but none of
General Introduction
2
them is able to follow the shear wave propagation in real time, an essential aspect in the retrieval of biological tissue elasticity.
The SSI technique has proved to be instrumental in the detection and monitoring of human cancerous tumours. This technique is the base of the work contained in this manuscript. The results of several studies in which tissue mechanical parameters such as elasticity and shear non-linearity are used for the characterization of biological tissues are presented.
This report begins with the elastography state of the art, in which a brief overview of the most relevant elastography techniques developed during the last decades is given. Particular emphasis is placed on the SSI technique due to being the core of this work. This information could be relevant for those readers who are not very familiar with the elastography imaging modalities.
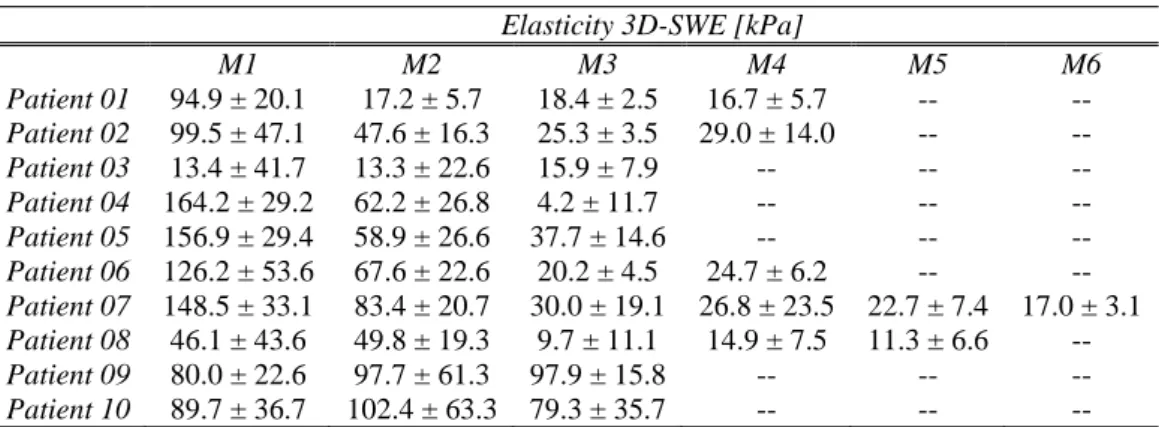
In Chapter 2, the results of a clinical study performed in collaboration with l’institut Curie on thirty-three patients presenting breast cancer lesions are introduced. The clinical protocol was divided in two parts: Protocol I and Protocol II. In Protocol I, 3D-US was used to calculate the tumour volumes of twenty-three patients. These volumes were then compared to MRI calculated volumes in order to measure the degree of agreement between both imaging modalities for volume retrieval. In Phase II, ten patients (different from the ones taking part in Phase I) were monitored by using 3D-US and 3D-SWE as they underwent neo-adjuvant chemotherapy treatment. 3D-US was used to measure tumour volume (as done in Protocol I) and 3D-SWE to measure the tumour elasticity at each time measurement point. The aim was to evaluate the feasibility of using 3D-SWE to monitor the chemotherapy treatment efficiency along with tumour volume, which is currently the most important parameter used by clinicians to determine the efficiency of a chemotherapy treatment.
Although clinical studies are extremely important in medical research, they possess their own limitations. For instance, the degree of experimental flexibility is much more reduced than in pre-clinical studies not to put the patient’s health in danger. Chapter 3 presents the results of a pre-clinical study performed on mice in collaboration with L'hôpital Européen Georges-Pompidou (HEGP). The study was also divided into two parts: Phase I (tumour growth) and Phase II (chemotherapy). During Phase I, a representative human breast carcinoma was implanted on the flank of immune deficient female mice. US and the SSI techniques were used to measure the tumour volume and elasticity respectively from the moment the tumours become large enough to be monitored. In Phase II, the same type of human breast carcinomas were implanted in a different population of mice. The mice begin to receive a neo-adjuvant chemotherapy treatment when the tumours reached an approximate diameter of 2 cm. US and the SSI techniques were used to measure the tumour volume and
3
elasticity respectively during chemotherapy. The goal of this pre-clinical protocol was to understand the pathology underlying stiffness. In other words, to comprehend how and which physio-pathological parameters (cellularity, microvascular density, fibrosis and necrosis) are correlated with tissue stiffness.
Since there exists different kinds of anti-cancerous therapies depending on the characteristics and state of the lesions, the information retrieved from studies performed with a given treatment may not be directly transposable to other types of therapies. Chapter 3 introduces the results of another pre-clinical study performed in mice in collaboration with researchers from the faculty of Pharmacy of L'Universite Paris V Descartes. Human colon carcinomas were implanted in the flank and in the abdominal cavity of female mice. An antivascular treatment, which attacks the tumour vascular network and whose effects appear much earlier than in chemotherapy treatment, was administered to the mice beginning twelve days after tumour implantation. As done in the protocol presented in Chapter 3, US and the SSI techniques were used to measure the tumour volume and elasticity respectively five days after the implantation. This pre-clinical study intended to know if this particular type of therapy would cause a change in the tumour elasticity, and if this change would take place earlier than the change in the tumour size, which as it was said before, is currently the most important criteria to decide whether a given anti-cancerous treatment is causing a positive effect on the patient or not.
From the beginning of this work, only tissue elasticity has been the parameter employed for the characterization of biological tissues. Nevertheless, in some cases, elasticity may not be sufficient to determine the pathological state of a biological tissue. Chapter 5 presents the development of a technique combining static and dynamic elastography for the retrieval of an additional tissue mechanical parameter: the third order non-linear shear parameter . Here, the first known 2D non-linear shear elasticity maps are presented. The results of the experiences were performed on tissue mimicking phantoms and on beef liver samples. The technique developed was used in ex vivo experiences on mice colon to determine the amount of stress induced to the colons by the interaction between a magnet and ferro-magnetic liposomes previously injected into the colon. The induced stress intended to emulate the stress induced by tumour growth on neighbouring tissues, which seemingly plays a key role in the development of cancer tumours in tissues with a genetic cancer predisposition.
Chapter 1. Elastography: an important medical imaging research field
4
1. Chapter 1. Elastography: an important medical imaging research field
1.1 Introduction
It is widely known that the presence of cancerous tumours can be detected by medical palpation [1]. In fact, it is during this medical procedure that clinicians intuitively try to assess the Young’s modulus of the tissue (which is a physical parameter linked to the tissue elasticity) in order to determine the presence of any tissue abnormality, due to the fact that the pathological state of a tissue is commonly associated with its elastic properties at the macroscopic level. This concept is the base of a medical imaging technique called ultrasound elastography, which has found great applicability in the detection of breast lesions. Since the 70s, Ultrasound Elastography has gradually become a powerful medical imaging technique as it offers real time qualitative, quantitative and functional information on the inner structure of the human body. However, the technique has its limitations as in some cases it is not able to offer the required information on the areas of interest. This has inspired several scientists who tried to use other techniques to complement the elastography results. R. Dickinson [2] had the idea in 1981 of quantifying the body’s natural vibrations. He designed an ultrasound signal correlation method to quantify the amplitude and the frequency of these vibrations. He proposed a relationship between the human organs’ elasticity and their natural displacements. Two years later, A. Eisencher [3] exploited, for the first time, the propagation of elastic waves. His idea consisted in replacing the human vibrations by controlled mechanical vibrations. He called his technique echosismography and it consisted in combining conventional ultrasound with the use of an external vibrator. He showed that it was possible to qualitatively interpret the images obtained by this technique to determine different elasticity areas (Fig 1.1). The applied vibrations were distinguishable on the image and the analysis of their amplitude allowed (with some experience) the determination of tumour lesions (pointed out by the white arrow on Fig 1.1). In this way, Eisencher showed the feasibility of detecting the presence of hard masses surrounded by healthy tissue. His work set the basis for the development of the dynamic elastography domain.
5
Fig 1.1. One the first echosismography images of human breast. The qualitative analysis of the obtained vibrations allows the discrimination of areas of different elasticity [4].
Another pioneer in the elastography domain is J. Ophir [5]. In the 90’s, he suggested that the use of ultrasound was sufficient to determine the elasticity of biological soft tissues. His technique was based on the simple comparison of several ultrasound images acquired before and after the application of static compression on the medium under investigation. Thus, he substituted the external vibrations by the static compression.
The work of Eisencher and Ophir set the foundations for all the currently existing ultrasound elastography modalities, which can be classified into static and dynamic elastography depending on the sort of mechanical excitation employed. Dynamic elastography techniques can then be sub-classified in monochromatic and transient as it will be described further in this chapter. Explaining all the existing elastography modalities constitutes a big challenge. Hence, in this chapter, only a brief explanation of the most important elastography techniques will be given, before focusing on the structure and main characteristics of the transient elastography technique which constitutes the core of this work.
1.1.1 Static Elastography
Ultrasound static elastography was first introduced in 1991 by Ophir [5]. It consists in measuring the displacement induced within the tissue by a continuous mechanical force. This technique is based on Hooke’s law which states that for homogenous and isotropic material, the deformation (ε) is directly proportional to the uni-axially applied stress (σ) (see Eq. 1); where E represents the elastic Young’s modulus of the material.
The static elastography technique employs an external, quasi-static uni-axial source of compression such as mechanical actuators to compress the tissue and generate displacement and strain (Fig 1.2). Local strains are derived from the ultrasonic backscatter signals before and after compression by the 2D cross-correlation of the ultrasound pre and post compression data. This technique thus produces qualitative deformation gradient images (elastograms) (Fig
Chapter 1. Elastography: an important medical imaging research field
6
1.3) which are easy to interpret as long as the applied stress is relatively uniform. The technique is based on the physical principle that the lower the Young’s modulus of a material, the higher the strain or deformation.
Fig 1.2. Static Elastography principle. Axial-compression (σ) is applied to the medium to cause a deformation (ε); a) medium before compression and b) after compression.
Fig 1.3. (Left) Echographic image of a biopsy proven breast carcinoma; (Right). The elastogram depicts the deformation caused by the quasi-static compression for each pixel on the image. The lesion appears significantly stiffer (reddish) than its healthy surrounding tissue. eSie TouchTM software elasticity imaging – ACUSON S200 ultrasound system (SIEMENS).
The efficiency of static elastography as a complementary medical imaging tool has been shown [6][7]. It has the advantage of being relatively easy to apply. Moreover, the fact that the ultrasound probe can be used to produce localized compression near the region of interest for the breast and other superficial targets make it an appealing imaging technique. However, it possesses some limitations for in vivo imaging: the boundary conditions are not taken into account; nearly uniform stress must be applied in order to be able to interpret the images which renders it very operator dependant; the targets tend to move out of plane during compression; it is difficult to compress deeper organs and the elastograms give only qualitative information since the amount of applied compression is unknown and hard to control.
In order to overcome the limitations of static elastography and more importantly, to obtain quantitative elasticity maps, new elastography modalities have been developed in the last decade. Unlike static elastography, these new modalities known as dynamic elastography
7
techniques, do not excite the tissue by mechanical means but employ a vibrating force (sonoelastography) [8], a given frequency shift (vibroacoustography) [9], a very short impulsion (transient elastography) [10] or acoustic radiation force [11][12]. All these methods have shown their efficiency to determine elastic properties of biological soft tissues, as they give access to quantitative elastograms with better resolution than the qualitative ones obtained through static elastography. Nonetheless, they are slightly more difficult to implement since they need more complex setups able to generate and detect shear waves. A brief explanation of the principal dynamic elastography methods is given as follows.
1.1.2 Dynamic Elastography
Parallel to the static elastography technique, dynamic elastography methods based on shear wave propagation were also developed. The biggest advantage lies on their capability to offer quantitative elastograms. Depending on the way the tissue is excited, the dynamic elastography techniques can be classified into monochromatic and transient.
1.1.2.1 Monocromatic
Unlike transient elastography, monochromatic elastography techniques utilize a monochromatic (continuous) source to excite the tissue. The shear wave velocity is then retrieved by ultrasonic (sonoelastography and vibro-acoustography) or magnetic resonance (magnetic resonance imaging) imaging methods.
1.1.2.1.1 Sonoelastography
In 1987, Krouskop et al. [13] performed the first in vivo quantitative measurements of tissue elasticity on amputated limb stumps. In his experiments, a vibrator excited the muscles of the living part of the leg attached to the amputee at a frequency of 10 Hz. The displacements induced by the shear wave propagation were measured by the Doppler effect avec un ultrasound probe. This technique was based on the fact that the frequency shift obtained by the Doppler effect is proportional to the amplitude of the displacements. Then, by applying a simple viscoelastic model, the tissue elasticity could be retrieved. This technique would be later known as sonoelastography.
Sonoelastography is a method that combines mechanical vibrations and ultrasound Doppler imaging. Lerner and Parker carried out later in 1992 [14][15] and in 1998 [8] new experiments on sonoelastography, in which a low frequency vibration (20 to 100 Hz) was externally applied to excite internal vibrations within the tissue under investigation. They believed that the elasticity of a medium was directly connected to the amplitude of the displacements. The hypothesis was that stiffer areas would vibrate at much lower amplitude than softer ones.
Chapter 1. Elastography: an important medical imaging research field
8
The first sonoelastography images show the presence of a hard inclusion within a sponge (Fig 1.4). The level of stiffness was represented by colours. The stiffer areas were depicted in darker colours. Hence, the higher the elasticity the darker the colour and the lower the vibration amplitude. Nevertheless, this simplified approach did not take into consideration the undesirable effects caused by diffraction, dissipation and stationary waves, diminishing the application of the technique for in vivo measurements of the elasticity of biological tissues such as muscle.
Fig 1.4. First known sonoelastographic image (7x5 cm2). The image shows the vibration within a sponge containing a stiff inclusion (low-dark region). The stiffer regions are represented by darker colours [16].
A second approach was developed by Sato [17][18]. Aiming to overcome the obstacles encountered by the first sonoelastography experiments, his work focused on the visualization of the shear wave propagation. In fact, for any source exciting the surface of an homogenous isotropic medium, two types of waves are generated: a shear wave and a compressional wave. Each wave possess a velocity (VS and VP for the shear and
compressional wave velocities respectively) which can be expressed with the Lamé coefficients λ and µ as follows:
√ √
Where ρ0 is the initial medium density, µ the elastic shear modulus and (λ + 2µ) the elastic modulus of compression. The wave velocities are linked to a couple of independent coefficients (λ, µ) which are expressed as a function of the medium’s Young’s modulus (E) and Poisson’s ratio (v) [19]:
( )( ) ( )
9
( )
( )
Since we deal with biological tissues, which are quasi-incompressible materials (v ≈ 0.5), Eq. 3 becomes:
The medium’s Young’s modulus is directly linked to the shear wave speed. Moreover, the shear modulus µ is negligible compared to the Lamé coefficient λ. It has been experimentally proven that in soft media, the compressional wave velocity (VP ≈ 1500 m/s ) is
much higher that the shear wave velocity (VS ≈ 1 m/s ).
It was on measuring the shear wave velocities that S. Levinson focused one of his first in vivo studies in 1995. Here, he measured the elasticity evolution as a function of the force delivered by a group of leg muscles (the quadriceps) [20]. He came to the conclusion that the more the group of muscles was contracted, the higher the global Young’s modulus (Fig 1.5).
Fig 1.5. Shear wave speed values in ten subjects as a function of the applied load. The values have been averaged over all the eighteen combinations of frequency, knee flexion angle and propagation direction. The speed of sound increased uniformly with increasing load (apart from subject 5), supporting the theoretical link between elasticity and sound speed [20].
There exist a considerable amount of literature on sonoelastography. In their respective work, K. Fujii [21] measured the shear wave velocity by Laser-Doppler Interferometry at several frequencies; V. Dutt and J. Greenleaf [22] employed a method of Quadrature- Phase on the echographic signals and also measured the shear wave velocities for frequencies ranging from 200 to 500 Hz without measuring the elasticity.
Fig 1.6 presents the sonoelastographic image of a biopsy proven cancer tumour. The sonoelatographic image puts in evidence a stiffer zone which appears normal on the B-mode image.
Chapter 1. Elastography: an important medical imaging research field
10
Fig 1.6. Sonoelastography image of a histology proved prostate cancer tumour. a) histologic image portrays the tumour enclosed by the green contour line; b) the corresponding B-mode image obtained on the same plane does not show any kind of tissue abnormality; c) the sonoelastographic image of the same area shows a vibration deficit (red arrows) characteristic of stiffer tissue areas [23].
The sensibility of all these methods to the boundary conditions made it very difficult to interpret the shear wave phase velocity maps. Nevertheless, this obstacle can be overcome by Magnetic Resonance Elastography (MRE), a technique which gives access to the three spatial components of the induced tissue displacement with high accuracy and precision, facilitating the resolution of the inverse problem. It uses the same low-frequency excitation system but the ultrasound imaging system is replaced by a magnetic resonance imaging one.
1.1.2.1.2 Magnetic Resonance Elastography (MRE)
It was initiated in 1995 by J. Greenleaf [24] when the first displacement phase and displacement amplitude images were obtained by using Magnetic Resonance. This technique uses a low frequency vibrator to excite the tissue at a central frequency ranging between 50 and 1000 Hz (usually centred at 100 Hz for human beings) depending on the targeted organ. A special Magnetic Resonance Imaging (MRI) sequence allows the movement codification at the given central frequency. A stroboscopic technique is then employed to rebuild the three-dimensional movement within the organ from several points taken for each period. The retrieved 2D displacement vector field is used to retrieve the tissue’s Young’s Modulus. MRE very much depends upon the number of cycles (which is elevated) and permits the measurement of the three components of the displacement vector having a vector base of the right gradient. Its precision for measuring the tissue displacement reaches the 100 nm. The acquisition time depends on the image resolution and can easily achieve several minutes, which makes it impossible to use in moving organs such as the heart and the kidney. Moreover, the mechanical excitation must be “monochromatic”, since the displacement acquisition is not instantaneous and requires a perfect synchronization between the MRI device and the low frequency mechanical excitation. Therefore, the observed waves are exclusively monochromatic.
Fig 1.7 presents the MR and MRE images of a breast lesion before and after chemotherapy, where a change in the tissue elasticity pre and post treatment of the lesion is observed.
11
Sinkus et al. [25] used MRI to show the feasibility of the determination of additional tissue biological parameters such as anisotropy, and its importance when assessing the pathological state of a lesion. Additionally, Oliphant [26] succeeded in estimating the complex shear modulus and showed the feasibility of retrieving the shear viscosity modulus. In vivo studies have been performed. Plewes [27] visualized and quantified the breast mechanical properties and Dresner [28] quantified the biceps elasticity during muscular contraction.
Fig 1.7. Representative MRE study of a breast lesion. (Top) the MR images of a the lesion before and after chemotherapy. (Bottom) Corresponding quantitative elasticity maps based on MRE of the same areas of interest, at both time points. A reduction of the highest values of stiffness is noted after chemotherapy [16].
MRE is particularly useful for imaging the brain since it rests still within the cranial cavity. Even though MRE offers 3D quantitative images of very good resolution, its cost, limited mobility and long acquisition times are important obstacles for in vivo imaging studies. In addition to this, the technique is very noise sensitive and the inverse problem is difficult to resolve. Nevertheless, these obstacles can be overcome with the use of impulse elastography, whose main characteristics are explained further in this chapter.
1.1.2.1.3 Vibro-acoustography
As an ultrasound beam propagates through an absorbing medium, the energy transfer results in a second-order effect that produces a force proportional to local intensity and absorption, which is termed radiation force [34]. In 1990, Sugimoto et al [35] came up with a set-up which applied radiation force to a tissue sample while measuring the resulting tissue displacement with an ultrasound probe. The displacement vs. the relaxation curve were fitted to a multi-exponential function as a model of the mechanical properties [16].
M. Fatemi and J. Greenleaf [36] developed a two-frequency method which measured the acoustic responses to the excitation caused by the radiation force of two interfering ultrasound beams. A confocal transducer produced two continuous ultrasound waves whose
Chapter 1. Elastography: an important medical imaging research field
12
frequencies (f and f + f) slightly differ and which intersected at the object. The acoustic remote intersection of the two beams produced an oscillating radiation force over the object at the frequency difference which made it vibrate, emitting an acoustic field in the surrounding medium. The beam’s remote intersection eliminates the object’s acoustic emissions and the transducer’s interference. The sound waves generated by the vibration of the object are detected by an hydrophone tuned to the difference frequency (f) and filtered by a band-pass filter centred at the same frequency. In order to build a 2D image, the confocal transducers sweep out the entire area in raster scanning like motion (Fig 1.8). The main frequency (f) and the difference frequency (f) are in the order of MHz and kHz respectively.
Covering the entire region by the radiation force caused a considerable energy transfer to the medium under test and a relatively long acquisition time, which limited the in vivo applicability of this technique. Moreover, the measured parameter depended on the radiation force and the stiffness and geometry of the vibrating object. Fig 1.9 shows a x-ray mammography of a healthy breast and its corresponding vibro-acoustographic image.
Fig 1.8. Vibro-acoustography system diagram. (Top) A simplified vibro-acoustography set-up. (Bottom)Two continuous wave generators drive these elements at slightly different frequencies. The transducer is focused on the object, with the beams interacting at the joint focal point to produce an oscillating radiation force on the object at the difference frequency. This force causes the object to vibrate and as a result an acoustic emission field is produced in the surrounding medium. This field is detected by the hydrophone and filtered by a band-pass filter centred at the difference frequency. The amplitude of the resulting signal, detected by the detector, is used to modulate the intensity of the image at a point corresponding to the position of the beam on the object. [37].
13
Fig 1.9. Breast Images of a healthy breast. (a) X-ray mammography of the entire breast and (b) its corresponding vibro-acoustographic image focused at 2 cm depth from the skin (Δf = 50 kHz) [38].
Later in 2004, Greenleaf developed a quantitative method called Shear Wave Dispersion Ultrasound Vibrometry (SDUV) [39] to measure stiffness and viscosity of soft tissue non-invasively. SDUV uses a focused ultrasound beam within the FDA power limits to stimulate (within the studied tissue) cylindrical harmonic monochromatic shear waves propagating outwards from the beam axis. The shear wave propagation is tracked using a separate ultrasound beam in pulse\echo mode. The phase of shear wave is measured at two different points within the propagation path and used to retrieve the shear wave speed. This processes is repeated at several frequencies and fitted with a theoretical Voigt dispersion model to inversely solve for tissue viscosity and elasticity.
Despite the fact that the monochromatic excitation elastography techniques offer a quantitative mapping of the tissue elasticity, the disadvantage of the monochromatic vibrations lies on the impossibility to separate the compressional waves from the shear waves, an aspect that can affect the shear wave velocity calculation. This aspect paved the way for the development of new elastography techniques, in which the tissue excitation was not monochromatic but transient.
1.1.2.2 Transient Elastography
Several techniques focus on the propagating shear waves resulting from a transient (impulsive or short tone burst) tissue excitation, whose displacement history along the central axial line can be extracted by ultrasonic techniques. This allows the global estimation of the tissue shear wave velocity and therefore the tissue elasticity.
1.1.2.2.1 1D Impulse Elastography
One-dimensional impulse elastography was born in 1994 during the PhD thesis of S. Catheline [29]. The idea consisted in measuring the tissue elasticity after exciting the tissue not monochromatically like in sonoelastography or MRE but by using a short impulsion. This technique allowed separating the compressional wave (which propagates very rapidly) from the slower shear wave without taking into account the boundary conditions. Therefore, the shear wave (generated by the pulse) displacement was no longer stroboscoped but recorded in
Chapter 1. Elastography: an important medical imaging research field
14
real time by using a conventional ultrasound probe along the entire trajectory. Fig 1.10 illustrates a typical 1D impulse elastography setup.
Fig 1.10. The vibrator gives a low frequency touch (about 50 Hz) to the sample, generating a compressional and a shear wave. The ultrasound probe (which is placed over the vibrator) permits monitoring the shear wave propagation within the medium by using speckle axial correlation more than 1000 times/s. Therefore, the shear wave velocity and the material’s Young’s modulus can be retrieved [31].
Initially, a shear wave and a spherical compressional wave were generated when a circular piston (with a diameter ranging from 5 to 20 mm) slightly touched the medium [30]. A 3 MHz transducer placed right in front of the piston and focused, permitted to image the entire area of interest. The displacement generated within the medium by the shear wave propagation was then retrieved by correlating the back-scattered echo signals using an ultrasound probe more than 1300 times (repetitions) per second [4]. Finally, the shear wave velocities were retrieved from a spectral analysis around the displacement central frequency. Therefore, the Young’s modulus of the medium (considered as isotropic and non-viscous) could be retrieved using the expression on the left side of Eq. 2.
The technique was first tested mainly on agar-gelatine tissue mimicking samples which simulated the properties of biological tissues. These materials have the advantage of being homogeneous, isotropic, viscoelastic and linear. This method was then employed to perform measurements in the skin and muscles by J. Gennisson [4]. Due to its effectiveness, the technique has been commercialized as Fibroscan® and permits to characterize the liver fibrotic state by giving a global score based on the mean elasticity. This non-invasive imaging technique can avoid performing biopsies in some cases. Fig 1.11 portrays the shear wave displacement simulation with the Green’s function (left) and the wave-front displacement as a function of depth and time in human muscle (right).
15
Fig 1.11. 1D-Transient Elastography. Shear wave displacement as function of the depth and time in (left) a simulated environment and (right) human muscle in vivo[4].
The 1D transient impulse elastrography technique allowed the determination of the Young’s modulus of isotropic materials along the beam axis. However, in order to retrieve the complete 2D Young’s modulus map of the medium, the shear wave front propagation must be tracked in two dimensions with conventional ultrasound probes. Thus, it is necessary to have a ultrasonic frame rate (frequency) high enough to catch the shear wave propagation in real time, which reaches a few meters per second. Therefore, a frame rate of a few thousands of images per second is needed. At that time, the echographic systems were limited to 50 images per second, which was too low for following the shear wave propagation. Hence, an ultrafast imaging system was developed to meet with the high frame rate requirements. Such system was part of a technique initially known as 2D impulse elastography.
1.1.2.2.2 2D Impulse Elastography
Continuing with the development of the one-dimensional impulse elastography technique, some features were upgraded. In 1997, an echographic device used for acoustics time reversal experiments was adapted to perform ultrafast imaging [32] based on the emission of ultrasound plane waves. The system was composed of 128 independent emission\reception channels, each one with a 2 MB memory capacity. The ultrasound signals were sampled at 50 MHz. The transducer was fixed to a mechanical vibrator capable of generating shear waves within the medium at a frequency of 100 Hz (Fig 1.12 - right). The entire system was then controlled by a computer (Fig 1.12 - left). Once the shear wave propagation film was reconstructed, the inversion of the wave equation allowed the retrieval of the complete 2D Young’s modulus map of the medium. This system was known as two-dimensional impulse elastography.
Chapter 1. Elastography: an important medical imaging research field
16
Fig 1.12. (Left) ultrafast imaging system. The electronic system composed by 128 independent channels (emission/reception), allows the acquisition of the echo-signals coming from each of the 128 elements of the probe. The entire system is controlled through a computer. (Right) The ultrasound probe (linear array) is fixed to a vibrator which excites the tissue to generate the shear waves[4].
An ultrafast imaging sequence takes place as follows:
Initially, unlike a conventional echographic device, there is not beamforming during the emission. Therefore, the ultrasonic image is not formed by emitting a series of focused ultrasound beams to cover the complete region of interest (Fig 1.13(a)) but by emitting a single ultrasonic plane wave by all the probe transducers (Fig 1.13(b)) at the same time. The acquired backscattered signals are subsequently saved and post-processed. The displacements generated by the shear wave propagation are then calculated by the cross-correlation of consecutive images as done in the 1D version of the technique. In this way, only a single emission is needed to obtain a complete ultrasound image of the medium. This method allows the acquisition of approximately 8000 raw RF data images per second.
The resolution of the inverse problem in two dimensions of the shear wave propagation permitted the retrieval of the 2D velocity map and therefore the 2D elastic map of the medium.
17
Fig 1.13. (a) Schematic principle of a classical ultrasonic device. The ultrasound waves are focused at emission, with a time interval of about 0.13 ms between the activation of two neighbouring transducer elements. Such systems can reach an imaging frequency of approximately 50 Hz.(b) Ultrafast imaging principle. The medium is imaged after a single emission of a plane ultrasound wave. The shear wave displacements are obtained after post-processing the back-scattered signals. This system can reach an imaging frequency of about 8000 Hz.
The first In vivo experiments with this technique on humans were performed in 2003 with encouraging results [33]. Here, the technique was employed on patients presenting breast lesions. The 2D maps of elasticity showed an important elasticity contrast between the lesions and their healthy surrounding tissue (Fig 1.14). However, the device remained bulky and not very practical for in vivo experiments.
Fig 1.14. Malignant breast tumour (adenocarcinoma): a) The lesion (which is enclosed by the dotted yellow rectangle) appears darker than its surrounding tissue on the echographic image; b) Superposition of the shear modulus map of the same region over the echographic image. The colour-contrast shows that the lesion has a much higher elastic modulus than the surrounding healthy tissue; c) Zoomed shear modulus map of the region of interest [33].
1.1.2.2.3 Acoustic Radiation Force Imaging (ARFI)
The ARFI or Acoustic Radiation Force Method is a dynamic elastography technique method developed by Nightingale et al. [40] in 2001, which uses acoustic radiation force to generate localized tissue displacements that are directly correlated with localized variations in tissue stiffness. These displacements are measured using ultrasonic correlation based methods and their magnitude is inversely proportional to the local tissue stiffness. In this method, focused ultrasound is used to apply localized radiation force (pushing) to small volumes of
Chapter 1. Elastography: an important medical imaging research field
18
tissue (2 to 3 mm) for short durations (less than 1 ms). The resulting tissue displacements are mapped using ultrasonic correlation-based methods [40]. Therefore, the ARFI technique allows to track the tissue displacement and relaxation directly after the radiation force has been applied (Fig 1.15). The temporal properties of such relaxation curves permit the retrieval of information regarding the elasticity and viscosity at the focal point only [41]. Moreover, radiation force induced tissue displacements are generated at multiple locations and combined to build a complete quantitative map of tissue stiffness (Fig 1.16). This increases the time needed to build one entire image [42] as well as the tissue temperature due to multiple “pushing”. This technique has been used to build quantitative elasticity maps on breast , prostate and liver [43][44].
Fig 1.15. 3D finite-element simulation of the shear wave propagation represented as isocontours of displacement at different times after ARFI excitation. The medium was assumed to be purely elastic, with a Young’s modulus of 4 kPa and an acoustic attenuation coefficient of 0.7 dB cm-1
MHz-1. The 0 ms isocontour image portrays the radiation force region of excitation (ROE). The central axis of this displacement profile is the location used to generate qualitative ARFI images as shown in Fig 1.16. The plot in the upper right shows the displacement-through-time profiles at the axial focal depth of the radiation force excitation at three different lateral positions (indicated by the arrows in the isocontour images). Blue, 0 mm; red, 1.5 mm; green, 3 mm [45].
Fig 1.16. Images of a mammary tumour (left) and a melanoma tumour (right) implanted on mice. (Above) ARFI images and (below) the corresponding B-mode images. ARFI imaging uses the acoustic radiation force to generate the “pushing” within the tissue and conventional ultrasonic methods to track their displacements. Although the two tumours are both displayed as slightly anechoic regions in the B-modes images, the mammary tumour appears as a dark, lower displacement region (i.e. stiffer) in the ARFI image, whereas the melanoma tumour appears as a bright higher displacement region (soft) in the ARFI image. Source:
19
1.1.2.2.4 The Supersonic Shear Wave Imaging (SSI) Technic
The SSI technique is a step further in the development of the 2D impulse elastography technique [12]. This dynamic elastography technique born in 2004, utilizes radiation force to excite the medium and generate shear waves and ultrafast imaging to track their displacement. The idea of associating radiation force to the study of generated shear waves comes from Sarvazyan, who introduced the concept of Shear Wave Elasticity Imaging (SWE) in 1998 [46]. It was in 2004 that Bercoff [47] combined two fundamental ideas to overcome the limitations encountered by the 2D elastography technique. These two concepts, radiation force and ultrafast shear wave imaging are the base of the Supersonic Shear Imaging technique. The technique can be subdivided into two basic steps as follows:
The Mach-cone creation: ultrasound waves are focalised successively at different depths to create spherical waves at each focal point. All the generated spherical waves interfere constructively to create a sort of Mach-cone [12] (quasi-plane on the imaging plane and cylindrical in three dimensions) which propagates in opposite directions (Fig 1.17(a)). The constructive spherical wave interference increases the shear wave amplitude and the signal to noise ratio. In the imaging plane, the plane wave front allows the simplification of propagation hypotheses, which is of great interest for the inverse problem. Only one Mach-cone is needed to generate the quasi-plane shear wave fronts that travel across the medium to cover the entire region of interest.
Ultrafast Imaging: ultrasound plane waves are generated to track the shear wave displacement along the entire imaging plane. During a single acquisition, up to 8000 images per second can be acquired. Hence, only one Mach-cone is enough to acquire the complete 2D shear velocity map of the medium (Fig 1.17(b)).
In the SSI technique, the external vibrator employed to generate the shear waves in the 2D impulse elastography technique is replaced by the acoustic radiation force. Therefore, both the excitation and imaging processes are carried out using an ultrasound probe. The generated shear waves have an amplitude (from 0 to the maximum) of several dozens of micrometres and are detectable with a good signal to noise ratio by axial correlation and ultrafast imaging. The latter allows to perform an entire single acquisition in less than 30 ms, imaging in real time the shear wave displacement and permitting the retrieval of the shear wave velocity and the complete 2D quantitative elasticity map of the medium (using Eq. 2 and Eq. 5) with great precision. The Spatial resolution of the elasticity maps obtained with this technique at 8 MHz and 15 MHz are of 1.2 mm and 0.4 mm respectively.
Chapter 1. Elastography: an important medical imaging research field
20
Fig 1.17. The two basic steps of a SSI technique experiment: (a) Generation of the shear wave. (b) Propagation of the quasi-plane wave sources on opposite directions. Acoustic radiation force is used to excite the medium and generate shear waves. Then, by using ultrafast imaging, the shear wave displacement is tracked. Only one Mach-cone is needed to image the entire region of interest. The entire imaging process take less than 30 ms.
The SSI technique is also not very sensitive to breathing movement. As in 2D Impulse Elastography, the shear elasticity maps are obtained by the inversion of the wave equation. Bercoff [47] developed the technique for the first prototypes and acquired the first in vivo images within the frame of his doctorate.
Nowadays, the techniques based on the application of the acoustic radiation force to excite the tissue (ARFI and SSI) are very popular due to the fact that they give very accurate quantitative estimation of the tissue elasticity and being very suitable for in vivo applications. Whereas today ARFI offers a quantitative elasticity value only at one given location at a time, the ultrafast ultrasonic imaging capabilities of the SSI technique give the ability to produce full quantitative elasticity maps of the medium in real time.
Tanter et al [48] performed a first clinical trial of breast cancer imaging using SSI in 2008. The trial showed the capability of the SSI technique to sharply discriminate between benign and malignant lesions in a limited number of patients (N=15). In 2012, Berg et al.[49] showed in a multi-centric clinical study involving a very large cohort of a 939 patients, that the SSI technique offers a very high specificity level which could help improve the ultrasonographic assessment of breast masses. Fig 1.18 presents B-mode images and their corresponding shear wave elastography images (acquired by using the SSI technique) of three different human breast lesions. For the elastographic images, the colour-bar was fixed between 0 and 180 kPa, with black and red representing the lowest and highest elasticity values, respectively. In this case, the SSI measurement of elasticity correlated with the malignancy degree of a biopsy proven grade I infiltrating ductal carcinoma (a), a grade III invasive ductal carcinoma (b) and a fibroadenoma (c).
21
Fig 1.18. B-mode images(bottom) of three different breast lesions and their corresponding elastographic images (top)acquired by using the SSI technique. (a) A 6-mm irregular hypoechoic mass considered to be BI-RADS category 5 in a 58-year-old woman. Biopsy showed grade I infiltrating ductal carcinoma. (b) An oval, circumscribed mass considered to be BI-RADS category 3 in a 67-year-old woman. Shear wave (SW) elastographic image shows that the mass and surrounding tissue are heterogeneously stiff and that the zone of stiffness is irregular, all of which are suspicious findings on an SW elastographic image. Biopsy showed grade III invasive ductal carcinoma. (c) An oval, mostly circumscribed mass considered to be BI-RADS category 4a in a 35-year-old woman. SW elastographic image shows that the mass (arrow) was relatively homogeneously soft. On the basis of the benign appearance on SW elastographic image, this mass could have been considered BI-RADS category 3. Biopsy showed fibroadenoma [49].
Cosgrove [50] performed a study on 758 breast masses that were visible on ultrasound to evaluate the reproducibility of the SSI technique. Fig 1.19 shows the B-mode images (bottom) and their corresponding elastographic (top) images for one of the lesions. For the elastographic images, the colour-bar was fixed between 0 and 180 kPa, with black and red representing the lowest and highest elasticity values respectively. The colourless areas within the Q-boxes (white square) denote the regions with no detectable echo. In order to assess the intraobserver reproducibility (when one observer examines the same material more than once), each observer obtained three consecutive SWE images of 758 masses that were visible on ultrasound. 144 (19%) were malignant. For the interobserver reproducibility (when two or more observers examine the same material), a blinded observer reviewed images and agreement on elastographic features was determined. This clinical study showed that SWE is highly reproducible for assessing elastographic features of breast masses within and across observers. Moreover, it also showed that the SWE interpretation is at least as consistent as that of ultrasound B-mode features.
Chapter 1. Elastography: an important medical imaging research field
22
Fig 1.19. Three sequentially acquired B-mode images and the corresponding Shearwave Elastography images of a breast cancer showing the small changes registered over time. The acquisitions show a high repeatability. The colour-bar represent the lowest and highest elasticity values in black and red respectively [50].
The performed clinical studies proved that the SSI technique is a powerful tool for the detection and characterization of breast lesions with good specificity and reproducibility [49][50]. Nevertheless, there is room for improving the performance of the technique. For instance, it has not been yet proved if the technique can be used to monitor the development and medical treatment of cancer tumours in vivo. The question as to whether cancer tumour characterization can be enhanced with the use of 3D-SWE elastography is answered throughout this work.
Elastography imaging modalities present an added value with respect to other imaging modalities for medical diagnosis, which lies in the contrast observed in the tissue viscoelastic properties that correlate with significant changes in the stroma and connective tissues during disease processes.
In the last two decades, the use of elastography as a medical imaging technique has grown rapidly. New techniques have been developed; some of them with a great applicability as medical imaging tools. However, for some others, their cost, limited mobility and the lack of quantitative information limit their in vivo applicability. Therefore, it is important to have a good understanding of the advantages and limitations of each technique to better exploit them.
1.2 Conclusion
This work focuses on the application of SWE for the characterization and monitoring of cancerous tissues in human beings and mice. Chapter 2 contains the results of a clinical study on patients presenting different kinds of breast abnormalities. The study aimed to evaluate the feasibility of using 3D-SWE and 3D ultrasound to monitor tumour growth and tumour response to neo-adjuvant chemotherapy treatment. In this study, the tumour volumes measured by conventional ultrasound and MRI were correlated.
In Chapter 3, the results of an animal study are presented. In this case, the idea was to understand the pathology underlying stiffness. A representative type of human breast cancer
23
tumour was implanted in the flank of nude mice. The tumour volumes and their global elasticity values were measured by conventional ultrasound and 2D-SWE respectively before and after chemotherapy treatment. Histological analyses were performed to retrieve the percentages of cellularity, fibrosis and necrosis of the tumours.
Continuing with the monitoring of the cancer tumour behaviour pre and post treatment by the SSI technique, the results of a second animal study are presented in Chapter 4. This time, fragments of human colon-rectal tumour were ectopically and orthotopically implanted in mice. The tumour volumes and elasticity values pre and post treatment were measured by ultrasound and the SSI technique respectively. Unlike the study mentioned in Chapter 3, in this study the animals were treated with an antivascular drug to destroy the tumours vascular network and halt their development.
In Chapters 2 to 4, the elasticity is utilized as a biomarker for the tissue characterization. Nevertheless, there exist additional parameters such as elastic non-linearity, which could offer new and precious information on tissue characteristics. Chapter 5 presents the first known 2D-nonlinear elasticity maps of tissue mimicking phantoms and liver beef samples. Here, the third order non-linear parameter is retrieved for a wide range of elasticity values by using a developed technique, which employs a conventional ultrasonic probe and combines both the SSI technique and the Static Elastography concepts to retrieve elastic nonlinearity. Chapter 5 ends by presenting the result of a study performed ex vivo on mice colon samples, in which the technique used to retrieve the non-linear parameter is employed to understand the mechano-transduction processes involved in tumour development in biological tissues. The colon samples were taken from genetically and non-genetically modified mice. Some of the genetically modified mice had developed cancer tumours in the colon. The goal of the experiments was to calculate the amount of intracellular stress needed to trigger the development of cancerous tumours in mouse tissue. The stress was calculated by combining quasi-static compressions with the SSI technique through Hooke’s law.
References
[1] C. Elsberg. “The Edwin smith surgical papyrus and the diagnosis and treatment of injuries to the skull and spine 5000 years ago”. Ann. Med. Hint., 8 pp. 271-279, 1981.
[2] R. J. Dickinson, C. R. Hill. “Measurement of soft tissue motion using correlation between A-Scans”, Ultr. Med. & Bio., 8, No. 3, pp. 263-271, 1982.
[3] A. Eisenscher, E. Schweg-Toffler, G. Pelletier, P. Jacquemard. “La palpation échographique rythmée: Echosismographie. Une nouvelle technique de différentiation des tumeurs bénignes et malignes par l’étude ultrasonore de l’élasticité tissulaire”,
J. Radiol., 64, No. 4, pp. 255-261, 1983.
[4] J.L. Gennisson. “Le palpeur acoustique: un nouvel outil d’investigation des tissus biologiques”, Thèse de Doctorat de l’Université Paris 6 – Pierre et Marie Curie, Septembre (2003).
[5] J. Ophir, I. Cespedes, H. Ponnekanti, Y. Yazdi, X. Li. “Elastography: a quantitative method for imaging the elasticity of biological tissues”. Ultrasonic Imaging, 13, pp. 111-134, 1991.
[6] Itoh A, Ueno E, Toho E et al. “Breast Disease: Clinical Application of US Elastography for Diagnosis”. Radiology, 239(2): 341-350, 2006.