HAL Id: tel-01193103
https://tel.archives-ouvertes.fr/tel-01193103
Submitted on 4 Sep 2015HAL is a multi-disciplinary open access
archive for the deposit and dissemination of sci-entific research documents, whether they are pub-lished or not. The documents may come from teaching and research institutions in France or abroad, or from public or private research centers.
L’archive ouverte pluridisciplinaire HAL, est destinée au dépôt et à la diffusion de documents scientifiques de niveau recherche, publiés ou non, émanant des établissements d’enseignement et de recherche français ou étrangers, des laboratoires publics ou privés.
Objective assessment of stereoscopic video quality of
3DTV
Darya Khaustova
To cite this version:
Darya Khaustova. Objective assessment of stereoscopic video quality of 3DTV. Other [cs.OH]. Uni-versité Rennes 1, 2015. English. �NNT : 2015REN1S021�. �tel-01193103�
ANN ´EE 2015
TH `
ESE / UNIVERSIT ´
E DE RENNES 1
sous le sceau de l’Universit ´e Europ ´eenne de Bretagne
pour le grade de
DOCTEUR DE L’UNIVERSIT ´
E DE RENNES 1
Mention : Informatique
´
Ecole doctorale Matisse
pr ´esent ´ee par
Darya K
HAUSTOVA
pr ´epar ´ee au centre Inria Rennes - Bretagne Atlantique
et `a Orange Labs
Objective
assess-ment
of
stereo-scopic video
qual-ity of 3DTV
Th `ese soutenue `a Rennes le 30.01.2015
devant le jury compos ´e de : Prof. Patrick LECALLET
IRCCyN, Universit ´e de Nantes / Rapporteur Prof. Touradj EBRAHIMI
Ecole Polytechnique F ´ed ´erale de Lausanne / Rapporteur Dr. Mohamed-Chaker LARABI
Maˆıtre de conf ´erences, l’Universit ´e de Poitiers / Examina-teur
Prof. Luce MORIN
INSA, Rennes / Examinateur Prof. Christine GUILLEMOT
Directeur de Recherche, INRIA Rennes / Directeur de Th `ese
Dr. Olivier LEMEUR
Maˆıtre de conf ´erences, l’Universit ´e de Rennes 1 / Co-directeur de Th `ese
Acknowledgments
The three years of my PhD have passed so fast. Though this period has taken about 5% of my lifetime (if to consider that I have 60 deliberate years). Now it is time to summarize.
First of all, I would like to sincerely thank to my supervisors J´erˆome Fournier, Oliver Le Meur and Emmanuel Wyckens. They have managed to support, inspire, encourage and motivate me.
I must express my deepest gratitude to Bernard Letertre, Jean-Charles Gicquel, and Amelie Lachat for their contribution and help with subjective experiments, equipment, discussions and advices.
I particularly thank to my PhD jury members: Patric Le Callet, Touradj Ebrahimi, Chacker Larabi, Luce Morrin, and Cristine Guillemot. I really appreciate all your kind and professional feedbacks about my work and discussion we had during the question session.
Dear colleagues from HEAT team, Orange and SIROCCO, INRIA, I am so grateful for your support, concern and friendship. It would be such a shame to forget somebody’s name here so I would not personalize this paragraph.
It would not be possible to record my fully controlled, located in the zone of comfort stereoscopic 3D videos without my film crew (and actors in the same time): Julien Libouban, Remi Rouaud, Didier Gaubil and Jean-Yves Leseure. Without our 3D clips nobody would ever believe that sunny hot days are possible in Rennes!
I thank to my dear friends Anna, Bogdan, Fabien D., Fabien R., Fanny, Ferran, Lucile, Mael (in alphabetical order) for all their concerns, support and friendship! I am so lucky to know you guys! Fanny thank you so much for being my friend, for your never ending optimism and support in the moments when “¸ca va pas”. Also what an amazing “pot” you have organized for me with the help of other friends!
I appreciate the support of my family during the time I was supposed to support them. Mom, dad, I hope to be able to hug you and to celebrate my diploma soon despite of all the obstacles. . . Vova thank you for always believing in me. I wish you didn’t have to leave time after time. . .
Thank you all!
Contents
Acknowledgments 1
R´esum´e en fran¸cais 9
Introduction 15
1 Human factors in depth perception 19
1.1 Introduction. . . 19
1.2 Principles of depth perception . . . 19
1.2.1 Oculomotor cues . . . 19
1.2.2 Monocular depth cues . . . 20
1.2.3 Binocular depth cues . . . 22
1.2.4 Depth cue interactions . . . 24
1.2.5 Individual differences. . . 25
1.3 The simple stereoscopic imaging system . . . 26
1.3.1 Perceived depth as function of viewing distance . . . 27
1.3.2 Perceived depth as function of screen disparities . . . 28
1.3.3 Artifacts related to S3D visualization . . . 29
1.3.3.1 Cardboard effect . . . 30
1.3.3.2 Size distortion artifacts . . . 30
1.3.3.3 Window violation . . . 30
1.3.3.4 Stereoanomaly . . . 31
1.4 Limits of the HVS in binocular depth perception . . . 31
1.4.1 Fusion range limits . . . 31
1.4.2 Accommodation and vergence limits . . . 32
1.4.3 Extreme convergence and divergence . . . 35
1.5 Conclusions . . . 36
2 Broadcast chain of 3D systems 39 2.1 Introduction. . . 39
2.2 3D content production . . . 40
2.2.1 Controlling the perceived depth with a dual-camera configuration. 41 2.2.2 View alignment problems . . . 45
2.2.3 3D shooting rules. . . 47
2.3 3D visualization. . . 48
2.3.1 Displays with color multiplexed approach . . . 48
2.3.2 Displays with polarization multiplexed approach . . . 49
2.3.3 Displays with time multiplexed approach . . . 49
2.3.4 Head Mounted Displays (HMD) . . . 50 3
4 Contents
2.3.5 Autostereoscopic displays . . . 50
2.3.6 Visualization artifacts . . . 53
2.4 3D representation, coding and transmission . . . 54
2.4.1 3D representation formats . . . 54
2.4.2 Coding, transmission and related artifacts . . . 57
2.5 Conclusions . . . 59
3 Assessment of 3D video QoE 61 3.1 Introduction. . . 61
3.2 3D Quality of Experience . . . 61
3.3 Components influencing 3D video QoE . . . 62
3.3.1 Picture quality . . . 62
3.3.2 Depth quality . . . 62
3.3.3 Visual (dis)comfort and visual fatigue . . . 63
3.3.4 Additional perception dimensions . . . 63
3.4 Models of 3D QoE . . . 64
3.5 Subjective assessment methods of 3D QoE . . . 66
3.5.1 Assessment of visual discomfort and fatigue . . . 70
3.5.1.1 Measurement of the visual discomfort associated with accommodation-vergence conflict and excessive dispari-ties . . . 72
3.5.1.2 Measurement of the discomfort associated with view asym-metries . . . 73
3.6 Objective assessment methods of 3D QoE . . . 74
3.6.1 2D image quality . . . 77
3.6.2 Including depth attribute . . . 78
3.6.3 Including comfort attribute . . . 79
3.7 Conclusions . . . 79
I Visual attention in 3D 81 4 State-of-the-art of visual attention in S3D 83 4.1 Introduction. . . 83
4.2 Visual attention and eye movements . . . 83
4.3 Bottom-up and top-down processes . . . 84
4.4 Eye-tracking. . . 85
4.5 Studies of visual attention in S3D. . . 87
4.5.1 Stimuli: still stereoscopic images . . . 88
4.5.2 Stimuli: stereoscopic videos . . . 89
4.5.3 Analysis of eye movements with state-of-the-art studies . . . 89
4.6 Conclusions . . . 90
5 Studies of visual attention in S3D 93 5.1 Introduction. . . 93
5.2 Experiment 1: simple visual stimuli. . . 93
5.2.1 Stimuli generation . . . 94
5.2.2 Experimental set-up and methodology . . . 95
Contents 5
5.2.3.1 Influence of depth on visual attention . . . 100
5.2.3.2 Influence of texture on visual attention . . . 101
5.2.3.3 Influence of the position of the spheres on test results . . 101
5.2.3.4 Saccade length and fixation duration . . . 102
5.2.3.5 Discussion and conclusions . . . 103
5.3 Experiment 2: complex stimuli with only uncrossed disparity objects . . . 104
5.3.1 Stimuli generation . . . 104
5.3.2 Experimental set-up and methodology . . . 106
5.3.3 Eye-tracking data analysis . . . 106
5.3.3.1 Qualitative analysis based on heat maps. . . 107
5.3.3.2 Quantitative analysis . . . 107
5.3.3.3 Saccade length and fixation duration . . . 109
5.3.3.4 Influence of depth on visual attention . . . 112
5.3.3.5 Influence of texture on visual attention . . . 114
5.3.3.6 Discussion and conclusions . . . 115
5.4 Experiment 3: complex stimuli with crossed disparity objects . . . 116
5.4.1 Stimuli generation . . . 117
5.4.2 Experimental set-up and methodology . . . 118
5.4.3 Eye-tracking data analysis . . . 118
5.4.3.1 Qualitative analysis based on heat maps. . . 119
5.4.3.2 Quantitative analysis . . . 119
5.4.3.3 Saccade length and fixation duration . . . 120
5.4.3.4 Discussion and conclusions . . . 122
5.5 Weighted Depth Saliency Metric proposal for comparison of visual attention122 5.5.1 Algorithm . . . 122
5.5.2 Results . . . 126
5.6 Conclusions . . . 129
II Objective modeling of 3D video QoE 131 6 Objective model for S3D using perceptual thresholds 133 6.1 Introduction. . . 133
6.2 Background and motivation . . . 134
6.3 Objective model proposition . . . 137
6.3.1 Definition of objective categories . . . 137
6.3.2 Subjective color scale proposition . . . 138
6.3.2.1 Color Scale decomposition . . . 140
6.3.3 Definition of the boundaries of objective categories . . . 142
6.3.4 Proposal of Objective Perceptual State Model (OPSM) . . . 142
6.3.5 OPSM validation with subjective experiments. . . 144
6.3.6 Aggregation of technical quality parameters . . . 146
6.3.7 Acceptability and annoyance thresholds comparison . . . 147
6.4 Conclusions . . . 148
7 Metric validation using still S3D images 151 7.1 Introduction. . . 151
7.2 OPSM metric validation. “Color Scale” experiment . . . 151
6 Contents
7.2.2 Experimental set-up and methodology . . . 155
7.2.3 Using the Color Scale for thresholds estimation. “Color Scale” experiment . . . 155
7.2.4 Result analysis of the “Color Scale” experiment . . . 160
7.3 Thresholds comparison . . . 162
7.3.1 “Acceptability Scale” experiment . . . 165
7.4 Methodology development. “Double Scale” experiment . . . 167
7.4.1 Result analysis of “Double Scale” experiment . . . 167
7.5 Comparison of Color Scale with Acceptability and Impairment Scales. . . 172
7.6 Conclusions . . . 173
8 Metric verification with stereoscopic videos 175 8.1 Introduction. . . 175
8.2 OPSM metric verification with S3D videos. . . 175
8.2.1 Stimuli generation . . . 175
8.2.2 Experimental set-up and methodology . . . 178
8.2.3 Result analysis . . . 179
8.2.3.1 Stereoscopic video versus images: thresholds comparison 180 8.2.3.2 Stereoscopic video versus images: data comparison . . . . 183
8.3 Aggregation of technical quality parameters . . . 184
8.3.1 Stimuli generation . . . 185
8.3.2 Result analysis . . . 186
8.3.2.1 Agregation of green and vertical shift asymmetries . . . . 186
8.3.2.2 Agregation of focal and vertical shift asymmetries . . . . 188
8.4 Conclusions . . . 189
Conclusion 191 A Supplementary information for Chapter 5 195 A.1 Pearson correlation coefficient (CC) . . . 195
A.2 Area Under Curve (AUC) . . . 195
A.3 Measuring the inter-observer congruency (IOVC) . . . 197
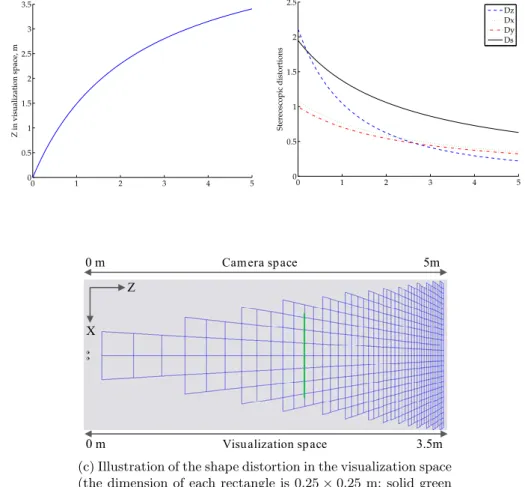
A.4 Camera space z versus visualization space Z. Stereoscopic distortions in visualization space Z . . . 198
A.5 CC, AUC, IOVC data . . . 204
A.6 Results: depth metric . . . 207
B Supplementary information for Chapter 7 209 B.1 Supplementary information for Section 7.5 . . . 210
C Instruction sheets used in subjective experiments 211 C.1 Images: Color Scale experiment . . . 211
C.2 Acceptability experiment . . . 213
C.3 Images: Doubles Scale experiment . . . 214
C.4 Videos: Color Scale experiment . . . 215
D Graphical interfaces of subjective experiments 217
Contents 7
Bibliography 241
List of Figures 243
R´
esum´
e en fran¸
cais : Evaluation
objective de la qualit´
e vid´
eo en
TV 3D relief
Introduction
Les mesures de distorsion spatiale et temporelle habituellement utilis´ees pour tester la qualit´e des contenus st´er´eoscopiques ´etaient jug´ees insuffisantes car les notions de profondeurs d’image devaient ˆetre ´egalement consid´er´ees. Par cons´equent, le terme de qualit´e d’exp´erience [Le Callet et al., 2012] (QoE) a ´et´e red´efini afin de caract´eriser l’exp´erience utilisateur des images st´er´eoscopiques dans sa globalit´e. La recommanda-tion ITU-R BT.2021-13 prend en compte trois axes des perceprecommanda-tions primaires influen¸cant la qualit´e per¸cue, la qualit´e intrins`eque, la profondeur et le confort visuelle des images [ITU, 2012a].
Les probl`emes li´es au confort visuel r´esulteraient des d´eficiences visuelles des t´el´espectateurs. Par exemple Solimini et al. ont conduit une ´etude sur une large vari´et´e de films en st´er´eoscopie. 953 questionnaires provenant des spectateurs ont ´et´e collect´es o`u 60.4% d’entre-eux ont ´evoqu´e des probl`emes de fatigue visuelle, vision double, vertige, mal de tˆete, naus´ee, de palpitation durant le visionnage du film [Solimini et al., 2012]. Par cons´equent, dans le cas d’images st´er´eoscopique 3D, les exigences minimales sur les performances du syst`eme seraient de n’avoir aucun inconfort visuel.
Actuellement, le test subjectif est le moyen la plus adapt´ee pour refl´eter l’opinion des observateurs ou des clients sur la qualit´e d’un service propos´e. Cependant, les services temps r´eel n´ecessitent l’usage de m´etriques objectives capables de pr´edire et le surveiller la qualit´e `a la vol´ee. Aussi, ces mesures doivent ˆetre capables de garantir un niveau de qualit´e vid´eo suffisante pour les utilisateurs. Par cons´equent, les objectifs de cette th`ese sont orient´es vers ces diff´erents volets pr´ecit´es. Tout d’abord, nous investiguons sur l’attention visuelle en 3D afin de concevoir une nouvelle m´etrique objective. Ensuite, il est n´ecessaire d’adapter les m´etriques selon les besoins d’un service, par exemple, sur le niveau d’acceptabilit´e.
´
Etat de l’art
La disparit´e binoculaire n’est pas la seule source d’information pour ´evaluer la pro-fondeur. Bien qu’avec des syst`emes st´er´eoscopiques, l’am´elioration de la perception de la profondeur est g´en´er´ee principalement par la disparit´e binoculaire. La sensation de profondeur apparait quand le cerveau fusionne deux images plates l´eg`erement diff´erentes. Cependant, les limitations du syst`eme visuel humain peuvent influencer la perception de
10 R´esum´e en fran¸cais
profondeur avec un syst`eme 3D en relief. Par exemple, des conflits peuvent apparaitre quand la divergence entre images est trop grande ou quand le syst`eme visuel humain est sensible `a des vues non naturelles. De tels conflits peuvent cr´eer des inconforts vi-suels, lesquels pourraient ˆetre ´evit´es si les sc`enes reconstruites ´etaient pr´esent´es dans une zone de confort visuel limit´e `a 0.2 dioptrie. De plus, la quantit´e de profondeur per¸cue d´epend de la taille de l’´ecran et de la distance de visualisation. Par cons´equent, quand nous ´etudions la perception de profondeur, il est n´ecessaire d’inclure la distance de visualisation, la disparit´e entre vue afin de g´en´eraliser les r´esultats.
Les param`etres techniques de la chaine de diffusion de contenus 3D TV peuvent avoir un impact potentiel sur l’exp´erience utilisateur. Au niveau de la production de contenus, trois param`etres de prise de vue influencent la profondeur per¸cue, la distance focale, baseline , la distance de convergence; au niveau de la visualisation, les param`etres humain sont la distance binoculaire, la largeur de l’´ecran, et la distance di visualisation. Ainsi, l’absence de maitrise des param`etres de prise de vue et de l’environnement de visualisation entravent la production de r´esultats. De plus, la qualit´e de la perception de la profondeur est bas´ee sur l’absence d´efauts visuels. Ces imperfections peuvent ˆetre produits a chaque niveau de la chaine de diffusion c’est-`a dire, `a la production des contenus, au codage, `a la transmission et `a la visualisation. Par cons´equent, il est tr`es important de prendre en compte l’impact de la technologie afin d’´eviter des coˆuts de production prohibitifs.
La recommandation ITU-R BT.2021-13 fixe trois dimensions primaires perceptuelles, lesquelles influence la QoE per¸cue, la qualit´e de l’image, la qualit´e de la pro-fondeur, le confort visuel [ITU, 2012a]. Il a ´et´e prouv´e que ces trois composantes de base de la QoE 3D peuvent avoir un lien direct entre les param`etres de qualit´e techniques contrairement aux composants perceptuels de plus niveau (na-turel, sentiment de pr´esence). Pour la qualit´e de la profondeur, l’´etat de l’art montre que ce concept est assez difficile `a interpr´eter par les observateurs, d’o`u les possibilit´es de trouver des indicateurs plus repr´esentatifs. Finalement, les im-ages st´er´eoscopiques non correctement captur´ees et rendus peuvent induire un incon-fort visuel, lesquelles ont un impact sur la QOE globale et ind´ependamment de la qualit´e de l’image [Tam et al., 1998,Kaptein et al., 2008]. Les conflits d’accommodation [Yano et al., 2004, Lambooij et al., 2007, Hiruma and Fukuda, 1993] et des asym´etries entre les vues sont des sources manifestes d’inconfort visuel pour les syst`emes 3D [Kooi and Toet, 2004, Chen, 2012]. Par cons´equent, importe quel service 3D devrait minimiser l’inconfort visuel per¸cu pour ces client regardant ce service. Il serait donc int´eressant de caract´eriser objectivement l’impact des param`etres techniques afin de surveiller la qualit´e per¸cue des images st´er´eoscopiques.
Le panorama des m´etriques objectives pour l’´evaluation de la QoE 3D d´emontre que la plupart des m´etriques existantes sont adapt´es de l’´evaluation de la qualit´e 2D. De tel m´etriques ne sont pas en mesure de d´etecter des probl`emes provenant du confort visuel. N´eanmoins, les m´etriques existantes en 3D n’ont pas incluses toutes les sources d’inconfort visuel. Par cons´equent, nous concluons que les m´etriques pour la QoE 3D actuelles sont perfectibles et doivent ˆetre amend´ees a) avec les dimensions perceptuelles primaires, b) avec la technologie des ´ecrans et format, c) l’environnement de visualisa-tion (taille de l’´ecran, distance de visualisation). Un tel mod`ele sera donc capable de mesurer la qualit´e des images st´er´eoscopiques mais ´egalement son rendu. Si l’une de ces composantes est absente, il devient alors difficile de conclure sur la qualit´e d’exp´erience pour les images 3D.
R´esum´e en fran¸cais 11
cr´eation d’une m´etrique de la qualit´e objective en 3D. La seconde partie de la th`ese est d´edi´e `a la conception d’un mod`ele QoE 3D lequel est bas´e sur les seuils de perception humain et le niveau d’acceptabilit´e (voir Figure 1).
Part I:
Visual
attention in 3D
State-of-the-art
modeling of 3D QoE
Part II:
Objective
Chapter 1: Human factors in depth perception Chapter 2: Broadcast chain of stereoscopic systems Chapter 3: Assessment of 3D video QoE Chapter 4: Visual attention in 3D Chapter 6:
Objective model for S3D
Chapter 7: Metric
validation using still S3D images Chapter 8: Metric verification with stereoscopic videos Chapter 5: Assessment of visual attention in 3D
Figure 1: Pr´esentation des chapitres de th`ese.
Partie I: attention visuelle dans un contexte 3D
La premi`ere partie de cette th`ese introduit l’´etat de l’art relatif `a l’attention visuelle. L’analyse d’´etudes r´ecentes permet de comparer l’attention visuelle `a la fois dans des conditions st´er´eoscopiques et dans des conditions de visualisation non-st´er´eoscopiques. Il est int´eressant de noter le manque de consensus d’une part sur les indicateurs utilis´es et d’autre part dans les conditions exp´erimentales. Par ailleurs, la plupart des ´etudes ne prennent pas en consid´eration la zone de confort visuelle lorsqu’un contenu est affich´e en condition 3D. Par cons´equent, l’absence de standard ou de protocole sur la fa¸con d’effectuer des tests de suivi de regard ne facilite pas la g´en´eralisation et l’analyse des ´
etudes actuelles.
A partir ces ´etudes, nous pr´esentons trois ´etudes exp´erimentales pour comparer le d´eploiement de l’attention visuelle dans un contexte de visualisation 2D et 3D st´er´eoscopique sur des images fixes. Les stimuli sont parfaitement contrˆol´es `a la fois durant leur cr´eation et leur affichage. Cela permet d’´etudier l’impact sur l’attention visuelle de diff´erents niveaux de disparit´es binoculaire (incluant des niveaux entraˆınant un inconfort visuel) ainsi que des niveaux de complexit´es diff´erents de texture. Les exp´erimentations sont men´ees grˆace `a un oculom`etre et un ´ecran 3D. Les fixations visuelles collect´ees sont utilis´ees pour construire des cartes de saillance. Ces cartes repr´esentant les zones de saillance en 2D ou en 3D sont analys´ees afin de d´eterminer le
12 R´esum´e en fran¸cais
degr´e de similarit´e entre d´eploiement oculaire.
L’objectif de la premi`ere exp´erimentation est d’´etudier l’influence de la profondeur sur l’attention. 28 observateurs ont ´et´e impliqu´es dans cette exp´erimentation. Les stimuli sont des sc`enes simples avec une disparit´e crois´ee ou non crois´ee. Un test univari´e de significativit´e (ANOVA) est utilis´e et montre que le facteur texture est plus important que le facteur profondeur pour la s´election des objets. Les objets avec disparit´e crois´ee sont plus importants comparativement `a une visualisation 2D. Cependant, pour une disparit´e non crois´ee, aucune diff´erence significative est observ´ee entre objet visualis´e en 3D ou en en 2D. L’analyse des mouvements oculaires ne r´ev`ele pas de diff´erences sur les amplitudes de saccades. Les dur´ees de fixations sont cependant significativement plus longues dans des conditions de visualisation st´er´eoscopiques que pour une visualisation en 2D. Nous pensons que ces r´esultats peuvent ˆetre utilis´es pour affiner la conception des mod`eles de saillance dans un contexte 3D.
L’objectif de la seconde exp´erimentations est de confirmer les r´esultats pr´ec´edents sur des stimuli complexes. 6 sc`enes pr´esentant diff´erentes structures sont g´en´er´ees avec le logiciel Blender. Pour ces sc`enes, les param`etres suivants sont modifi´es : complexit´e de la texture et la profondeur de la sc`ene (en modifiant l’´ecart entre les cam´eras et la distance de convergence). Les observateurs impliqu´es dans l’exp´erimentation de suivi de regard, regardent les sc`enes de fa¸con libre (exp´erimentation sans tˆache) avec des niveaux de profondeur et de complexit´es de texture vari´es. Pour ´eviter un effet m´emoire, chaque observateur ne voit qu’une seule fois une sc`ene donn´ee. 135 observateurs (106 hommes et 39 femmes ˆag´es de 21 `a 60 ans) participent `a l’exp´erimentation. Chaque sc`ene est regard´ee par 15 observateurs. Les donn´ees collect´ees sont utilis´ees pour construire des cartes de saillance afin d’analyser l’impact des diff´erentes conditions de visualisation. Les r´esultats indiquent l’introduction de la disparit´e tend `a r´eduire l’amplitude de saccades. Cependant, la dur´ee de fixation n’est pas affect´ee. L’analyse des cartes de saillance ne r´ev`ele pas de diff´erence entre les conditions 2D et 3D pour une dur´ee de visualisation de 20 secondes. Nous n’avons pas constat´e que le confort (inconfort) visuel engendrait une modification de l’attention visuelle.
L’objectif de la troisi`eme exp´erimentations est de compl´eter l’´etude pr´ec´edente avec des images qi seront affich´ees en disparit´es crois´ees. 51 observateurs participent `a l’exp´erimentation. Il a ´et´e observ´e que plus la disparit´e crois´ee ´etait importantes plus l’observateur focalise son attention sur l’objet (affich´e avec une disparit´e crois´ee). Cette observation reste valable lorsque l’objet apparaˆıt dans la zone d’inconfort visuel (en-gendr´e par une disparit´e crois´ee excessive). En outre, aucune preuve ne permet de dire qu’une disparit´e excessive influence le d´eploiement oculaire.
Finalement, une nouvelle m´etrique utilisant carte de profondeur et carte de sail-lance est propos´ee afin de comparer les strat´egies visuelles dans des conditions visuelles diff´erentes. La m´etrique permet de comparer notamment l’attention visuelle en 2D et en 3D ainsi que pour des param`etres d’affichage et de texture diff´erents. Les r´esultats obtenus confirment les conclusions des tests de suivi de regard.
Partie II: un mod`
ele objectif de la QoE vid´
eo 3D
Cette partie de la th`ese d´efinit un mod`ele permettant de pr´edire la QoE 3D et propose des crit`eres d’´evaluation associ´es `a trois axes perceptuels de la QoE. Tenant compte de l’importance, pour tout syst`eme 3D, de garantir un confort visuel `a ses t´el´espectateurs le mod`ele est r´eduit `a une m´etrique objective de la pr´ediction du confort visuel. Lorsqu’un
R´esum´e en fran¸cais 13
niveau de distorsion provoquant un inconfort est d´etect´e, il peut ˆetre class´e automa-tiquement dans une cat´egorie repr´esent´ee par une couleur : (1) Vert – pas de gˆene visuelle, (2) Orange - acceptable, mais induit une gˆene visuelle, (3) Rouge - niveau de gˆene inacceptable. La fronti`ere entre les cat´egories “Vert” et “Orange” d´efinit le seuil de gˆene visuelle, tandis que la fronti`ere entre le “Orange” et “Rouge” d´efinit le seuil d’acceptabilit´e. Potentiellement, les seuils de visibilit´e pourraient ´egalement ˆetre in-troduits dans la m´etrique en cr´eant une cat´egorie suppl´ementaire dite “Jaune”, o`u un d´efaut est visible mais non gˆenant, donc acceptable.
De plus, la m´etrique propos´ee utilise les seuils perceptuels pour d´efinir l’impact des param`etres techniques sur l’axe du confort visuel dans la QoE de la vid´eo st´er´eoscopique. Apr`es une mesure objective des param`etres techniques et la comparaison avec les seuils perceptuels, les cat´egories de couleurs refl`etent le jugement des spectateurs bas´e sur le niveau d’acceptabilit´e et la gˆene visuelle induite. De plus, il a ´et´e propos´e de cr´eer une ´
echelle subjective se basant sur les cat´egories de couleur du mod`ele objectif. Cela permet d’´etablir un lien direct entre les exp´eriences subjectives et les pr´edictions objectives. Les avantages de l’approche propos´ee sont la possibilit´e d’omettre la pr´ediction des notes MOS et d’ajuster la m´etrique en fonction du niveau d‘acceptabilit´e et de gˆene visuelle de l’usager. De plus, la m´ethode ne d´epend pas d’une technologie 3D pr´ecise et aucune r´ef´erence n’est requise pour pr´edire l’inconfort visuel.
La m´etrique propos´ee est ensuite valid´ee par des tests subjectifs avec des images st´er´eoscopiques fixes et anim´ees pr´esentant diff´erents niveaux d’asym´etrie. L’utilisation du mod`ele propos´e comme ´echelle de couleur subjective a d´emontr´e qu’il ´etait possible d’obtenir directement et en mˆeme temps les seuils d’acceptabilit´e et de gˆene visuelle grˆace `
a l’´echelle de couleur. Toutefois, ces seuils ne sont pas les mˆemes lorsqu’ils sont ´evalu´es avec des ´echelles standards. Les diff´erences de valeur des seuils d’acceptabilit´e ont ´et´e expliqu´ees par des concepts d’´evaluation diff´erents : le premier refl`ete l’acceptabilit´e globale, le second ´evalue l’acceptabilit´e en fonction de l’acceptation du niveau de gˆene caus´e par la distorsion. Fondamentalement, l’acceptabilit´e est pond´er´ee par la gˆene vi-suelle. De mˆeme, elle peut ˆetre pond´er´ee par d’autres crit`eres d’´evaluation (distorsion g´eom´etrique, flou, bruit, etc.) Nous croyons que la m´etrique de couleur propos´ee pour-rait ˆetre transf´er´ee `a l’´evaluation d‘autres technologies o`u les d´egradations peuvent ˆetre mesur´ees et associ´ees `a des seuils perceptuels.
Finalement, la m´etrique propos´ee est ´egalement utilis´ee avec des s´equences vid´eo st´er´eoscopiques contrˆol´ees. La performance de la m´etrique est ´evalu´ee en comparant les pr´edictions objectives avec des notes subjectives pour diff´erents niveaux d’asym´etrie pouvant provoquer un inconfort visuel. La comparaison des seuils d’acceptabilit´e pour des images fixes et anim´ees a montr´e des r´esultats significativement ´equivalents. Par cons´equent, les niveaux d’acceptabilit´e obtenus pour des images 3D fixes peuvent ˆetre r´eutilis´es pour des vid´eos S3D. De plus, nous cherchons `a ´evaluer l’impact sur les pr´edictions objectives de deux asym´etries agr´eg´ees sur un mˆeme stimulus. Il a ´et´e d´emontr´e que les jugements sur l’agr´egation d’asym´etries g´eom´etriques sont majoritaire-ment bas´es sur un d´ecalage vertical global : 82% pour un d´ecalage vertical et 18% pour l’agrandissement. Tandis que l’agr´egation d’une asym´etrie verte et d’un d´ecalage verti-cal montre un impact quasi ´equivalent sur le jugement des sujets : 45% pour l’asym´etrie verte et 55% pour le d´ecalage vertical.
14 R´esum´e en fran¸cais
Conclusions
La premi`ere partie de cette th`ese explore l’importance de l’attention visuelle dans la conception d’une m´etrique de qualit´e objective de la 3D. La strat´egie d’observation des sujets pour des images st´er´eoscopiques fixes localis´ees `a l’arri`ere de l’´ecran est similaire `
a celle utilis´ee pour des images 2D. Le regard est plutˆot guid´e par la saillance des objets que par la quantit´e de disparit´es d´ecrois´ees. Par cons´equent, dans la seconde partie de cette recherche l’effet de l’attention visuelle en 3D n’est pas consid´er´e sachant que la plupart des contenus produits pour le cin´ema ou la t´el´evision sont des contenus avec des disparit´es d´ecrois´ees.
Il a ´et´e conclu que les objets avec des disparit´es crois´ees attirent le maximum d’attention: plus il y a de disparit´es crois´ees, plus l’attention visuelle est dirig´ee sur cette partie de l’image. De plus, aucun r´esultat n’a montr´e que l’inconfort visuel g´en´er´e par des disparit´es excessives influence la fa¸con dont nous observons les images.
Finalement, une nouvelle m´etrique utilisant carte de profondeur et carte de sail-lance est propos´ee afin de comparer les strat´egies visuelles dans des conditions visuelles diff´erentes. La m´etrique permet de comparer notamment l’attention visuelle en 2D et en 3D ainsi que pour des param`etres d’affichage et de texture diff´erents. Les r´esultats obtenus confirment les conclusions des tests de suivi de regard.
La seconde partie de la th`ese a ´et´e d´edi´ee `a l’´elaboration d’un mod`ele objectif de QoE pour la vid´eo S3D, bas´e sur les seuils perceptuels humains et les niveaux d’acceptabilit´e. Les r´esultats des exp´eriences subjectives avec des images st´er´eoscopiques fixes et anim´ees ont montr´e de fortes corr´elations entre les notes subjectives et les pr´edictions objectives faites en utilisant les seuils perceptuels obtenus pour toutes les asym´etries test´ees (avec au minimum r=0,87). Cela implique qu’il est possible de classifier le param`etre technique mesur´e dans une des cat´egories objective, en utilisant les niveaux d’acceptabilit´e et de gˆene visuelle correspondant. Il a aussi ´et´e ´etablit que la mesure objective peut ˆetre utilis´ee comme une ´echelle subjective pour ´evaluer les niveaux d’acceptabilit´e et de gˆene visuelle en mˆeme temps.
L’avantage de cette m´etrique est qu’elle peut ˆetre ajust´ee en accord avec les attentes marketing, techniques ou d’autres domaines en changeant le pourcentage d’acceptabilit´e ou le niveau de gˆene visuelle, e.g. adaptation de la largeur des cat´egories objectives. L’acceptabilit´e d´epend de l’acceptation du niveau de gˆene caus´e par la distorsion. Fon-damentalement, l’acceptabilit´e est pond´er´ee par la gˆene visuelle. De fa¸con similaire, elle peut ˆetre pond´er´ee par d’autres crit`eres (distorsion g´eom´etrique, flou, bruit, etc.) Nous croyons que la m´etrique de couleur propos´ee pourrait ˆetre transf´er´ee `a l’´evaluation d‘autres technologies o`u les d´egradations peuvent ˆetre mesur´ees et associ´ees `a des seuils perceptifs. Cependant, des tests compl´ementaires doivent ˆetre effectu´es pour v´erification.
Introduction
Motivations and objectives
The major objective of this thesis is to consider an industrial need for an objective video quality characterization on the fly. The main idea is to use three color labels for a categorization of video sequences: green, orange and red. Each color category is linked to perceived video quality by perceptual thresholds. For example, acceptability, visibility and visual annoyance levels can serve as perceptual thresholds. Adjustable acceptability level makes this idea useful for marketing or service applications, which set sometimes requirements to video quality in terms of acceptability.
The proof of described concept is done using stereoscopic 3D video sequences. The reason of such choice is the added perceptual depth dimension. Thus, the measure of spatial and temporal distortions usually used in 2D video to assess the video quality of stereoscopic content became incomplete.
The term Quality of Experience [Le Callet et al., 2012] (QoE) was proposed to char-acterize the overall viewing experience of stereoscopic images. Recommendation ITU-R BT.2021-13 determines three primary perceptual dimensions, which influence the per-ceived QoE: picture quality, depth quality, and visual comfort [ITU, 2012a].
The problems with visual comfort dimension resulted in raised concern about possi-ble side effects on spectators’ health. For instance, Solimini et al. has conducted survey during various stereoscopic movies. 953 questionnaires of spectators have been col-lected and 60.4% of individuals reported at least one symptom related to tired eyes, double vision, headache, dizziness, nausea and palpitation while watching a movie [Solimini et al., 2012]. Hence, in case of stereoscopic 3D (S3D), the minimum require-ment for the stable system performance should be absence of visual discomfort.
Currently a subjective assessment is a convenient way to reflect opinion of the viewers or customers about the quality of proposed service. However, the real-time services require objective metrics that are able to predict and monitor the video quality on the fly. Also it should be able to guaranty certain quality level of provided video to end users.
Therefore, the objectives of this thesis are:
• To investigate the interest of visual attention in 3D for designing of a new objective metric.
• To propose a new objective model, which links tangible aspects of viewing experi-ence with the 3D technological parameters.
• To consider the possibility to tune the designed metrics based on different service requirements, for example, acceptability level.
16 Introduction
Thesis outline
The schematic overview of the thesis chapters is presented in Figure2below.
Part I:
Visual
attention in 3D
State-of-the-art
modeling of 3D QoE
Part II:
Objective
Chapter 1: Human factors in depth perception Chapter 2: Broadcast chain of stereoscopic systems Chapter 3: Assessment of 3D video QoE Chapter 4: Visual attention in 3D Chapter 6:
Objective model for S3D
Chapter 7: Metric
validation using still S3D images Chapter 8: Metric verification with stereoscopic videos Chapter 5: Assessment of visual attention in 3D
Figure 2: Overview of the thesis chapters.
Chapter1explains the mechanisms of human depth perception followed by a description of the functional principles of simple stereoscopic stereoscopic systems (S3D systems). The major advantage of such systems is an enhanced depth perception. Hence, depth perception is reviewed considering viewing distances, screen disparities and possible vi-sualization artifacts. In artificial vivi-sualization environment, the limitations of the HVS can result in visual discomfort and visual fatigue. Therefore, the concept of comfortable viewing zone is described.
Chapter2 discusses the impact of different technologies at every stage of the broadcast chain on final user viewing experience in detail. The basic principles of stereoscopic content acquisition and generation, 3D shooting rules, data representation, coding, and transmission and display technologies are presented.
Chapter3introduces the definition of 3D QoE and discusses what the quality means for 3D images and video. Then the existing models of 3D QoE are reviewed. Considering that a minimum system requirement for any stereoscopic system is to guarantee visual comfort for its viewers, we review subjective and objective ways of 3D QoE assessment with an emphasis on this issue. Moreover, the inherent properties of a comprehensive objective metric for the objective 3D QoE are discussed.
The first part of this thesis consists of two chapters (Chapter 4 and Chapter 5) and investigates whether visual attention of the viewers should be considered when designing an objective 3D quality metrics.
Introduction 17
Chapter4introduces the state-of-the-art studies about visual attention and the methods to compare visual attention qualitatively and quantitatively. It also provides a review of recent studies comparing visual attention for S3D and 2D conditions.
In Chapter 5presents three subjective experiments which aim to investigate an impact of depth on visual attention. First, the visual attention in 2D and 3D is compared using simple test patterns. The conclusions of this first experiment are validated using complex stimuli with crossed and uncrossed disparities. In addition, we explore the impact of visual discomfort caused by excessive disparities on visual attention. Lastly, the new objective depth metric is proposed in accordance with the subjective test results. This metrics allows comparing visual attention between 2D and 3D conditions as well as 3D conditions with different amount of depth.
The second part of the thesis is composed of three chapters (Chapter 6, Chapter 7
and Chapter 8) and dedicated to the design of an objective model of 3D video QoE. The Chapter 6presents a new objective model that uses perceptual thresholds to define the impact of technical parameters on the 3D video QoE. After objective measurement of 3D technical parameters and comparison with perceptual thresholds, it should be pos-sible to predict evoked perceptual state, which reflects the viewers’ categorical judgment based on stimulus acceptability and induced visual annoyance. The proposed model can be used as subjective color scale, where color category reflects the subjective judgments about a perceived stimulus.
Taking into account that the most important task for any 3D system is to guarantee visual comfort to its viewers, the model was tested for prediction of visual comfort. The goal of Chapter 7 is to verify proposed model comparing predicted categories with the votes from subjective test. Additionally, the possibility to use the proposed model as a new subjective scale is explored. For the validation of proposed model, subjective experiments with fully controlled still stereoscopic images with different types of view asymmetries are conducted. Finally, perceptual thresholds obtained with the proposed subjective scale are compared to the thresholds obtained with conventional assessment methods using impairment and acceptability scales.
Chapter 8 validates the proposed model with stereoscopic video sequences as well as compares perceptual thresholds for still and moving images. The metric performance is evaluated by comparing objective predictions with subjective scores for various levels of view discrepancies, which might provoke visual discomfort. Furthermore, this chapter explores how objective predictions should be affected if two view asymmetries were aggregated in a single stereoscopic stimulus.
Chapter 1
Human factors in depth
perception
1.1
Introduction
Currently there is nothing surprising about watching 3D movies, sporting events, or advertisements in cinemas or at home. Enhanced depth perception, sense of presence, and naturalness are some of the many reasons why 3D has become so widespread. But the most important reason is probably the improved entertainment experience. Besides entertainment, 3D technology can be applied in areas such as video games, medicine, telecommunications, robotics, and engineering.
All existing 3D systems are based on the principles of human depth perception. Thus, the first chapter of this thesis explains its basic mechanisms in relation with the Human Visual System (HVS) followed by a description of the functional principles of simple stereoscopic systems.
1.2
Principles of depth perception
The HVS is endowed with the ability to reconstruct the three-dimensional world from two-dimensional images projected onto the retinas. The perceived depth is established through a variety of depth cues. These cues can be divided into three major groups: (1) Oculomotor – the cues based on the physical abilities of our eye muscles and lenses; (2) Monocular – the cues that require information from a single two-dimensional view; and (3) Binocular – the cues that extract information from both eyes [Goldstein, 2013]. The following sections give a detailed overview of the cues from each group.
1.2.1 Oculomotor cues
Oculomotor cues require feedback from muscles in the eye to provide information to the brain about the locations of objects in space. This muscular reaction causes vergence and accommodation of the eye [Holliman, 2003].
Vergence occurs when the eyes are moving inward or outward to insure that an object being fixated upon can be projected into the central part of the retinas. If an object of interest is located nearby, the eyes converge to fixate on it. However, when the object of interest moves away, the eyes diverge. This principle is demonstrated in Figure 1.1.
20 Chapter 1
Furthermore, the distance between objects can be estimated by measuring the angle between the optical axes of two eyes.
(a) Man looks at the horizon(the optical axes of his eyes are in op-tical infinity)
(b) Man looks at the object 5 cm away (the optical axes of his eyes converge at the distance of 5 cm)
Figure 1.1: Eyes convergence principle from [Goldstein, 2013].
Accommodation occurs when the eyes are focusing on an object of interest to perceive it in a sharpened manner. During this process, depending on the distance, the shape of the eye lens is changes due to the ciliary muscles, while the focused object remains projected onto the retina. Points situated outside of the accommodated area cannot be properly projected onto the retina and are perceived as blurred within the limit of±0.2 diopters [Yano et al., 2004]. This limit is known as the Depth of Focus (DoF) and it is located around the accommodation distance. The size of the DoF diminishes when the pupil diameter increases and expands when the pupil diameter decreases.
When the eyes fixate on an object of interest, the lens focuses to keep the perceived object sharp. Thus, accommodation and vergence intrinsically interact with each other [Suryakumar et al., 2007,Polak and Jones, 1990]. Basically, the amount of accommoda-tion needed to focus an object is proporaccommoda-tional to the amount of vergence appropriate to fixate the same object in the center of each retina. However, vergence is mostly driven by disparity [Stark et al., 1980] and it is more effective than accommodation at close distance estimation [Cutting and Vishton, 1995, Tresilian et al., 1999], whereas accom-modation is guided by retinal blur [Phillips and Stark, 1977].
1.2.2 Monocular depth cues
Monocular cues estimate depth relying only on information from one eye. There are two categories of monocular cues: pictorial cues, which provide depth information from static 2D images and movement-based cues, which extract depth information from changes in retinal images over time, i.e. from movement. Accommodation, as described in the previous section, is also considered a monocular cue.
Principles of depth perception 21
The most important pictorial cues [Goldstein, 2013, Holliman, 2003,
Cutting and Vishton, 1995,Mendiburu, 2009] are listed below:
• Occlusion: occurs when one object partially covers another object. It suggests that the occluded object is farther away (see Fig. 1.2.a).
• Relative size: the sizes of similar objects on the retina are estimated. Closer objects result in larger retinal images.
• Relative height: the vertical position of the point in the visual field is estimated. Thus, objects which are closer to the horizon are seen as being further away. • Texture gradient: repetitive patterns look smaller and denser as the distance
in-creases (see Fig.1.2.b).
• Aerial perspective: due to the presence of particles in the air (moisture, pollution), distant objects look less saturated and sharp. Moisture in the air can cause a color shift towards blue and pollution towards gray or brown colors [Mendiburu, 2009]. • Linear perspective: parallel lines seem to converge and recede to the horizon. • Shadows: reflections or shadows casted by an object can give an idea about its
location [Coren et al., 1994]. For example, without shadows, the blue cars seem to be located on the ground in Figure 1.2.c. However, when shadows are added, some of the blue cars appear to float in the air (see Fig. 1.2.d).
(a) Occlusion (b) Texture gradient
(c) No-shadows (d) Casted shadows
22 Chapter 1
All pictorial cues take place when the observer’s position and scene are station-ary. When motion is added, other mechanisms complement depth perception. Gold-stein defines two motion-produced cues: motion parallax and deletion/acceleration [Goldstein, 2013].
Motion parallax occurs when the movement of an observer or a scene induces change in the relative position of near and far objects on the retina. Relative retinal positions of near objects change faster than farther ones. This information is used by the HVS to extrapolate depth from the scene. Absolute depth information can be estimated when the speed and the direction of the movement are known [Ferris, 1972]. Finally, deletion and acceleration occurs when the observer moves through the environment and a near object covers or uncovers a more remote object [Kaplan, 1969].
1.2.3 Binocular depth cues
Binocular vision seems to be natural to us, but in fact our brain has to solve the complex problem of interpreting 2D retinal projections of the scene into a 3D perception. For example, in Figure 1.3 the yellow car is projected differently to each eye. It happens because each eye has a slightly different Field of View (FoV) due to their horizontal separation. This separation is called the Interpupillary Distance (IPD) and its average value is 63 mm [Dodgson, 2004] for adults. Furthermore, the discrepancy between the projection of the car onto the retina of one eye and the other is called retinal dispar-ity or binocular dispardispar-ity. The brain processes these binocular disparities and creates the impression of perceived depth, which is called stereopsis (see Fig. 1.3). Stereopsis helps to discriminate the difference in depth, to order the objects, to judge slant or curvature, to obtain relief and shape, to judge motion speed and direction in depth, to recover surface properties, or to obtain precise measurements of depth between objects [Banks et al., 2012].
Right eye image on the retina: 3D percept of the car:
Left eye image on the retina:
Figure 1.3: The figure sees the car from different angles because of the horizontal sepa-ration of the eyes. Using this difference, the brain fuses the left and right retinal image into a 3D perception.
Figure 1.4 illustrates binocular vision. The two eyes verge and their optical axes intersect on the fixation point F. Once the eyes have accommodated and converged, the fixation point is projected to the same position on both retinas. Hence, the fixation point acquires zero retinal disparity. All points that have zero disparity fall on the
Principles of depth perception 23
horopter and are perceived at the same depth. The points that are situated in front of the horopter have negative or crossed disparities (point B in Fig. 1.4), whereas the points located behind the horopter have positive or uncrossed disparities (point A in Fig. 1.4).
The shape of horopter is approximately a circle, which is called the Vieth-M¨uller circle. The radius of this circle is determined by accommodation power and vergence [Schreiber et al., 2006]. This gives the correct representation of zero-disparity points only because the real shape of the horopter is non-linear [Blakemore, 1970] but in practice this difference can be neglected [Ijsselsteijn, 2004]. The region around the horopter, where the brain can fuse two retinal images is called Panum’s fusional area (see Fig.1.4). When the disparity between images is too large, the brain fails to fuse the corresponding points and double vision occurs.
Bl F A B f a b
Panum’s fusional area
Horopter Eyes Br Al Ar Fl Fr
Figure 1.4: The horopter and Panum’s fusional area. All points that fall on the horopter have zero retinal disparity. The points located around the horopter fall on Panum’s fusional area, where binocular fusion can take place.
In practice, one of the ways to estimate binocular disparity is to calculate the differ-ence between the fixation point and the vergdiffer-ence angle [Holliman, 2003]. In the case of crossed disparity, the difference will be negative: αb = f − b. In the case of uncrossed
disparity, the difference will be positive: αa= f − a, where a, b, f are vergence angles as
illustrated in Figure1.4.
As was explained in the previous section, depth is perceived not only because of binocular disparity but also due to various pictorial cues. So, in real life it is difficult to find such situations where stereopsis is created only by binocular disparity. However, this is possible with the help of synthetic stimuli called random-dot stereograms; an example of such a stimulus is presented in Figure1.5. To prove that stereopsis can only be created by binocular disparity, Julesz designed stereoscopic images of random-dot patterns that did not contain any pictorial cues [Julesz, 1971]. The idea is to take two identical random dot patterns and then to shift a square section of one pattern to the side. When the generated images are presented to the corresponding eyes, the created
24 Chapter 1
disparity produces the feeling that the square with the random dots floats above the flat background.
Figure 1.5: Left and right image of a random-dot stereogram. It is very difficult to discriminate which group of dots is shifted in the right image in comparison with the left, but the HVS can easily detect differences when corresponding views are presented to the left and right eyes.
Therefore, the results of Julesz’s experiment have demonstrated the existence of neurons which react to different amounts of disparity. The disparity-selective cells or binocular depth cells were revealed in the visual cortex of the brain [Barlow et al., 1967,
Hubel and Wiesel, 1970]. Furthermore, Poggio and Fisher classified binocular cells
of the visual cortex in monkeys and found that about 67% of cells are sensi-tive to zero disparities, 19% to uncrossed disparities, and 9% to crossed disparities [Poggio and Fischer, 1977]. Uka et al. reported that binocular cells respond best to a certain amount of absolute disparity and confirmed that they are mostly tuned for either crossed or uncrossed disparity [Uka et al., 2000].
1.2.4 Depth cue interactions
The previous sections describe oculomotor, monocular, and binocular cues that con-tribute to depth perception. In everyday life we rarely find situations when only one cue is present. Redundant information occurs due to the importance of correct perception for humans. The brain must combine sensory information from multiple cues to create a single perception of depth.
Cutting and Vishton investigated a synergy between some of the cues and found out that the efficiency of some of them depends on distance [Cutting and Vishton, 1995]. The results of their research are presented in Figure1.6. Depth is the mean distance of two objects from an observer (horizontal axis). Depth contrast is defined as the ratio of the just-noticeable distance between these objects over depth (vertical axis). Small depth contrast leads to high depth quantization, e.g. the observer can perceive very small differences in the distance between objects. Independent of distance, occlusion always contributes to depth perception and dominates over all other cues as shown in Figure1.6. Since it is very easy for the HVS to define when an object covers the view of another one, occlusion is considered as one the least ambiguous depth cues. However, it gives no information about the amount of depth between two objects [Banks et al., 2012]. Binocular and oculomotor cues provide such information but they are more effective for the distance of closer objects (the closer the distance is, the smaller the depth contrast is). Binocular disparity decreases when an object moves at least 10 meters away from an observer, which makes these depth cues ineffective.
Principles of depth perception 25
Figure 1.6: Depth thresholds for different depth cues as a function of distance from an observer; from [Cutting and Vishton, 1995].
As can be seen in Figure1.6, the HVS produces redundant information taken from different cues at various distances. These cues can be perceptually combined in many ways [Howard, 2012]. Among the cues are:
• Dominance. Information provided from the occlusion cue dominates over all the other cues.
• Summation. For example, when monocular visual acuity is enhanced by binocular vision, [Banton and Levi, 1991] e.g. a person sees worse with one eye than with two open eyes.
• Averaging. These are additive interactions between cues.
• Disambiguation. The information from one cue disambiguates the interpretation of another cue. For example, blur resulting from focusing can disambiguate stereopsis [Banks et al., 2012].
• Calibration and adaptation happens when one cue helps to interpret information of another cue.
• Dissociation. The interaction of connected cues applied to a common feature of an object, e.g. the cues are applied differently depending on an object’s feature or location.
A combined model for the integration of the cues or a generalized theory on how the brain extracts depth does not exist yet [Banks et al., 2012].
1.2.5 Individual differences
Humans perceive depth using depth cues. However, stereopsis is created only by binocu-lar depth cues, so this sensation is susceptible by non stereo blind people. In other words, stereoblindness is the inability to perceive stereoscopic depth cues [Shibata et al., 2011].
26 Chapter 1
The studies of this phenomenon were conducted by Richards, who tested 150 partici-pants for stereoblindness with random-dot stereograms [Richards, 1970]. He found that 4% were not able to perceive depth and 10% had difficulties detecting its direction relative to a background. Strabismus and amblyopia are some common reasons for stereoblindness.
There are several characteristics of the HVS that differ individually and affect stere-opsis. For example, IPD varies from person to person and changes with the age. The range of IPD is from 40 to 80 mm for extreme cases and children [Dodgson, 2004]. Thus, for a given viewing distance and screen disparity, people with smaller IPD would per-ceive more depth (see more details in the next Section 1.3). Another characteristic is the pupil diameter, which influences the amount of depth e.g. DoF, when an image is perceived sharply [Lambooij et al., 2007].
The properties of the HVS change with age due to structural changes in the eyes. For example, the ability to accommodate decreases with age because the eye lens loses its elasticity; usually, almost no accommodation remains by the age of 55 years. However, the accommodation system of children develops until 7 years old and it is not known whether stereoscopic content influences their visual system [Lambooij et al., 2007].
1.3
The simple stereoscopic imaging system
Shooting and displaying three-dimensional images is an attempt to imitate what we see with our two eyes. Hence, a basic idea to imitate the HVS is to replace the left and right eyes with two horizontally separated video cameras. Next, to use a screen that is able to directly show the recorded left and right views to the corresponding eyes. Then the brain fuses these images, which results in depth perception. An example of such a simple stereoscopic system is illustrated in Figure1.7.
cameras
real object
(a) Image acquisition
eyes
3D screen
reconstructed object
(b) Image visualization Figure 1.7: A simplest stereoscopic imaging system.
The horizontal separation between the left and right cameras is called interaxial or baseline distance. It creates the desired differences between the left and right views and, consequently, produces binocular disparity. Then, the binocular disparity drives accommodation and vergence, which are combined with the monocular depth cues of
The simple stereoscopic imaging system 27
a scene, including the occlusion, relative size of objects, shadows and relative motion. Finally, all this information is processed by the brain to create depth perception.
Typically, the recorded views are displayed on the same planar screen. The separation created between the position of corresponding points in the left and right images is called parallax or screen disparity. There are three types of parallax depending on the position of the reconstructed object relative to the screen plane, which is illustrated in Figure1.8: • Positive parallax. The object is perceived behind the screen plane. The displayed
object is shifted to the left for the left eye and to the right for the right eye. • Zero parallax. The object is perceived on the screen plane. The left eye and right
eye image are in the same position on the screen.
• Negative parallax. The object is perceived in front of the screen. The displayed object is shifted to the right for the left eye and to the left for the right eye.
L I R Screen Left eye Right eye I Left eye Right eye Screen I L R Screen Left eye Right eye
(a) Positive parallax L I R Screen Left eye Right eye I Left eye Right eye Screen I L R Screen Left eye Right eye (b) Zero parallax L I R Screen Left eye Right eye I Left eye Right eye Screen I L R Screen Left eye Right eye (c) Negative parallax Figure 1.8: Types of the screen parallax.
Assuming an ideal planar stereoscopic display, Figure 1.9 shows the geometry of perceived depth, which depends on the screen parallax P , the viewing distance V and the separation between the observer’s eyes (e). Zm is the distance from the perceived
object to the screen; Zi is the distance from the perceived object to the viewer. From
similar triangles, the equation 1.1 derives the perceived depth as the function of the parameters mentioned above; similarly, the equation 1.2 deduces the distance from a virtual object to the viewer.
Zm= P × V e − P (1.1) Zi= V × e e − P (1.2)
From the equation1.1, the perceived depth depends on the viewing distance and the screen disparity. The next section presents the consequences of such dependence.
1.3.1 Perceived depth as function of viewing distance
From the equation1.2, the perceived depth depends on the viewing distance as illustrated in Figure 1.10. Therefore, a viewer that moves closer to the screen increases retinal disparities and perceives the reconstructed objects as being closer.
28 Chapter 1 e P V Zm Zi Image point Screen
Figure 1.9: Perceived depth as a function of screen disparity.
0 1 2 3 4 5 6 7 8 9 10
0 5 10 15
Perceived depth Zi, m
Viewing distance V, m
Cinema (P=0.06 m) 3DTV (P=0.02 m) Desktop (P=0.005 m)
Figure 1.10: Perceived depth as a function of viewing distance and screen disparities.
1.3.2 Perceived depth as function of screen disparities
Also, in accordance with the equation 1.2, the perceived depth depends on the screen disparity. This means that the larger the parallax is, the larger the reconstructed virtual space will be. This dependency is illustrated in Figure1.11. A more detailed example for cinema, TV, and desktop screens is given in Table1.1, where the viewing distance is fixed at 4 meters. Screen parallax will increase when a content designed for a 3DTV is displayed on a cinema screen. As result, the objects are reconstructed as being farther in depth. Conversely, there is a reduction in screen parallax when the same content designed for the cinema is displayed on a desktop monitor. Hence, objects seems to be closer in depth.
Thus, it is very important to take into account that the screen parallax of the same 3D content varies depending on the screen size and viewing distance. This change in the disparity magnitude leads to a different perception of the depth of the objects. There are two ways to deal with this problem. The first way is to change the screen parallax
The simple stereoscopic imaging system 29 0 0.01 0.02 0.03 0.04 0.05 0.06 0 10 20 30 40 50 60
Perceived depth Zi, m
Screen disparity P, m
Figure 1.11: Perceived depth as a function of screen disparities. Table 1.1: Perception of the same content on different screen sizes.
Display P, m V, m IPD, m Zm, m
Cinema 0.06 4 0.065 52
3DTV 0.02 4 0.065 5.78
Desktop 0.005 4 0.065 4.3
to match the screen size in postproduction. For example, the screen parallax should be adapted for displaying content made for the cinema screen on a 3DTV. The second way is to change the viewing distance depending on the screen size. However, in this case, immersion, perception, and visual experience will differ due to changes in field of view [Sandrew, 2012].
1.3.3 Artifacts related to S3D visualization
Reconstructed stereoscopic content might be very different from a real world scene in terms of depth perception. The viewing distance can be modified while viewing but IPD and shooting parameters are unchangeable during the visualization stage. Thus, there is a possibility that any introduced disparities are unnatural to the HVS and that the reconstructed scene looks distorted.
In cinematography the roundness factor indicates the depth realism of produced stereoscopic content. A reconstructed object that has the same shape proportions as in real life has a roundness factor equal to 1. To facilitate content creation by filmmakers and stereographers, Smith et al. proposed a mathematical analysis
[Smith and Collar, 2012]. It uses the selected camera and the scene parameters as
the input and then predicts whether the intended artistic effect can be created. Also, Mendiburu provided the guidelines on how to refine the depth effect depending on the roundness factor [Mendiburu, 2009]. However, any introduced intervals of the roundness
30 Chapter 1
factor are rather empirical and are not supported by any subjective experiments. For example, it is not possible to conclude whether the viewer will perceive any shape im-provement if the roundness factor changes from 1.2 to 1.1 or if 0.7 is really the perceptual limit when viewers start to perceive a flattening of the objects. Such studies have not yet been conducted.
The most common artifacts related to depth perception are reviewed below. 1.3.3.1 Cardboard effect
The cardboard effect is the phenomenon when the depth planes of an image look as they are made from cardboard, while the objects in depth look flattened. This is the result of a perception mismatch between the binocular and the perspective depth cues, which is created by insufficient depth or disparity information [Boev et al., 2008]. This effect can be avoided by an accurate reproduction of binocular disparity during filming [Yamanoue et al., 2000].
1.3.3.2 Size distortion artifacts
Similar to the cardboard effect, the puppet-theater effect is also the result of flaws in the recreation of binocular disparities. Disproportion in reconstructed space leads to undesired geometrical distortions in depth perception because in real life distance and angular size are strongly linked. The puppet-theater effect makes 3D reconstructed objects appear unnaturally smaller in comparison with real objects. For example, people in stereoscopic pictures may look as small as the puppets. Usually effects are more noticeable for objects with familiar sizes. Distortion can be avoided by the correctly representing binocular disparity, which also applies in the case of the cardboard effect [Yamanoue et al., 2000].
Gigantism and miniaturization are more general cases of size distortion artifacts. Binocular vision provides an idea about the structure of a 3D scene. When this infor-mation is incorrect, the whole scene is exposed to large stereoscopic distortion and can appear gigantic or miniaturized. These distortions are produced while shooting with improper parameters [Devernay and Beardsley, 2010].
1.3.3.3 Window violation
The window violation effect is the result of a depth cue conflict. It occurs when ob-jects with crossed disparity are cut off by the border of the screen [Mendiburu, 2009,
Devernay and Beardsley, 2010]. The conflict is created because the brain does not know how to interpret a screen border located behind an object that occludes it at the same time. This violation can destroy the 3D effect or induce visual discomfort. Window violations on the top and bottom of the screen are considered to be less annoying than ones on the left and right borders [Collins et al., 2011].
Window violations can be avoided during the shooting stage or corrected by post processing technique, which is called floating window. Floating window is basically a crop mask, which hides the part of the object that causes the violation.
Subtitles in stereoscopic movies can also create the window violation effect. They are often rendered at the display plane and hence can produce depth discontinuities when the region of interest (ROI) of a scene is rendered in another depth plane. Therefore, subtitles reduce visual comfort [Lambooij et al., 2013]. Such conflict can be avoided if the subtitles are placed at the depth of a scene.
Limits of the HVS in binocular depth perception 31
1.3.3.4 Stereoanomaly
Stereanomaly is a phenomenon when stereopair is perceived as inverted and objects with negative disparities acquire positive disparities and vice versa. The image pair perceived due to stereoanomaly is called pseudoscopic because of the inversed order of presentation. For example, in the case of S3D football game content, when the image intended for the left eye is seen by the right eye, which can result in perceiving the field to be in front of the players. This can be avoided by displaying the same image for the left and right eyes several times to insure the correct presentation order. Also this anomaly can be created by the brain if there is degraded stimuli (such as degraded images with low luminance, contrast, or resolution) and may occur for 20-30% of people [Patterson, 2007].
1.4
Limits of the HVS in binocular depth perception
Despite the numerous advantages that our visual system has, there are several limitations on how stereoscopic content should be displayed, which are discussed below.
1.4.1 Fusion range limits
As explained in Section 1.2, the principle of any stereoscopic system is to deliver two slightly different images to the corresponding eyes. The brain processes the created binocular disparity and fuses the two images into a single 3D view. However, there is a certain disparity value beyond which the images will not fuse and the objects are seen in different positions. The range over which fusion occurs is known as Panum’s Fusional Area. The shape limits of Panum’s fusional area are not constant over the retina. Qin et al. have investigated limits in 16 equidistant different directions from 0 to 360 degrees and concluded that the shape of Panum’s fusional area has “the shape of an ellipse off-centered toward the nasal side on the horizontal meridian of the retina” [Qin et al., 2006].
Most studies have concentrated not on the shape but on the size of Panum’s fusional area, i.e. the fusion limit of binocular disparities. Julesz and Schumer have performed experiments with random-dot stereograms and found that the limit of fusion is equal to 50 minutes of an arc [Julesz and Schumer, 1981]. By stabilizing images on the retina, this threshold can be increased [Fender and Julesz, 1967]. By using line stereograms, Mitchell found a lower threshold of 10 minutes of an arc for crossed and uncrossed disparities [Mitchell, 1966]. Yeh and Silverstein defined 24 minutes of arc as the limit for an uncrossed disparity and 27 minutes of arc for crossed for the short duration stimuli that did not require any vergence movements. But the limits increased to 1.57 degrees for uncrossed and 4.93 degrees for crossed [Yeh and Silverstein, 1990] for longer durations with allowed eye movements. Similar temporal dependency has been found by Schor and Tyler; when the disparities were changing slowly (0.2 Hz), the limits of binocular fusion were higher than for fast changes (5 Hz). They also found that stimuli with low spatial frequency increases the size of Panum’s fusional area in comparison with high frequency [Schor and Tyler, 1981].
Such diversity in the results can be explained by the influence of various factors on the size of Panum’s fusional area. Among those factors are stimulus size, exposure duration, continuous features, temporal effects, amount of luminance, and individual differences [Lambooij et al., 2007]. For now, there is still no common consensus on how large the disparity can be in order to avoid diplopia (double vision).
![Figure 1.6: Depth thresholds for different depth cues as a function of distance from an observer; from [Cutting and Vishton, 1995].](https://thumb-eu.123doks.com/thumbv2/123doknet/11502229.293720/29.892.116.733.174.502/figure-thresholds-different-function-distance-observer-cutting-vishton.webp)

![Figure 2.15: Multiview video-plus-depth: N views and corresponding depth maps from [Cagnazzo et al., 2013]](https://thumb-eu.123doks.com/thumbv2/123doknet/11502229.293720/60.892.167.783.163.393/figure-multiview-video-depth-views-corresponding-depth-cagnazzo.webp)