HAL Id: hal-02612844
https://hal.archives-ouvertes.fr/hal-02612844
Submitted on 19 May 2020
HAL is a multi-disciplinary open access
archive for the deposit and dissemination of
sci-entific research documents, whether they are
pub-lished or not. The documents may come from
teaching and research institutions in France or
abroad, or from public or private research centers.
L’archive ouverte pluridisciplinaire HAL, est
destinée au dépôt et à la diffusion de documents
scientifiques de niveau recherche, publiés ou non,
émanant des établissements d’enseignement et de
recherche français ou étrangers, des laboratoires
publics ou privés.
HMM-BASED FRAMEWORK TO MEASURE THE
VISUAL FIDELITY OF TONE MAPPING
OPERATORS
Waqas Ellahi, Toinon Vigier, Patrick Le Callet
To cite this version:
Waqas Ellahi, Toinon Vigier, Patrick Le Callet. HMM-BASED FRAMEWORK TO MEASURE
THE VISUAL FIDELITY OF TONE MAPPING OPERATORS. IEEE International Conference on
Multimedia & Expo Workshops (ICMEW), Jul 2020, London, United Kingdom. �hal-02612844�
HMM-BASED FRAMEWORK TO MEASURE THE VISUAL FIDELITY OF TONE MAPPING
OPERATORS
Waqas Ellahi, Toinon Vigier, Patrick Le Callet
[email protected]
LS2N UMR CNRS 6003, Universit´e de Nantes
Nantes, France
ABSTRACT
Recent advancements in the image capturing techniques and post processing software generate High Dynamic Range (HDR) images. Such images retain maximum information of the scene by capturing more realistic visual contents, which are often missed in traditional image capturing techniques. In this regard, tone mapping operators (TMOs) play a signifi-cant role in displaying HDR image contents on a traditional Low Dynamic Range (LDR) display. These operators tend to introduce artifacts in the original HDR image to change its brightness and contrast in such a way that it can destroy the important textures and information of the image. The as-sessment of these TMOs is a challenging topic to select best the best technique considering different perceptual and qual-ity dimensions. In this paper, we propose to compare TMOs through their impact on visual behavior in comparison with HDR condition. This study is the first of its kind to utilize hidden markov model (HMM) as a similarity measure to eval-uate perceived quality of TMO. The findings suggest that the proposed HMM-based method which emphasizes on tempo-ral information produce better evaluation metric than the tra-ditional approaches which are based only on visual spatial information.
Index Terms— scanpath, eye movements, visual atten-tion, hidden markov model, tone mapping operators
1. INTRODUCTION AND BACKGROUND
High Dynamic Range (HDR) imaging has gained significant attention in recent years both in industry and academia. The is mainly due to the fact that HDR images are visually more re-alistic and appealing as they represent a larger dynamic range of the visual content present in the real world. The HDR tech-nologies are arguably considered a major development in dis-play technologies since the transition from black and white to color displays [1, 2]. However, most of the common imaging devices are only capable to work only with standard dynamic range (SDR) images, leading to a loss of luminance and con-trast.
When the dynamic range is lower than the one of the con-tent, the source image is processed with a tone mapping op-erator (TMO) to compress the dynamic range before render-ing. The goal of this technique is to reproduce HDR con-tent on SDR display while preserving details, contrasts and quality. As a consequence, several techniques have been de-veloped in the past utilizing simple global operations such as linear scaling and clipping [3, 4] to more local advance operators that exploit properties of the human visual system [5, 6, 7, 8, 9]. TMOs can be also perceptually optimized using visual saliency and visual attention to locally adjust the con-trast, preserve details and chromoticity [10]. The quality eval-uation of tone mapping operators is a challenging topic due to the consideration of multi- perceptual dimensions such as nat-uralness, colorfulness, brightness, fidelity, and artistic intent. Several studies have assessed these dimensions through sub-jective experiments [11, 12, 13] and different obsub-jective met-rics for HDR content have been proposed [14, 15, 16].
The use of eye tracking experiment is proven to be a good methodology in measuring visual fidelity. Indeed, Narwaria et al. [11] showed that tone mapping operators modify vi-sual attention by comparing the similarity between saliency maps (computed from eye data obtained during the visuali-sation of HDR and tone-mapped images). The current study performs the comparison of saliency maps and investigates their impact on pre- and post tone mapping. The findings suggest that some salient areas in HDR image are not seen after tone-mapping (and vice versa). However, the dynamic aspect of visual behavior, e.g. scanpaths, is not considered with saliency-based framework. Indeed, temporal aspect in visual attention can reveal the way a content is visually per-ceived, semantically processed and qualitatively assessed.
Scanpath modeling is a challenging task which has been more recently raised with new analytical tools to compare visual behaviour of different conditions or populations. To cater this issue, probability based approaches are developed by assuming that eye movement parameters are random vari-ables generated by underlying stochastic processes. The set of gaze positions is modeled as bivariate gaussian distribution and hidden markov models (HMMs) are utilized to introduce
the temporal component of gaze behavior [17, 18, 19]. This in turn will determine the percentage of transitions from one ROI to another ROI. These techniques have been used for the study of scanpath in face recognition [17], the classification of scanpath according to different visual task [19] or different population with visual field losses [18].
The main contribution of the paper is a new HMM based similarly measure in order to evaluate the quality of HDR and TMO generated scanpaths. This paper is structured as fol-lows. First, we explain HMMs in the context of gaze behavior modeling. Then, we illustrate the application of this technique for TMOs bencharmarking. Finally, we conclude our method in the last section.
2. HMM TOOLS FOR THE MEASURE OF VISUAL SCANPATH SIMILARITY
2.1. HMM used as eye movement modeling
The proposed work utilizes HMMs as a statistical approach to produce the sequence of observation through the set of stochastic process. These observed sequences are then pre-dicted by estimating the transition among different states. it is a data-driven technique and integrates influences stem-ming from bottom-up mechanisms,top-down mechanisms, and viewing biases into a single model [19]. In this work, the eye position is observed using estimated ROI of the im-age which is set as the hidden state of HMM. Following the technique used in Chuk et al. [17], the transition matrix rep-resents the saccadic movements of the participant. The emis-sion densities (the distribution of fixation points in each ROI) are modeled as two-dimensional Gaussian distributions. The initial state of the model, i.e., the probability distribution of the first fixation, is modeled with the prior values. The pa-rameter K which represents the number of ROI in context of scanpath must be selected according to the gaze data instead of setting the parameter with prior information.
The variational approach to Bayesian inference allows si-multaneous estimation of complexity of model and its param-eters [20], which automates the process of finding number of states (K) in HMM model [17]. An HMM is trained on eye movement data which enables to compare and visualize the gaze behavior of different groups of observers, in different experimental conditions. The individual HMMs of the simi-lar gaze pattern behaviour is clustered by VHEM [21, 22] into joint HMM. For each cluster, the VHEM algorithm produced a representative HMM, which summarizes the common ROIs and transitions in the cluster.
2.2. Measure of similarity
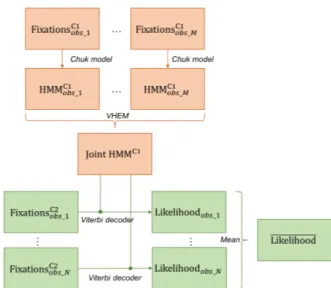
In the proposed work, similarity is evaluated using sequence of steps. The steps involved in this process are presented in Fig. 1. Initially, each of the observers eye movement is mod-eled using HMM for one condition (C1). The HMM of each
Fig. 1: Scanpath similarity evaluation framework.
observer is then clustered into single Joint HMM by using VHEM. The similarity between the scanpath (i.e. sequence of fixations) of second condition (C2) and the joint clus-tered is determined by computing the likelihood using Viterbi decorder. The mean likelihood of all observers is considered as a similarity score between the two conditions.
Table 1: Characteristics of subjective experiment Features HDR test TMO test
# of images 11 88
Image resolution 760x900 to 1620x1080 Image duration 10 seconds
Distance 3 times of display height
# of Observers 37 48
Display model Sim2 HDR47E TvLogic LVM401 Display resolution 1920x1080 pixels
Eyetracker SMI Hi-Speed
3. APPLICATION OF BENCHMARKING TMOS
3.1. Dataset
The publicly available dataset ”Eye-Tracking on High dY-namic range iMAges” (ETHyma) [11] is analyzed in this study. The dataset contains 11 HDR images, captured in different environmental conditions, i.e. indoor and outdoor scenes with varying illumination conditions. A total of 88 TMOs images were computed using 8 different TMO meth-ods. These methods are referred in Table 1, column 4-11, where each column presents the output of these TMO meth-ods using proposed and state-of-the-art techniques. The HDR stimuli were displayed on an HDR display (Sim2 HDR47E S 4K) and the tone mapped contents are presented on on a
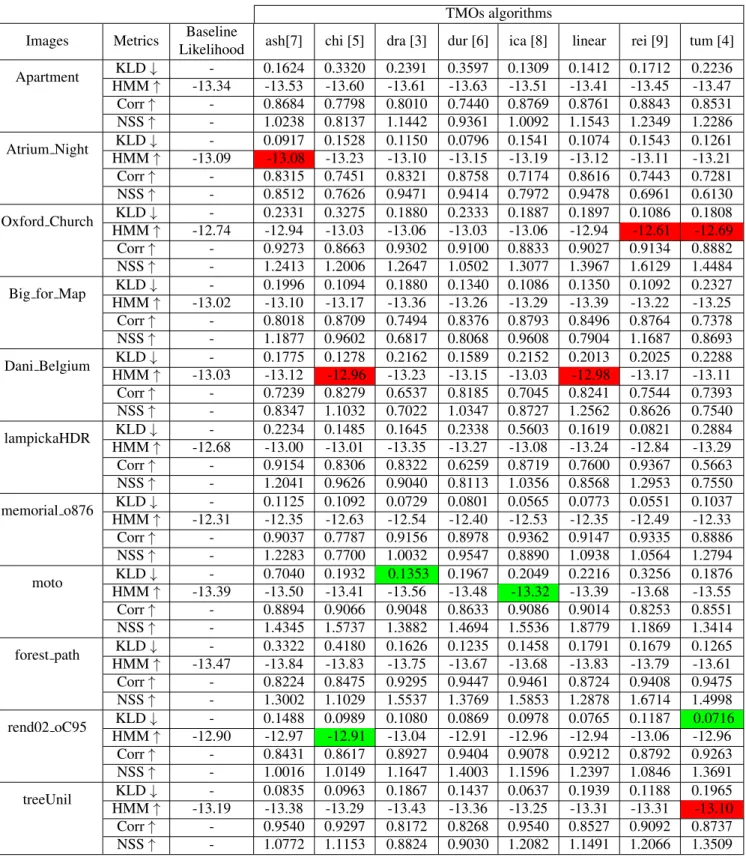
Table 2: Similarity scores for the studied dataset. (Red cells represent similarity scores higher than the baseline, discussed Section 3.3. Results of green cells are discussed in Section 3.4 to highlight the interest of the framework.)
TMOs algorithms
Images Metrics Baseline
Likelihood ash[7] chi [5] dra [3] dur [6] ica [8] linear rei [9] tum [4] Apartment KLD ↓ - 0.1624 0.3320 0.2391 0.3597 0.1309 0.1412 0.1712 0.2236 HMM ↑ -13.34 -13.53 -13.60 -13.61 -13.63 -13.51 -13.41 -13.45 -13.47 Corr ↑ - 0.8684 0.7798 0.8010 0.7440 0.8769 0.8761 0.8843 0.8531 NSS ↑ - 1.0238 0.8137 1.1442 0.9361 1.0092 1.1543 1.2349 1.2286 Atrium Night KLD ↓ - 0.0917 0.1528 0.1150 0.0796 0.1541 0.1074 0.1543 0.1261 HMM ↑ -13.09 -13.08 -13.23 -13.10 -13.15 -13.19 -13.12 -13.11 -13.21 Corr ↑ - 0.8315 0.7451 0.8321 0.8758 0.7174 0.8616 0.7443 0.7281 NSS ↑ - 0.8512 0.7626 0.9471 0.9414 0.7972 0.9478 0.6961 0.6130 Oxford Church KLD ↓ - 0.2331 0.3275 0.1880 0.2333 0.1887 0.1897 0.1086 0.1808 HMM ↑ -12.74 -12.94 -13.03 -13.06 -13.03 -13.06 -12.94 -12.61 -12.69 Corr ↑ - 0.9273 0.8663 0.9302 0.9100 0.8833 0.9027 0.9134 0.8882 NSS ↑ - 1.2413 1.2006 1.2647 1.0502 1.3077 1.3967 1.6129 1.4484 Big for Map KLD ↓ - 0.1996 0.1094 0.1880 0.1340 0.1086 0.1350 0.1092 0.2327 HMM ↑ -13.02 -13.10 -13.17 -13.36 -13.26 -13.29 -13.39 -13.22 -13.25 Corr ↑ - 0.8018 0.8709 0.7494 0.8376 0.8793 0.8496 0.8764 0.7378 NSS ↑ - 1.1877 0.9602 0.6817 0.8068 0.9608 0.7904 1.1687 0.8693 Dani Belgium KLD ↓ - 0.1775 0.1278 0.2162 0.1589 0.2152 0.2013 0.2025 0.2288 HMM ↑ -13.03 -13.12 -12.96 -13.23 -13.15 -13.03 -12.98 -13.17 -13.11 Corr ↑ - 0.7239 0.8279 0.6537 0.8185 0.7045 0.8241 0.7544 0.7393 NSS ↑ - 0.8347 1.1032 0.7022 1.0347 0.8727 1.2562 0.8626 0.7540 lampickaHDR KLD ↓ - 0.2234 0.1485 0.1645 0.2338 0.5603 0.1619 0.0821 0.2884 HMM ↑ -12.68 -13.00 -13.01 -13.35 -13.27 -13.08 -13.24 -12.84 -13.29 Corr ↑ - 0.9154 0.8306 0.8322 0.6259 0.8719 0.7600 0.9367 0.5663 NSS ↑ - 1.2041 0.9626 0.9040 0.8113 1.0356 0.8568 1.2953 0.7550 memorial o876 KLD ↓ - 0.1125 0.1092 0.0729 0.0801 0.0565 0.0773 0.0551 0.1037 HMM ↑ -12.31 -12.35 -12.63 -12.54 -12.40 -12.53 -12.35 -12.49 -12.33 Corr ↑ - 0.9037 0.7787 0.9156 0.8978 0.9362 0.9147 0.9335 0.8886 NSS ↑ - 1.2283 0.7700 1.0032 0.9547 0.8890 1.0938 1.0564 1.2794 moto KLD ↓ - 0.7040 0.1932 0.1353 0.1967 0.2049 0.2216 0.3256 0.1876 HMM ↑ -13.39 -13.50 -13.41 -13.56 -13.48 -13.32 -13.39 -13.68 -13.55 Corr ↑ - 0.8894 0.9066 0.9048 0.8633 0.9086 0.9014 0.8253 0.8551 NSS ↑ - 1.4345 1.5737 1.3882 1.4694 1.5536 1.8779 1.1869 1.3414 forest path KLD ↓ - 0.3322 0.4180 0.1626 0.1235 0.1458 0.1791 0.1679 0.1265 HMM ↑ -13.47 -13.84 -13.83 -13.75 -13.67 -13.68 -13.83 -13.79 -13.61 Corr ↑ - 0.8224 0.8475 0.9295 0.9447 0.9461 0.8724 0.9408 0.9475 NSS ↑ - 1.3002 1.1029 1.5537 1.3769 1.5853 1.2878 1.6714 1.4998 rend02 oC95 KLD ↓ - 0.1488 0.0989 0.1080 0.0869 0.0978 0.0765 0.1187 0.0716 HMM ↑ -12.90 -12.97 -12.91 -13.04 -12.91 -12.96 -12.94 -13.06 -12.96 Corr ↑ - 0.8431 0.8617 0.8927 0.9404 0.9078 0.9212 0.8792 0.9263 NSS ↑ - 1.0016 1.0149 1.1647 1.4003 1.1596 1.2397 1.0846 1.3691 treeUnil KLD ↓ - 0.0835 0.0963 0.1867 0.1437 0.0637 0.1939 0.1188 0.1965 HMM ↑ -13.19 -13.38 -13.29 -13.43 -13.36 -13.25 -13.31 -13.31 -13.10 Corr ↑ - 0.9540 0.9297 0.8172 0.8268 0.9540 0.8527 0.9092 0.8737 NSS ↑ - 1.0772 1.1153 0.8824 0.9030 1.2082 1.1491 1.2066 1.3509
dard LCD screen. Each image was viewed by the participant during 10 seconds. The eye movements were recorded us-ing SMI Hi-Speed tracker with a frequency of 500Hz. Thirty seven observers participated in the HDR experiment and 48 did the TMO experiment. The characteristics of this subjec-tive experiment are presented in Table.1.
3.2. Similarity metrics
In this section, we present the obtained scores of similarity for our framework compared with state-of-the-art saliency-based metrics: Kullback-Liebler divergence (KLD), 2D correlations (Corr) and Normalized scanpath saliency (NSS) [23]. These metrics are calculated after the computation of fixation maps. These maps are computed by convolving a Gaussian kernel with standard deviation of one degree of visual angle across the observer’s fixation locations. The proposed framework is applied with C1 as the HDR condition compared with the dif-ferent tone mapping techniques. The HMM model is applied on eye fixations extracted from raw gaze data for each ob-server during HDR experiment [24]. In addition, each HMM is then clustered into single joint HMM by using VHEM. The likelihood is calculated using Viterbi decoder by passing joint HMM parameters and fixation points recorded during TMOs experiment. The similarity score between HDR and TMOs is estimated by taking mean of likelihood of all observers for each TMOs. In this study, the maximum value of states in HMM, K, is set to 7. The scores of the proposed framework with the ones of all the other similarity / dissimilarity metrics are presented Table 2.
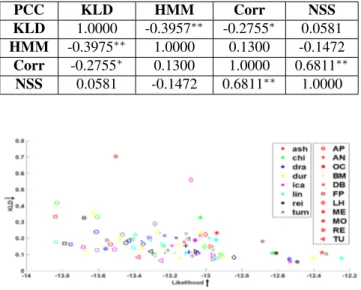
Table 3: Pearson correlation coefficients (PCC) between sim-ilarity metrics. (* indicates a p-value < 0.05 and ** indicates a p-value < 0.001). PCC KLD HMM Corr NSS KLD 1.0000 -0.3957∗∗ -0.2755∗ 0.0581 HMM -0.3975∗∗ 1.0000 0.1300 -0.1472 Corr -0.2755∗ 0.1300 1.0000 0.6811∗∗ NSS 0.0581 -0.1472 0.6811∗∗ 1.0000
Fig. 2: Relationship between scores of KLD and HMM met-rics
In addition, a baseline likelihood score on individual HDR scanpaths is also calculated to validate this method. The base-line likelihood is estimated by providing the fixation points of each observer for HDR condition and joint HMM parameter to the Viterbi decoder. The final score is taking a mean of all likelihood for all observers. This baseline can be interpreted as the similarity score between one observer and a model of all scanpaths for the same condition. It is thus expected that the likelihood score for the TM condition would be lower than the baseline.
3.3. Validation of the framework
The similarity metrics are compared between each other through the computation of Pearson’s correlation coefficients (PCC) presented Table 3. The proposed framework shows a strong significant negative correlations with KLD metric. The relationship between KLD and HMM likelihood scores is also presented Fig. 2. These results ensure the validity of the proposed framework which is correlated with existing metrics used to measure visual fidelity.
Concerning the baseline, the obtained scores seem to val-idate the previous assumption except for a few values (high-lighted in red in Table 2). These specific cases could be ex-plained by a low inter-observer congruency for HDR baseline condition and further analysis should be done to better under-stand these outcomes.
3.4. Benchmarking of TMOs through dynamic visual fi-delity
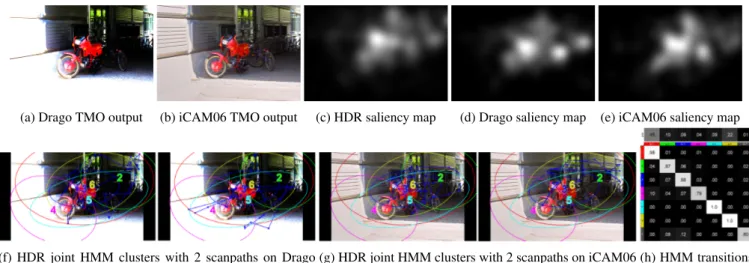
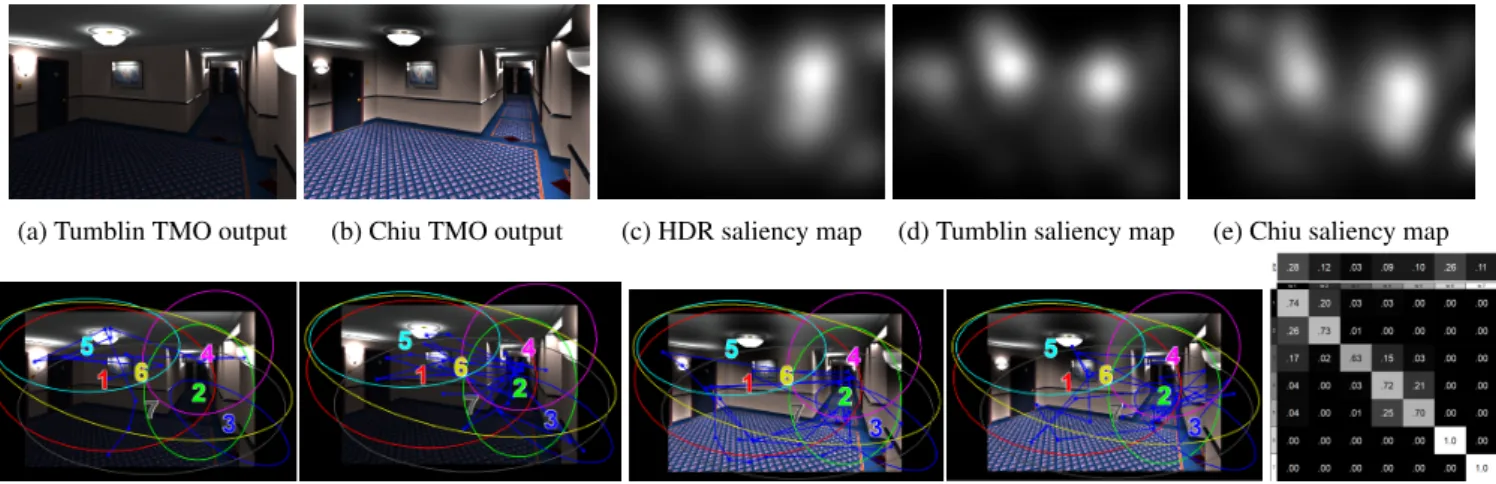
The similarity scores detailed in Table 2 show a strong cor-relation between saliency-based metrics and the proposed HMM-based one, except for some specific tone-mapped con-tents. The moto and rend02 oC95 are selected as test images to investigate these results through the comparison of the per-formance between HMM and KLD. The performed analysis of KLD suggests that Drago and Tumblin methods offer the best performance among all for moto and rend02 oC95 im-ages respectively. Whereas with the HMM-based framework, iCAM06 method offers best performance for moto and Chiu method for rend02 oC95 image (see Table 2-highlighted green cells). Saliency maps, HDR joint HMM states and tran-sition matrix as well as scanpaths for TM0 condition are de-picted on Fig 3 and 4. We can see that most performant TMOs with our framework seem to lead to more similar saliency maps than the best ones with KLD metric. In addition, the scanpaths for iCAM06 (resp. Chiu) TMO fit better the joint HMM on HDR condition than Drago (resp. Tumblin) TMO. From these observations, we can see that HMM-based frame-work outperfoms KLD metric and better reveals visual atten-tion similarity for both spatial (i.e salient) and temporal (i.e. scanpath) information.
One limitation of this proposed framework is that HMM based on Chuck methodology perform well with image
(a) Drago TMO output (b) iCAM06 TMO output (c) HDR saliency map (d) Drago saliency map (e) iCAM06 saliency map
(f) HDR joint HMM clusters with 2 scanpaths on Drago TMO
(g) HDR joint HMM clusters with 2 scanpaths on iCAM06 TMO
(h) HMM transitions matrix
Fig. 3: Tone-mapped images, saliency maps, scanpaths and HDR joint HMM model for moto content.
tent with clear regions of interest and, thus, low visual atten-tion dispersion. Therefore, future work should be needed to deeper assess the impact of content, inter-observer congru-ency and HMM meta-parameters as number of states (i.e re-gions of interest) on the similarity metric performance. Dif-ferent HMM techniques can be also further tested and com-pared for similarity evaluation through this framework.
4. CONCLUSION
In this paper, an HMM based framework is proposed to mea-sure the similarity of visual behaviour between two condi-tions of experiment. The framework is then applied and vali-dated for the comparison of visual attention in HDR and tone-mapped images. The proposed framework provides promis-ing results due to the capability of HMM to analyse eye data considering both the spatial and sequential aspects. On the contrary, other saliency models do not reflect the dynamic (saccadic) nature of visual scanpaths.
5. ACKNOWLEDGMENT
The work in this paper was funded from the European Union’s Horizon 2020 research and innovation program under the Marie Sklodowska-Curie grant agreement No 765911, Euro-pean Training Network on Real Vision project.
6. REFERENCES
[1] Ahmet Oˇguz Aky¨uz, Roland Fleming, Bernhard E Riecke, Erik Reinhard, and Heinrich H B¨ulthoff, “Do hdr displays support ldr content? a psychophysical eval-uation,” ACM Transactions on Graphics (TOG), vol. 26, no. 3, pp. 38–es, 2007.
[2] F Banterle, A Artusi, K Debattista, and A Chalmers, “Advanced high dynamic range imaging: Theory and practice. isbn: 978-156881-719-4, ak peters,” .
[3] Fr´ed´eric Drago, Karol Myszkowski, Thomas Annen, and Norishige Chiba, “Adaptive logarithmic mapping for displaying high contrast scenes,” in Computer graphics forum. Wiley Online Library, 2003, vol. 22, pp. 419–426.
[4] Jack Tumblin, Jessica K Hodgins, and Brian K Guenter, “Two methods for display of high contrast images,” ACM Transactions on Graphics (TOG), vol. 18, no. 1, pp. 56–94, 1999.
[5] Ken Chiu, Michael Herf, Peter Shirley, S Swamy, Changyaw Wang, Kurt Zimmerman, et al., “Spatially nonuniform scaling functions for high contrast images,” in Graphics Interface. Canadian Information Processing Society, 1993, pp. 245–245.
[6] Fr´edo Durand and Julie Dorsey, “Fast bilateral filter-ing for the display of high-dynamic-range images,” in Proceedings of the 29th annual conference on Computer graphics and interactive techniques, 2002, pp. 257–266. [7] Michael Ashikhmin, “A tone mapping algorithm for high contrast images,” in Proceedings of the 13th Eu-rographics workshop on Rendering. EuEu-rographics As-sociation, 2002, pp. 145–156.
[8] Jiangtao Kuang, Garrett M Johnson, and Mark D Fairchild, “icam06: A refined image appearance model for hdr image rendering,” Journal of Visual Commu-nication and Image Representation, vol. 18, no. 5, pp. 406–414, 2007.
[9] Erik Reinhard, Michael Stark, Peter Shirley, and James Ferwerda, “Photographic tone reproduction for digital images,” in Proceedings of the 29th annual conference on Computer graphics and interactive techniques, 2002, pp. 267–276.
(a) Tumblin TMO output (b) Chiu TMO output (c) HDR saliency map (d) Tumblin saliency map (e) Chiu saliency map
(f) HDR joint HMM clusters with 2 scanpaths on Tumblin TMO
(g) HDR joint HMM clusters with 2 scanpaths on Chiu TMO
(h) HMM transitions matrix
Fig. 4: Tone-mapped images, saliency maps, scanpaths and HDR joint HMM model for rend02 oC95 content.
[10] Wen-Chieh Lin and Zhi-Cheng Yan, “Attention-based high dynamic range imaging,” The Visual Computer, vol. 27, no. 6-8, pp. 717, 2011.
[11] Manish Narwaria, Matthieu Perreira Da Silva, Patrick Le Callet, and Romuald P´epion, “Effect of tone map-ping operators on visual attention deployment,” in Ap-plications of Digital Image Processing XXXV. Interna-tional Society for Optics and Photonics, 2012, vol. 8499, p. 84990G.
[12] Martin ˇCad´ık, Michael Wimmer, Laszlo Neumann, and Alessandro Artusi, “Evaluation of hdr tone mapping methods using essential perceptual attributes,” Comput-ers & Graphics, vol. 32, no. 3, pp. 330–349, 2008. [13] Josselin Petit and Rafał K Mantiuk, “Assessment
of video mapping: Are cameras’ s-shaped tone-curves good enough?,” Journal of Visual Communica-tion and Image RepresentaCommunica-tion, vol. 24, no. 7, pp. 1020– 1030, 2013.
[14] Luk´aˇs Krasula, Karel Fliegel, Patrick Le Callet, and Miloˇs Kl´ıma, “Objective evaluation of naturalness, con-trast, and colorfulness of tone-mapped images,” in Ap-plications of Digital Image Processing XXXVII. Interna-tional Society for Optics and Photonics, 2014, vol. 9217, p. 92172D.
[15] Hojatollah Yeganeh and Zhou Wang, “Objective quality assessment of tone-mapped images,” IEEE Transactions on Image Processing, vol. 22, no. 2, pp. 657–667, 2012. [16] Miguel Granados, Tunc Ozan Aydin, J Rafael Tena, Jean-Francois Lalonde, and Christian Theobalt, “Contrast-use metrics for tone mapping images,” in 2015 IEEE International Conference on Computational Photography (ICCP). IEEE, 2015, pp. 1–8.
[17] Tim Chuk, Antoni B Chan, and Janet H Hsiao, “Under-standing eye movements in face recognition using
hid-den markov models,” Journal of vision, vol. 14, no. 11, pp. 8–8, 2014.
[18] Erwan Jo¨el David, Pierre Lebranchu, Matthieu Perreira Da Silva, and Patrick Le Callet, “Predicting artificial vi-sual field losses: a gaze-based inference study,” Journal of Vision, vol. 19, no. 14, pp. 22–22, 2019.
[19] Antoine Coutrot, Janet H Hsiao, and Antoni B Chan, “Scanpath modeling and classification with hidden markov models,” Behavior research methods, vol. 50, no. 1, pp. 362–379, 2018.
[20] Clare A McGrory and DM Titterington, “Variational bayesian analysis for hidden markov models,” Aus-tralian & New Zealand Journal of Statistics, vol. 51, no. 2, pp. 227–244, 2009.
[21] Emanuele Coviello, Gert R Lanckriet, and Antoni B Chan, “The variational hierarchical em algorithm for clustering hidden markov models,” in Advances in neu-ral information processing systems, 2012, pp. 404–412. [22] Emanuele Coviello, Antoni B Chan, and Gert RG Lanckriet, “Clustering hidden markov models with vari-ational hem,” The Journal of Machine Learning Re-search, vol. 15, no. 1, pp. 697–747, 2014.
[23] Mohsen Emami and Lawrence L Hoberock, “Selec-tion of a best metric and evalua“Selec-tion of bottom-up visual saliency models,” Image and Vision Computing, vol. 31, no. 10, pp. 796–808, 2013.
[24] Asim H Dar, Adina S Wagner, and Michael Hanke, “Re-modnav: Robust eye movement detection for natural viewing,” BioRxiv, p. 619254, 2020.