R E S E A R C H A R T I C L E
Open Access
Ecotoxicology inside the gut: impact of heavy
metals on the mouse microbiome
Jérôme Breton
1, Sébastien Massart
2, Peter Vandamme
3, Evie De Brandt
3, Bruno Pot
1and Benoît Foligné
1*Abstract
Background: The gut microbiota is critical for intestinal homeostasis. Recent studies have revealed the links between different types of dysbiosis and diseases inside and outside the intestine. Environmental exposure to pollutants (such as heavy metals) can also impair various physiological functions for good health. Here, we studied the impact of up to 8 weeks of oral lead and cadmium ingestion on the composition of the murine intestinal microbiome.
Results: Pyrosequencing of 16S RNA sequences revealed minor but specific changes in bacterial commensal communities (at both family and genus levels) following oral exposure to the heavy metals, with notably low numbers of Lachnospiraceae and high numbers levels of Lactobacillaceae and Erysipelotrichaceacae (mainly due to changes in Turicibacter spp), relative to control animals.
Conclusions: Non-absorbed heavy metals have a direct impact on the gut microbiota. In turn, this may impact the alimentary tract and overall gut homeostasis. Our results may enable more accurate assessment of the risk of intestinal disease associated with heavy metal ingestion.
Keywords: Heavy metal exposure, Gut microbiota, Mice, 16S pyrosequencing, Turicibacter, Denaturing gradient gel electrophoresis (DGGE)
Background
Chronic ingestion of environmental heavy metals (HMs, such as lead (Pb) and cadmium (Cd)) is associated with the occurrence of various diseases. The underlying mech-anism is thought to be related to excessive local and systemic oxidative stress or deregulation of immune re-sponses. Intestinal absorption of HMs leads to accumula-tion in specific target organs, with severe detrimental effects on human health. However, high concentrations of non-absorbed HMs remain in the gut microenvironment, where they may have a direct impact on the gut ecosystem and its overall physiology [1,2]. The gut microbiota has been described as a complex“hidden” organ, which plays a key role in the maintenance of health; hence, the pres-ence or abspres-ence of specific species can be essential for
maintaining homeostasis both inside and outside the in-testinal tract [3,4].
The gastrointestinal epithelium has several essential functions: constituting a physical barrier, ensuring mu-cosal immune responses and excluding or detoxifying harmful intestinal content. These processes are highly influenced by the microbiota via a complex interplay with the host [5-7]. Disturbance of the microbiota (dysbiosis) is associated with an increased risk of developing inflamma-tory diseases, allergic diseases and metabolic disorders; hence, it is of the utmost importance to understand micro-biotal variability if we are to better understand disease states [8,9]. The most studied factors affecting microbiota composition are age, genetic background, diet and anti-biotic consumption [10]. It has also been postulated that exposure to xenobiotic agents from the environment is an important factor shaping the gut microbiota. However, little attention has been given to the potential impact of bioavailable HMs on the commensal microbiota and intestinal homeostasis. We thus sought to characterize possible impact of environmental Pb and Cd on the mi-crobial ecosystem in mice, in order to better understand
* Correspondence:benoit.foligne@ibl.fr 1
Bactéries Lactiques & Immunité des Muqueuses, Centre d‘Infection et d’Immunité de Lille, Institut Pasteur de Lille, U1019, UMR 8204, Université Lille Nord de France, 1 rue du Pr Calmette, Lille cedex BP 245, F-59019, France
Full list of author information is available at the end of the article
© 2013 Breton et al.; licensee BioMed Central Ltd. This is an Open Access article distributed under the terms of the Creative Commons Attribution License (http://creativecommons.org/licenses/by/2.0), which permits unrestricted use, distribution, and reproduction in any medium, provided the original work is properly cited. The Creative Commons Public Domain Dedication waiver (http://creativecommons.org/publicdomain/zero/1.0/) applies to the data made available in this article, unless otherwise stated.
the potential role of environmental factors in the etiology and pathogenesis of gastrointestinal disorders in humans.
Methods
Animals and ethics statement
Twenty-five Balb/C female mice (aged 6 weeks on arrival) were obtained from Charles River (Saint-Germain-sur-l’Arbresle, France). The animals were randomly divided into groups of five and housed in a controlled environ-ment (a temperature of 22°C, a 12 h/12 h light/dark cycle and with ad libitum access to food and water). All animal experiments were performed according to the guidelines of the Institut Pasteur de Lille Animal Care and Use Committee and in compliance with the Amsterdam Protocol on Animal Protection and Welfare and the Directive 86/609/EEC on the Protection of Animals Used for Experimental and Other Scientific Purposes (updated in the Council of Europe’s Appendix A). The animal work was also compliant with French le-gislation (the French Act 87–848, dated 19-10-1987) and the European Communities Amendment of Cruelty to Animals Act 1976. The study’s objectives and procedures were approved by the Ethic and Welfare Committee for Experiments on Animals in France’s Nord-Pas-de-Calais region (approval number: 04/2011).
Animal exposure procedures and experimental set-up Mice were exposed to doses of either Cd (20 or 100 ppm) or Pb (100 or 500 ppm), where ppm correspond to mg
L-1. The metals were administered continuously for
8 weeks by spiking the animals’ drinking water with CdCl2 or PbCl2 solution, as previously described [11]. In order to cover both “environmentally relevant (low)” and“critical” doses of Cd exposure and to mimic Pb poi-soning, the HM doses were selected according to the respective “lowest observed adverse effect” level (LOAEL) for chronic exposure in rodents. Control animals received
water with no added CdCl2 or PbCl2. Fecal pellets and
cecal content were collected in tubes and weighed. Samples were snap-frozen and then stored at−80°C until nucleic acid extraction was performed, as described previ-ously [12].
DNA extraction and PCR amplification
16S rRNA genes were amplified using the PCR primers [13], which target the V5 and V6 hypervariable regions. The forward primer contained the sequence of the Titanium A adaptor (5′-CCATCTCATCCCTGCGTG TCTCCGACTCAG-3′) and a barcode sequence. The reverse primer contained the sequence of Titanium B adaptor primer B: (5′-CCTATCCCCTGTGTGCCTT G-3′). For each sample, a PCR mix of 100 μL contained 1 × PCR buffer, 2 U of KAPA HiFi Hotstart polymerase blend and dNTPs (Kapabiosystems, Clinisciences, Naterre,
France), 300 nM primers (Eurogentec, Liège, Belgium), and 60 ng per g DNA. Thermal cycling consisted of initial denaturation at 95°C for 5 min, followed by 25 cycles of denaturation at 98°C for 20 s, annealing at 56°C for 40 s and extension at 72°C for 20 s, plus final extension at 72°C for 5 min. Amplicons were visualized on 1% agarose. Gels were stained with GelGreen Nucleic Acid gel stain in 1x Tris-acetate-EDTA (TAE) buffer and then cleaned with Wizard SV Gel and PCR Clean-up System (Promega, Charbonnieres les Bains, France), according to the manu-facturer’s instructions.
Amplicon quantitation, pooling, and pyrosequencing Amplicon DNA concentrations were determined using the Quant-iT PicoGreen dsDNA reagent and kit (Life Tech, Carlsbad, CA) following the manufacturer’s in-structions. Assays were carried out using 2μL of cleaned
PCR product in a total reaction volume of 200 μL in
black, 96-well microtiter plates. Following quantitation, cleaned amplicons were combined in equimolar ratios in a single tube .The final pool of DNA was eluted in 100μL of nuclease-free water and purified using an Agencourt Ampure XP Purification Systems, according to the manu-facturer’s instructions (Agencourt Biosciences Corporation-Beckman Coulter, Beverly, MA) and then resuspended in 100μL of TAE 1x. The concentration of the purified pooled DNA was determined using the Quant-iT PicoGreen dsDNA reagent and kit (Life Tech, Carlsbad, CA), accord-ing to the manufacturer’s instructions. Pyrosequencaccord-ing was carried out using primer A on a 454 Life Sciences Genome Sequencer FLX instrument (Roche, Branford, CT) following titanium chemistry.
16S rRNA data analysis
The sequences were assigned to samples as a function of their sample-specific barcodes. The sequences were then checked for the following criteria [14]: (i) an almost per-fect match with the barcode and primers; (ii) at least 240 nucleotides in length (not including barcodes and primers); and (iii) no more than two undetermined bases
(denoted by N). By“an almost perfect match”, we mean
that one mismatch/deletion/insertion per barcode or per primer was allowed. Each pyrosequenced dataset that passed quality control was assigned to a family with the RDP classifier (version 2.1, http://rdp.cme.msu.edu) with a confidence threshold > 80%. The Chao richness esti-mate was calculated with the Mothur software package (for more details, see http://www.mothur.org/wiki/Chao). Denaturing gradient gel electrophoresis (DGGE)
The variable V3 region of the 16S rRNA gene was ampli-fied using the universal bacterial primers F357-GC and R518 [15,16]. The PCR and temperature program have been described elsewhere [17]. The resulting 16S rRNA
amplicons were analyzed by DGGE fingerprinting analysis (the D-Code System from Bio-Rad, Nazareth, Belgium) using 35% to 70% denaturing gels, as previously described [16]. Each lane received 30μl of PCR product and electro-phoresis was performed at 70 V for 990 min. Next, the DGGE gels were stained for 30 min with 1 X SYBR Gold nucleic acid gel stain (S-11494; Invitrogen, Merelbeke, Belgium) in 1 X TAE buffer (Bio-Rad), and the band pro-files were digitized and visualized with a charge-coupled device (CCD) camera and Quantity One software (Bio-Rad). Every fifth or sixth lane contains a reference sample (containing the V3-16S rRNA amplicons of a taxonomic-ally well-characterized strain for each of 12 bacterial species) and fingerprint profiles were normalized using BioNumerics software (version 5.10, Applied Maths, Sint-Martens-Latem, Belgium).
Statistics and data analysis
All statistical analyses were performed by comparing experimental groups with the control group. A non-parametric one–way analysis of variance, Mann–Whitney U-tests or Student’s t tests were used as appropriate. Bac-terial count data are presented as the mean ± standard error of the mean (SEM). The threshold for statistical sig-nificance was set to p < 0.05.
Results and discussion
In the present study, groups of wild-type mice under-went up to of 8 weeks continuous exposure to CdCl2(20
or 100 ppm) or PbCl2(100 or 500 ppm) administered in
their drinking water. In an earlier study, these HM levels were sub-toxic and not associated with hepatotoxicity or changes in behavior, organ weights (liver, spleen and kid-neys), body weight or overall growth (when compared with regular water-treated mice, [11]. Furthermore, none of the HM treatments had a detectable impact on our animals’ food intake, stool consistency or gut motility. Indeed, this was demonstrated by providing oral exogen-ous food-grade microorganisms (such as yeasts and lac-tic bacteria) as feces markers. All the animals exhibited similar transit times and persistence parameters (data not shown).
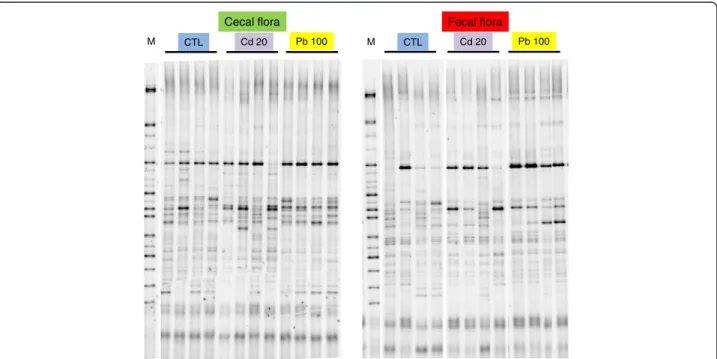
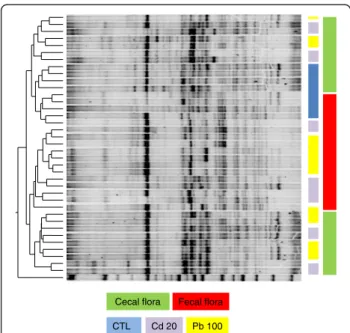
We measured the microbial communities’ profiles in feces and cecal content. On the basis of the DGGE results, an 8-week treatment with either Cd or Pb did not significantly modify the murine microbiota at ei-ther sampling site (Figure 1). A discriminant analysis of band classes (performed with Bionumerics soft-ware) enabled us to distinguish between fecal and co-lonic samples (Figure 2) and between control samples and HM-treated samples but did not pinpoint sys-tematic differences between Pb and Cd treatments or between low and high concentrations of the HMs (results not shown). This finding contrasts with a re-cent report in which oral Cd had harmful effects on the viability of some components of the mouse microbiota [18]. This disparity might be explained by the fact that Fazeli and coworkers used restrictive
Cecal flora Fecal flora
CTL Cd 20 Pb 100 CTL Cd 20 Pb 100
M M
Figure 1 DGGE profiles revealed microbial diversity in the cecum content and fecal pellets of mice exposed for 8 weeks to Cd and Pb salts via their drinking water. The figure shows DGGE gels of the V5-V6 hypervariable 16S rDNA region, illustrating the microbiota’s composition in the cecum and the feces of 4 mice treated (or not) with 20 mg L-1(ppm) of Cd or 100 mg L-1(ppm) of Pb.
conventional culture methods, whereas we used a molecu-lar approach.
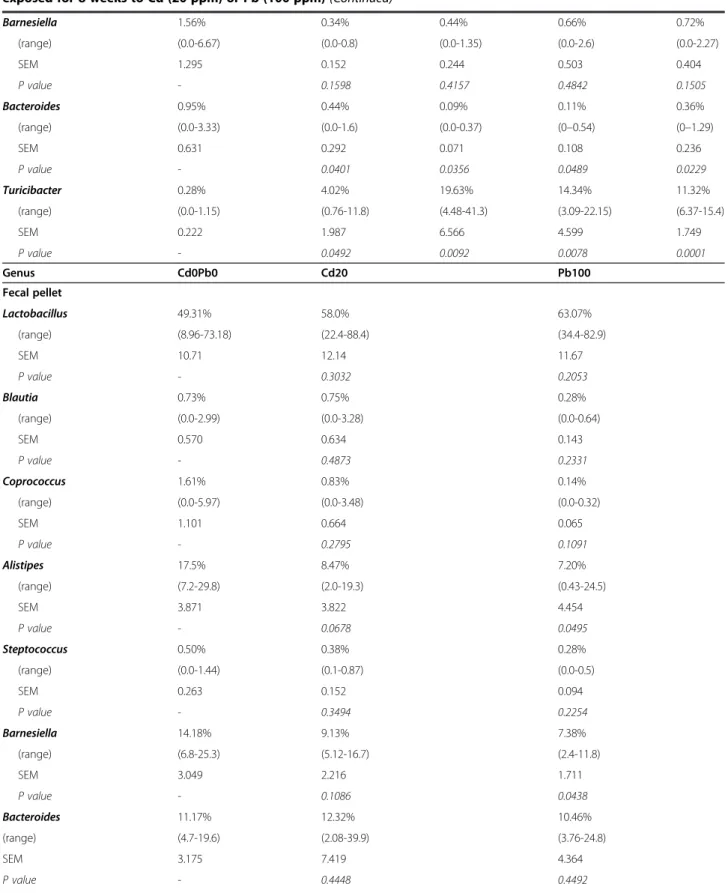
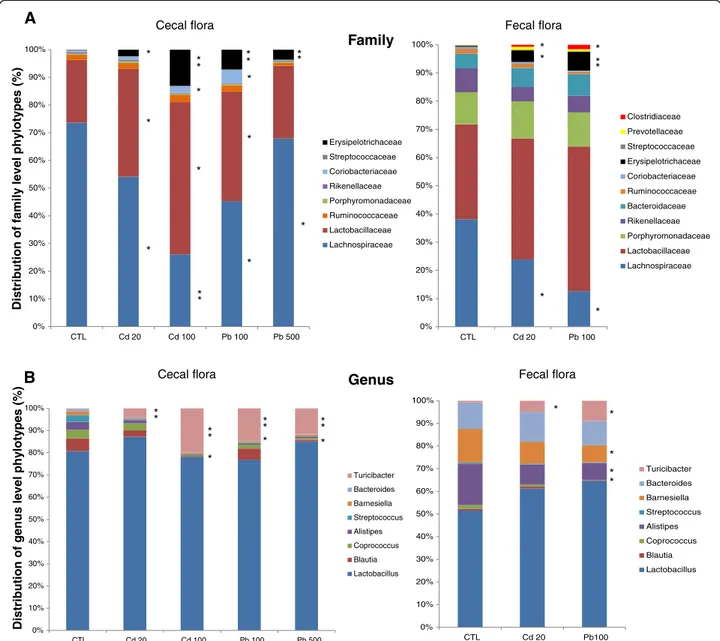
A more in-depth analysis of the cecal and fecal microbiome was carried out via 454 pyrosequencing of the V5-V6 region of the 16S rRNA (Table 1, Figures 3 and 4). We generated a dataset consisting of 197,143 fil-tered, high-quality 16S rRNA gene sequences (mean ± SD number of sequences per sample: 11,596 ± 6060). With operational taxonomic unit (OTU) cut-offs of 0.03, 0.05 or 0.10, the samples from the Cd, Pb and control groups did not differ significantly in terms of microbial richness (as estimated by the Chao richness index) or biodiversity (assessed by a nonparametric Shannon index). With an OTU cut-off of 0.03, the mean number of clusters was 1244 ± 381. The abundance of the two major phyla (the Firmicutes and Bacteroidetes) was similar in all three groups, whereas there were few Actinobacteria (Figure 3). In contrast, treatment with the two HMs was associ-ated with a change in the composition of the colonic microbiota at both the family and genus levels. In fact, eight weeks of oral Cd or Pb treatment caused small but statistically significant differences in num-bers of Prevotellaceae and Clostridiaceae (especially in the feces). Significant differences (p < 0.05) in the rela-tive abundance of several other families in both cecal and fecal samples were observed, with low numbers of Lachnospiraceae and high numbers of Lactobacilla-ceae and ErysipelotrichaLactobacilla-ceae in the HM-treated groups
(Figure 4A). Within the Erysipelotrichaceae family, num-bers of Turicibacter (Figure 4B), coprococci, streptococci, Blautia, Barneselia and Allistipes were higher in HM-treated groups than in controls. In general, we observed lower genus diversity in the HM-treated groups. Low bacterial diversity and low number of Lachnospiraceae have been linked to intestinal inflammation and consid-ered as a predisposition to colitis [19,20]. Whether changes in Lachnospiraceae, Lactobacillaceae and Erysipelotricha-ceae are consistently linked with inflammation remains to be established. However, the frequent literature re-ports on changes in the abundance of these groups in the mouse microbiome indicate that these groups are more sensitive to external factors than other, less abun-dant groups are. However, cautious interpretation is ne-cessary because of the low family-level resolution of metagenomics, which prevents reliable microbial com-munity analyses under in inflammatory conditions, for example [21].
The genus Turicibacter was previously detected in the ileal pouch of an ulcerative colitis patient [22], in human appendicitis [23] and in infectious states in piglets. Inter-estingly, high levels of Turicibacter were observed in mice fed an iron-free diet (in which these bacteria might favor anti-inflammatory effects) [24] and in colitis-resistant CD8-knock-out mice (where it is potentially involved in the anti-inflammatory phenotype) [25]. The ongoing se-quencing of several Turicibacter spp genomes will hopefully clarify their function as part of the micro-biota and elucidate their role(s) in the interaction be-tween HM exposure and inflammation [26]. Lastly, the lactobacilli’s apparent ability to tolerate HMs might be helpful for bioremediation purposes, since some mi-croorganisms can bind labile metal ions and remove them from the environment [27]. In theory, HM-resistant, innocuous strains with anti-oxidant and anti-inflammatory properties could be used as probio-tics by combining their chelating properties with tar-geted treatment of the xenobiotics’ harmful effects on the host’s microbiota [28,29].
Laboratory mice have a less complex gut microbiota than humans and there are only slight mouse-to-mouse variations when groups of individuals are housed to-gether. Nevertheless, HM-associated differences in the microbiota were observed in all individual, exposed mice (data not shown). Our DGGE and metagenomics results confirmed a clear link between ingestion of HMs and the composition of the gut microbiota. The marked, environmentally-induced alteration in the gut microbiota also suggests a link between HM exposure and inflam-mation. However, the functional classification of groups of bacteria as“predisposing”, “colitogenic” or even “pro-tective” is hotly debated and difficult to investigate [23]. Besides producing quantitative and qualitative changes
Cecal flora Fecal flora
CTL Cd 20 Pb 100
Figure 2 An unweighted pair group method with arithmetic mean tree of the same gels. Pairwise similarities were calculated with BioNumerics software (version 6.6.4), using a Dice coefficient with 0% optimization, 0.3664% fixed tolerance, exclusion of uncertain bands and no relaxed doublet matching, fuzzy logic or area sensitivity.
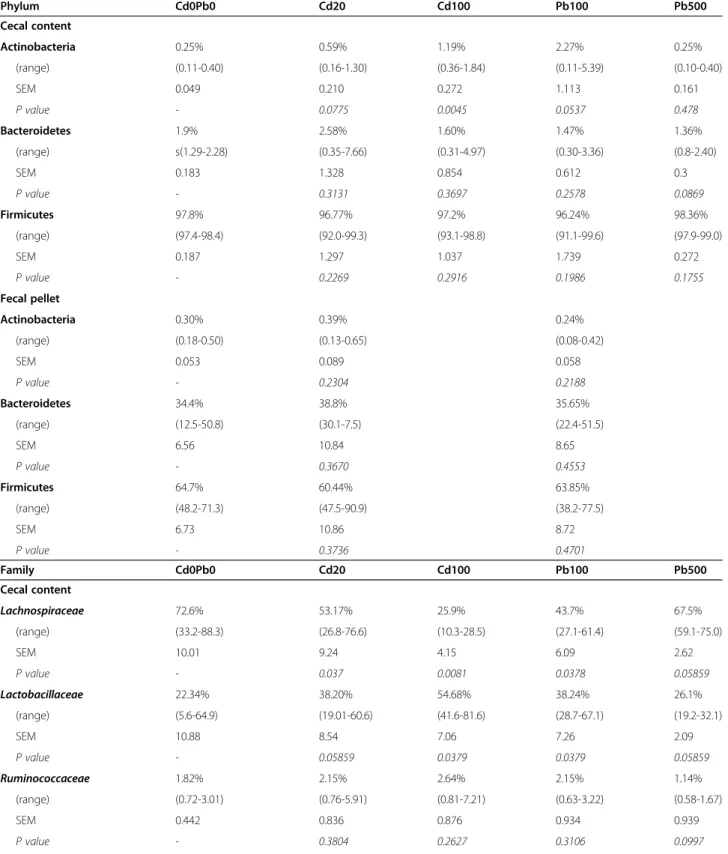
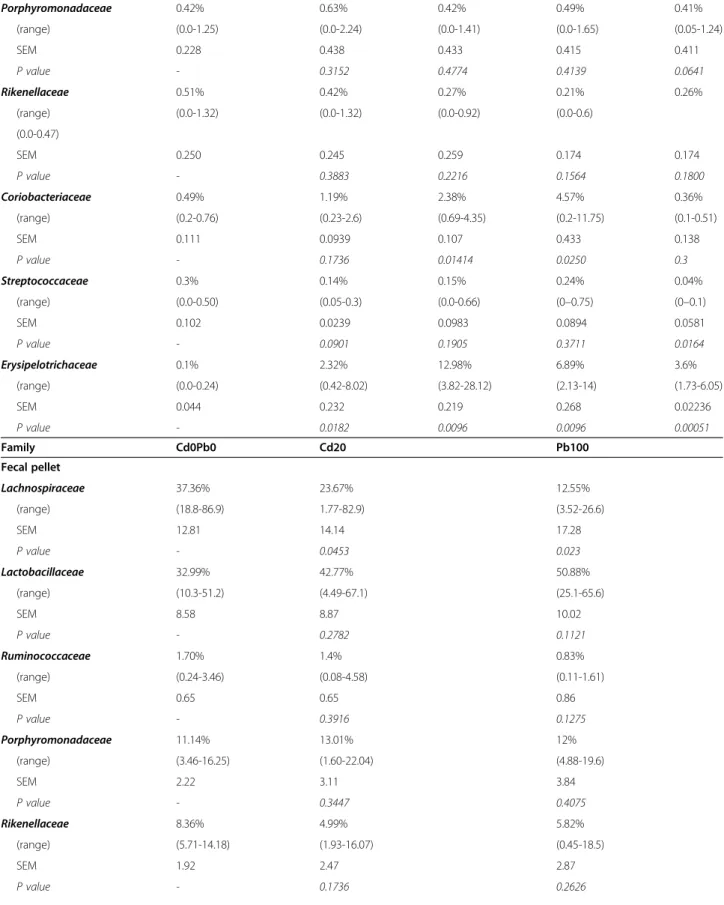
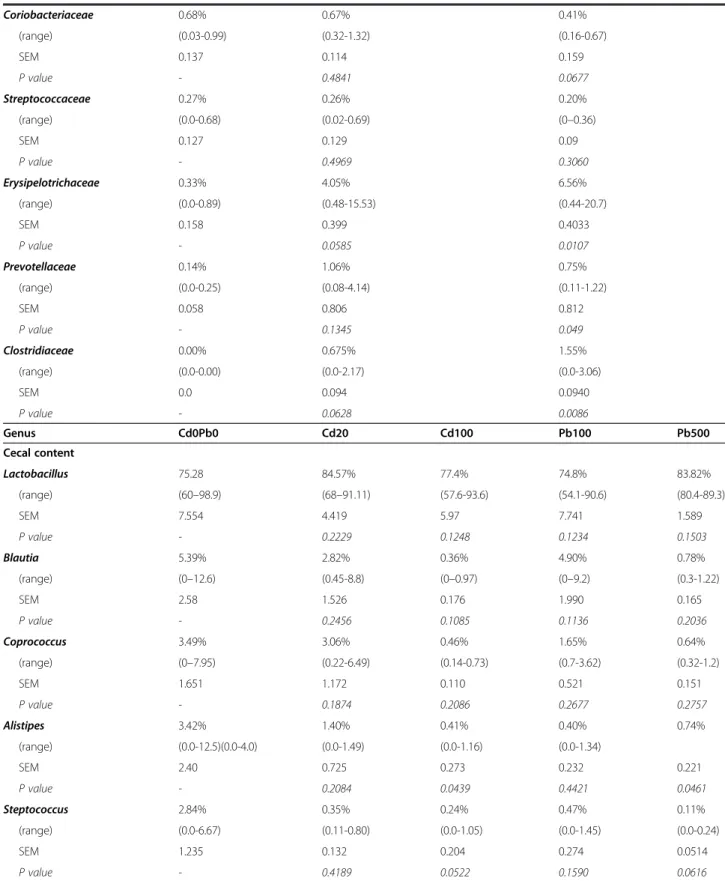
Table 1 Relative distributions of bacterial phylotypes, families and genera in (i) the cecum content of mice orally exposed for 8 weeks to Cd (20 or 100 ppm) or Pb (100 or 500 ppm) salts and (ii) the fecal pellets for mice orally exposed for 8 weeks to Cd (20 ppm) or Pb (100 ppm)
Phylum Cd0Pb0 Cd20 Cd100 Pb100 Pb500 Cecal content Actinobacteria 0.25% 0.59% 1.19% 2.27% 0.25% (range) (0.11-0.40) (0.16-1.30) (0.36-1.84) (0.11-5.39) (0.10-0.40) SEM 0.049 0.210 0.272 1.113 0.161 P value - 0.0775 0.0045 0.0537 0.478 Bacteroidetes 1.9% 2.58% 1.60% 1.47% 1.36% (range) s(1.29-2.28) (0.35-7.66) (0.31-4.97) (0.30-3.36) (0.8-2.40) SEM 0.183 1.328 0.854 0.612 0.3 P value - 0.3131 0.3697 0.2578 0.0869 Firmicutes 97.8% 96.77% 97.2% 96.24% 98.36% (range) (97.4-98.4) (92.0-99.3) (93.1-98.8) (91.1-99.6) (97.9-99.0) SEM 0.187 1.297 1.037 1.739 0.272 P value - 0.2269 0.2916 0.1986 0.1755 Fecal pellet Actinobacteria 0.30% 0.39% 0.24% (range) (0.18-0.50) (0.13-0.65) (0.08-0.42) SEM 0.053 0.089 0.058 P value - 0.2304 0.2188 Bacteroidetes 34.4% 38.8% 35.65% (range) (12.5-50.8) (30.1-7.5) (22.4-51.5) SEM 6.56 10.84 8.65 P value - 0.3670 0.4553 Firmicutes 64.7% 60.44% 63.85% (range) (48.2-71.3) (47.5-90.9) (38.2-77.5) SEM 6.73 10.86 8.72 P value - 0.3736 0.4701 Family Cd0Pb0 Cd20 Cd100 Pb100 Pb500 Cecal content Lachnospiraceae 72.6% 53.17% 25.9% 43.7% 67.5% (range) (33.2-88.3) (26.8-76.6) (10.3-28.5) (27.1-61.4) (59.1-75.0) SEM 10.01 9.24 4.15 6.09 2.62 P value - 0.037 0.0081 0.0378 0.05859 Lactobacillaceae 22.34% 38.20% 54.68% 38.24% 26.1% (range) (5.6-64.9) (19.01-60.6) (41.6-81.6) (28.7-67.1) (19.2-32.1) SEM 10.88 8.54 7.06 7.26 2.09 P value - 0.05859 0.0379 0.0379 0.05859 Ruminococcaceae 1.82% 2.15% 2.64% 2.15% 1.14% (range) (0.72-3.01) (0.76-5.91) (0.81-7.21) (0.63-3.22) (0.58-1.67) SEM 0.442 0.836 0.876 0.934 0.939 P value - 0.3804 0.2627 0.3106 0.0997
Table 1 Relative distributions of bacterial phylotypes, families and genera in (i) the cecum content of mice orally exposed for 8 weeks to Cd (20 or 100 ppm) or Pb (100 or 500 ppm) salts and (ii) the fecal pellets for mice orally exposed for 8 weeks to Cd (20 ppm) or Pb (100 ppm) (Continued)
Porphyromonadaceae 0.42% 0.63% 0.42% 0.49% 0.41% (range) (0.0-1.25) (0.0-2.24) (0.0-1.41) (0.0-1.65) (0.05-1.24) SEM 0.228 0.438 0.433 0.415 0.411 P value - 0.3152 0.4774 0.4139 0.0641 Rikenellaceae 0.51% 0.42% 0.27% 0.21% 0.26% (range) (0.0-1.32) (0.0-1.32) (0.0-0.92) (0.0-0.6) (0.0-0.47) SEM 0.250 0.245 0.259 0.174 0.174 P value - 0.3883 0.2216 0.1564 0.1800 Coriobacteriaceae 0.49% 1.19% 2.38% 4.57% 0.36% (range) (0.2-0.76) (0.23-2.6) (0.69-4.35) (0.2-11.75) (0.1-0.51) SEM 0.111 0.0939 0.107 0.433 0.138 P value - 0.1736 0.01414 0.0250 0.3 Streptococcaceae 0.3% 0.14% 0.15% 0.24% 0.04% (range) (0.0-0.50) (0.05-0.3) (0.0-0.66) (0–0.75) (0–0.1) SEM 0.102 0.0239 0.0983 0.0894 0.0581 P value - 0.0901 0.1905 0.3711 0.0164 Erysipelotrichaceae 0.1% 2.32% 12.98% 6.89% 3.6% (range) (0.0-0.24) (0.42-8.02) (3.82-28.12) (2.13-14) (1.73-6.05) SEM 0.044 0.232 0.219 0.268 0.02236 P value - 0.0182 0.0096 0.0096 0.00051 Family Cd0Pb0 Cd20 Pb100 Fecal pellet Lachnospiraceae 37.36% 23.67% 12.55% (range) (18.8-86.9) 1.77-82.9) (3.52-26.6) SEM 12.81 14.14 17.28 P value - 0.0453 0.023 Lactobacillaceae 32.99% 42.77% 50.88% (range) (10.3-51.2) (4.49-67.1) (25.1-65.6) SEM 8.58 8.87 10.02 P value - 0.2782 0.1121 Ruminococcaceae 1.70% 1.4% 0.83% (range) (0.24-3.46) (0.08-4.58) (0.11-1.61) SEM 0.65 0.65 0.86 P value - 0.3916 0.1275 Porphyromonadaceae 11.14% 13.01% 12% (range) (3.46-16.25) (1.60-22.04) (4.88-19.6) SEM 2.22 3.11 3.84 P value - 0.3447 0.4075 Rikenellaceae 8.36% 4.99% 5.82% (range) (5.71-14.18) (1.93-16.07) (0.45-18.5) SEM 1.92 2.47 2.87 P value - 0.1736 0.2626
Table 1 Relative distributions of bacterial phylotypes, families and genera in (i) the cecum content of mice orally exposed for 8 weeks to Cd (20 or 100 ppm) or Pb (100 or 500 ppm) salts and (ii) the fecal pellets for mice orally exposed for 8 weeks to Cd (20 ppm) or Pb (100 ppm) (Continued)
Coriobacteriaceae 0.68% 0.67% 0.41% (range) (0.03-0.99) (0.32-1.32) (0.16-0.67) SEM 0.137 0.114 0.159 P value - 0.4841 0.0677 Streptococcaceae 0.27% 0.26% 0.20% (range) (0.0-0.68) (0.02-0.69) (0–0.36) SEM 0.127 0.129 0.09 P value - 0.4969 0.3060 Erysipelotrichaceae 0.33% 4.05% 6.56% (range) (0.0-0.89) (0.48-15.53) (0.44-20.7) SEM 0.158 0.399 0.4033 P value - 0.0585 0.0107 Prevotellaceae 0.14% 1.06% 0.75% (range) (0.0-0.25) (0.08-4.14) (0.11-1.22) SEM 0.058 0.806 0.812 P value - 0.1345 0.049 Clostridiaceae 0.00% 0.675% 1.55% (range) (0.0-0.00) (0.0-2.17) (0.0-3.06) SEM 0.0 0.094 0.0940 P value - 0.0628 0.0086 Genus Cd0Pb0 Cd20 Cd100 Pb100 Pb500 Cecal content Lactobacillus 75.28 84.57% 77.4% 74.8% 83.82% (range) (60–98.9) (68–91.11) (57.6-93.6) (54.1-90.6) (80.4-89.3) SEM 7.554 4.419 5.97 7.741 1.589 P value - 0.2229 0.1248 0.1234 0.1503 Blautia 5.39% 2.82% 0.36% 4.90% 0.78% (range) (0–12.6) (0.45-8.8) (0–0.97) (0–9.2) (0.3-1.22) SEM 2.58 1.526 0.176 1.990 0.165 P value - 0.2456 0.1085 0.1136 0.2036 Coprococcus 3.49% 3.06% 0.46% 1.65% 0.64% (range) (0–7.95) (0.22-6.49) (0.14-0.73) (0.7-3.62) (0.32-1.2) SEM 1.651 1.172 0.110 0.521 0.151 P value - 0.1874 0.2086 0.2677 0.2757 Alistipes 3.42% 1.40% 0.41% 0.40% 0.74% (range) (0.0-12.5)(0.0-4.0) (0.0-1.49) (0.0-1.16) (0.0-1.34) SEM 2.40 0.725 0.273 0.232 0.221 P value - 0.2084 0.0439 0.4421 0.0461 Steptococcus 2.84% 0.35% 0.24% 0.47% 0.11% (range) (0.0-6.67) (0.11-0.80) (0.0-1.05) (0.0-1.45) (0.0-0.24) SEM 1.235 0.132 0.204 0.274 0.0514 P value - 0.4189 0.0522 0.1590 0.0616
Table 1 Relative distributions of bacterial phylotypes, families and genera in (i) the cecum content of mice orally exposed for 8 weeks to Cd (20 or 100 ppm) or Pb (100 or 500 ppm) salts and (ii) the fecal pellets for mice orally exposed for 8 weeks to Cd (20 ppm) or Pb (100 ppm) (Continued)
Barnesiella 1.56% 0.34% 0.44% 0.66% 0.72% (range) (0.0-6.67) (0.0-0.8) (0.0-1.35) (0.0-2.6) (0.0-2.27) SEM 1.295 0.152 0.244 0.503 0.404 P value - 0.1598 0.4157 0.4842 0.1505 Bacteroides 0.95% 0.44% 0.09% 0.11% 0.36% (range) (0.0-3.33) (0.0-1.6) (0.0-0.37) (0–0.54) (0–1.29) SEM 0.631 0.292 0.071 0.108 0.236 P value - 0.0401 0.0356 0.0489 0.0229 Turicibacter 0.28% 4.02% 19.63% 14.34% 11.32% (range) (0.0-1.15) (0.76-11.8) (4.48-41.3) (3.09-22.15) (6.37-15.4) SEM 0.222 1.987 6.566 4.599 1.749 P value - 0.0492 0.0092 0.0078 0.0001 Genus Cd0Pb0 Cd20 Pb100 Fecal pellet Lactobacillus 49.31% 58.0% 63.07% (range) (8.96-73.18) (22.4-88.4) (34.4-82.9) SEM 10.71 12.14 11.67 P value - 0.3032 0.2053 Blautia 0.73% 0.75% 0.28% (range) (0.0-2.99) (0.0-3.28) (0.0-0.64) SEM 0.570 0.634 0.143 P value - 0.4873 0.2331 Coprococcus 1.61% 0.83% 0.14% (range) (0.0-5.97) (0.0-3.48) (0.0-0.32) SEM 1.101 0.664 0.065 P value - 0.2795 0.1091 Alistipes 17.5% 8.47% 7.20% (range) (7.2-29.8) (2.0-19.3) (0.43-24.5) SEM 3.871 3.822 4.454 P value - 0.0678 0.0495 Steptococcus 0.50% 0.38% 0.28% (range) (0.0-1.44) (0.1-0.87) (0.0-0.5) SEM 0.263 0.152 0.094 P value - 0.3494 0.2254 Barnesiella 14.18% 9.13% 7.38% (range) (6.8-25.3) (5.12-16.7) (2.4-11.8) SEM 3.049 2.216 1.711 P value - 0.1086 0.0438 Bacteroides 11.17% 12.32% 10.46% (range) (4.7-19.6) (2.08-39.9) (3.76-24.8) SEM 3.175 7.419 4.364 P value - 0.4448 0.4492
in the gut microbiota, HMs also impact (directly or in-directly) intestinal homeostasis through their many local effects (on the epithelia mucosa) and systemic effects. Indeed, we previously reported that chronic ingestion of Cd and Pb induced (i) anemia and tissue iron loss from tissues, (ii) slight but consistent changes in the expres-sion of transport-related genes, (iii) the small intestine and colon’s oxidative and inflammatory status and (iv) genotoxicity [11]. It is difficult to predict the net inflam-matory balance in this context, since both harmful and adaptive events occur together. We also recently empha-sized the key role of the microbiota in the process of HM absorption and dissemination throughout the body - illustrating the complex metal-microbe-host interplay that operates [30]. Our present ecotoxicological results complement that first attempt to identify the impact of HMs on the gut’s microbial ecology. This is in line with the need to develop a more comprehensive view of environmental exposure, i.e. one that is not restricted
to the mere entry of xenobiotics into the body but also takes account of inflammation, oxidative stress, other gut flora, metabolic processes and a continually fluctuating chemical environment. Defining this type
of integrated “exposome” may provide a way of
caus-ally linking long-term exposure to the occurrence of chronic disease [31].
Conclusions
Non-absorbed heavy metals have a direct impact on the gut microbiota. In turn, this may impact the alimentary tract and overall gut homeostasis. Our results may en-able more accurate assessment of the risk of intestinal disease associated with heavy metal ingestion. Further studies are needed to understand the complex crosstalk between the gut microbiota and the host, interpret the clinical consequences of exposure to xenobiotics and as-sess the relationship between the environment and dis-ease susceptibility.
Table 1 Relative distributions of bacterial phylotypes, families and genera in (i) the cecum content of mice orally exposed for 8 weeks to Cd (20 or 100 ppm) or Pb (100 or 500 ppm) salts and (ii) the fecal pellets for mice orally exposed for 8 weeks to Cd (20 ppm) or Pb (100 ppm) (Continued)
Turicibacter 0.75% 4.81% 8.71%
(range) (0.0-1.49) (0.82-17.6) (2.84-28.24)
SEM 0.307 3.236 4.996
P value - 0.0483 0.0281
Data are expressed as the mean, range and SEM percentage abundance of the total assignment (n = 5 animals per group) and the corresponding p value is given in italics. The threshold for statistical significance was set to p < 0.05.
Actinobacteria Bacteroidetes Firmicutes Cecal flora Control Cadmium 20 ppm Lead 100 ppm Phylum Lead 500 ppm Cadmium 100 ppm Fecal flora
Control Cadmium20 ppm 100 ppm Lead
Actinobacteria Bacteroidetes Firmicutes
Figure 3 Distribution of bacterial phylotypes in the cecum content and fecal pellets of mice exposed for 8 weeks to Cd (20 or 100 ppm) or Pb (100 or 500 ppm) salts via their drinking water. 16S rRNA-base analyses were derived from 454/Roche multitag pyrose-quencing. Data are expressed as the mean percentage abundance of the total assignment (n = 5 animals per group). In line with the literature data, most of the bacteria in untreated (control) mice belonged to Firmicutes or the Bacteroidetes, whereas Actinobacteria were very rare.
Competing interests
None of all authors have conflicts of interest to declare.
Authors’ contributions
BF and BP: study conception and design and drafting of the manuscript; BF, JB, SM, EDB and PVD: data acquisition; BF, SM, PVD and BP: data analysis and interpretation. All authors read and approved the final manuscript.
Acknowledgments
This study was funded by a grant from the French National Research Agency (ANR-09-CES-016: Mélodie-Reve). The authors thank Dr Fabienne Jean for her assistance with project management and Humphrey Bihain-Tasseur for valuable advice.
Author details 1
Bactéries Lactiques & Immunité des Muqueuses, Centre d‘Infection et d’Immunité de Lille, Institut Pasteur de Lille, U1019, UMR 8204, Université Lille Nord de France, 1 rue du Pr Calmette, Lille cedex BP 245, F-59019, France.2DNAVision SA, avenue George Lemaitre 25, Charleroi B-6041,
Belgium.3Laboratory of Microbiology, Faculty of Sciences, Ledeganckstraat 35, Ghent B-9000, Belgium.
Received: 13 October 2013 Accepted: 4 December 2013 Published: 11 December 2013
References
1. Zalups RK, Ahmad S: Molecular handling of cadmium in transporting epithelia. Toxicol Appl Pharmacol 2003, 186(3):163–188.
0% 10% 20% 30% 40% 50% 60% 70% 80% 90% 100% CTL Cd 20 Cd 100 Pb 100 Pb 500 Erysipelotrichaceae Streptococcaceae Coriobacteriaceae Rikenellaceae Porphyromonadaceae Ruminococcaceae Lactobacillaceae Lachnospiraceae
Cecal flora Fecal flora
0% 10% 20% 30% 40% 50% 60% 70% 80% 90% 100% CTL Cd 20 Pb 100 Clostridiaceae Prevotellaceae Streptococcaceae Erysipelotrichaceae Coriobacteriaceae Ruminococcaceae Bacteroidaceae Rikenellaceae Porphyromonadaceae Lactobacillaceae Lachnospiraceae * * * * * * * * * * * * * * * * * * * ** * * * * * * * * * * * * * * ** * * *
A
B
Family GenusCecal flora Fecal flora
Distribution of family lev el phy loty pes (% ) Distribution of genus lev e l phy lot y p es (% ) 0% 10% 20% 30% 40% 50% 60% 70% 80% 90% 100% CTL Cd 20 Pb100 Turicibacter Bacteroides Barnesiella Streptococcus Alistipes Coprococcus Blautia Lactobacillus 0% 10% 20% 30% 40% 50% 60% 70% 80% 90% 100% CTL Cd 20 Cd 100 Pb 100 Pb 500 Turicibacter Bacteroides Barnesiella Streptococcus Alistipes Coprococcus Blautia Lactobacillus
Figure 4 Distribution of bacterial subgroups in the cecum content and fecal pellets of mice exposed for 8 weeks to Cd (20 or 100 mg L-1)
or Pb (100 or 500 mg L-1) salts via their drinking water. (A) Family-level and (B) genus-level. 16S rRNA-base analyses were derived from
454/Roche multitag pyrosequencing. Data are expressed as the mean percentage abundance (n = 5 animals per group). Only operational taxonomic units (OTU’s) present in dominant families (> 0.1%) were considered. *: p < 0.05 and **: p < 0.01: significantly different from the control group (water with no added Cd or Pb) for the corresponding taxa. The color code is defined in the inset on the right of the Figure.
2. James HM, Hilburn ME, Blair JA: Effects of meals and meal times on uptake of lead from the gastrointestinal tract in humans. Hum Toxicol 1985, 4(4):401–407.
3. O’Hara AM, Shanahan F: The gut flora as a forgotten organ. EMBO 2006, 7(7):688–693. Rep.
4. Sekirov I, Russell SL, Antunes LC, Finlay BB: Gut microbiota in health and disease. Physiol Rev 2010, 90(3):859–904.
5. Leser TD, Molbak L: Better living through microbial action: the benefits of the mammalian gastrointestinal microbiota on the host. Environ Microbiol 2009, 11(9):2194–2206.
6. Nicholson JK, Holmes E, Wilson ID: Gut microorganisms, mammalian metabolism and personalized health care. Nat Rev Microbiol 2005, 3(5):431–438.
7. Claus SP, Ellero SL, Berger B, Krause L, Bruttin A, Molina J, Paris A, Want EJ, de Waziers I, Cloarec O, et al: Colonization-induced host-gut microbial metabolic interaction. MBio 2011, 2(2):e00271–10.
8. DuPont AW, DuPont HL: The intestinal microbiota and chronic disorders of the gut. Nat Rev Gastroenterol Hepatol 2011, 8(9):523–531.
9. Clemente JC, Ursell LK, Parfrey LW, Knight R: The impact of the gut microbiota on human health: an integrative view. Cell 2012, 148(6):1258–1270. 10. Lozupone CA, Stombaugh JI, Gordon JI, Jansson JK, Knight R: Diversity,
stability and resilience of the human gut microbiota. Nature 2012, 489(7415):220–230.
11. Breton J, Le Clère K, Daniel C, Sauty M, Nakab L, Chassat T, Dewulf J, Penet S, Carnoy C, Thomas P, et al: Chronic ingestion of cadmium and lead alters the bioavailability of essential and heavy metals, gene expression pathways and genotoxicity in mouse intestine. Arch Toxicol 2013, 87(10):1787–1795.
12. Matsuda K, Tsuji H, Asahara T, Matsumoto K, Takada T, Nomoto K: Establishment of an analytical system for the human fecal microbiota, based on reverse transcription-quantitative PCR targeting of multicopy rRNA molecules. Appl Environ Microbiol 2009, 75(7):1961–1969.
13. Andersson AF, Riemann L, Bertilsson S: Pyrosequencing reveals contrasting seasonal dynamics of taxa within Baltic Sea bacterioplankton
communities. ISME J 2010, 4(2):171–181.
14. De Filippo C, Cavalieri D, Di Paola M, Ramazzotti M, Poullet JB, Massart S, Collini S, Pieraccini G, Lionetti P: Impact of diet in shaping gut microbiota revealed by a comparative study in children from Europe and rural Africa. Proc Natl Acad Sci U S A 2010, 107(33):14691–14696.
15. Yu Z, Morrison M: Comparisons of different hypervariable regions of rrs genes for use in fingerprinting of microbial communities by PCR-denaturing gradient gel electrophoresis. Appl Environ Microbiol 2004, 70(8):4800–4806. 16. Temmerman R, Scheirlinck I, Huys G, Swings J: Culture-independent
analysis of probiotic products by denaturing gradient gel electrophoresis. Appl Environ Microbiol 2003, 69(1):220–226.
17. Vanhoutte T, Huys G, De Brandt E, Swings J: Temporal stability analysis of the microbiota in human feces by denaturing gradient gel electrophoresis using universal and group-specific 16S rRNA gene primers. FEMS Microbiol Ecol 2004, 48(3):437–446.
18. Fazeli M, Hassanzadeh P, Alaei S: Cadmium chloride exhibits a profound toxic effect on bacterial microflora of the mice gastrointestinal tract. Hum Exp Toxicol 2011, 30(2):152–159.
19. Lepage P, Häsler R, Spehlmann ME, Rehman A, Zvirbliene A, Begun A, Ott S, Kupcinskas L, Doré J, Raedler A, Schreiber S: Twin study indicates loss of interaction between microbiota and mucosa of patients with ulcerative colitis. Gastroenterology 2011, 141(1):227–236.
20. Brinkman BM, Hildebrand F, Kubica M, Goosens D, Del Favero J, Declercq W, Raes J, Vandenabeele P: Caspase deficiency alters the murine gut microbiome. Cell Death Dis 2011, 2:e220.
21. Berry D, Schwab C, Milinovich G, Reichert J, Ben Mahfoudh K, Decker T, Engel M, Hai B, Hainzl E, Heider S, et al: Phylotype-level 16S rRNA analysis reveals new bacterial indicators of health state in acute murine colitis. ISME J 2012, 6(11):2091–2106.
22. Falk A, Olsson C, Ahrné S, Molin G, Adawi D, Jeppsson B: Ileal pelvic pouch microbiota from two former ulcerative colitis patients, analysed by DNA-based methods, were unstable over time and showed the presence of Clostridium perfringens. Scand J Gastroenterol 2007, 42(8):973–985. 23. Bosshard PP, Zbinden R, Altwegg M: Turicibacter sanguinis gen. nov., sp.
nov., a novel anaerobic, Gram-positive bacterium. Int J Syst Evol Microbiol 2002, 52(Pt4):1263–1266.
24. Werner T, Wagner SJ, Martínez I, Walter J, Chang JS, Clavel T, Kisling S, Schuemann K, Haller D: Depletion of luminal iron alters the gut microbiota and prevents Crohn’s disease-like ileitis. Gut 2011, 60(3):325–333. 25. Presley LL, Wei B, Braun J, Borneman J: Bacteria associated with
immunoregulatory cells in mice. Appl Environ Microbiol 2010, 76(3):936–941.
26. Po C, Klaassens ES, Durkin AS, Harkins DM, Foster L, McCorrison J, Torralba M, Nelson KE, Morrison M: Draft genome sequence of Turicibacter sanguinis PC909, isolated from human feces. J Bacteriol 2011, 193(5):1288–1289. 27. Upreti RK, Shrivastava R, Chaturvedi UC: Gut microflora & toxic metals:
chromium as a model. Indian J Med Res 2004, 119(2):49–59.
28. Lemon KP, Armitage GC, Relman DA, Fischbach MA: Microbiota-targeted therapies: an ecological perspective. Sci Transl Med 2012, 4(137):137. rv5. 29. Quigley EM: Prebiotics and probiotics; modifying and mining the
microbiota. Pharmacol Res 2010, 61(3):213–218.
30. Breton J, Daniel C, Dewulf J, Pothion S, Froux N, Sauty M, Thomas P, Pot B, Foligné B: Gut microbiota limits heavy metals burden caused by chronic oral exposure. Toxicol Lett 2013, 222(2):132–138.
31. Rappaport SM, Smith MT: Epidemiology environment and disease risks. Science 2010, 330(6003):460–461.
doi:10.1186/2050-6511-14-62
Cite this article as: Breton et al.: Ecotoxicology inside the gut: impact of heavy metals on the mouse microbiome. BMC Pharmacology and Toxicology 2013 14:62.
Submit your next manuscript to BioMed Central and take full advantage of:
• Convenient online submission
• Thorough peer review
• No space constraints or color figure charges
• Immediate publication on acceptance
• Inclusion in PubMed, CAS, Scopus and Google Scholar
• Research which is freely available for redistribution
Submit your manuscript at www.biomedcentral.com/submit