HAL Id: hal-00995211
https://hal.archives-ouvertes.fr/hal-00995211
Submitted on 22 May 2014HAL is a multi-disciplinary open access archive for the deposit and dissemination of sci-entific research documents, whether they are pub-lished or not. The documents may come from teaching and research institutions in France or abroad, or from public or private research centers.
L’archive ouverte pluridisciplinaire HAL, est destinée au dépôt et à la diffusion de documents scientifiques de niveau recherche, publiés ou non, émanant des établissements d’enseignement et de recherche français ou étrangers, des laboratoires publics ou privés.
Characterization of Attackers’ Profiles J. Briffaut, P.
Clemente, J.-F. Lalande, J. Rouzaud-Cornabas
Jérémy Briffaut, Patrice Clemente, Jean-François Lalande, Jonathan
Rouzaud-Cornabas
To cite this version:
Jérémy Briffaut, Patrice Clemente, Jean-François Lalande, Jonathan Rouzaud-Cornabas. From Man-ual Cyber Attacks Forensic to Automatic Characterization of Attackers’ Profiles J. Briffaut, P. Clemente, J.-F. Lalande, J. Rouzaud-Cornabas. 2011. �hal-00995211�
Attacks Forensic to
Automatic Characterization
of Attackers’ Profiles
J. Briffaut, P. Clemente,
J.-F. Lalande, J. Rouzaud-Cornabas
LIFO, Université d’Orléans
to Automatic Characterization of Attackers’ Profiles
J. Briffaut, P. Clemente, J.-F. Lalande, J. Rouzaud-Cornabas
LIFOEnsi de Bourges – Universite d’Orléans France
Abstract
This chapter studies the activities of cyber attackers on a large scale honeypot run-ning for more than 2 years. A honeypot is a set of online computers that welcome attackers and let them perform their attacks. The chapter presents how to classify complex distributed sessions of attacks.
The first part of this chapter analyzes the illegal activities performed by attackers using the data collected during two years of attacks: logged sessions, intrusion detection system alerts, mandatory access control system alerts. The study of these illegal activities allows to understand the global motivations of the cyber attackers, their technical skills and the geographical location of the attackers and their targets. The second part of this chapter presents generic methods to rebuild the illegal ac-tivities appearing on several attacked hosts. By correlating information collected by multiple sources (loggers, monitors, detectors) both watching at the network and the operations occurring on each system, we provide precise and high level characterization of attacks. The proposed method follows an incremental approach that characterizes attacks from basic ones to highly complex malicious activities, including largely distributed attacks (migrating/hopping attacks, distributed denials of service). This work reveals the global goals of attackers that take control of mul-tiple hosts to launch massive attacks on big universities, industries, or governmental organisations. Experimental results of these forensic and high level characteriza-tion methods are presented using the collected data of our large-scale honeypot.
Introduction
With the uprising of networks and the exponential number of connected computers, the risk of cyber attacks have dramatically grown in the last few years. It may end with a totally insecure world wide web network. In addition, anti-viruses and firewalls become almost useless as new viruses, malwares and attacks are counted by dozens every day. Naturally, security administrators have deployed new sensors and services to monitor cyber attacks, block them and understand them. But, with the growing size of networks, the data returned by those monitoring and security systems have increased from human readable information to very large databases where millions of alarms
and events about the network and computer are stored. Moreover, as data are coming from hetero-geneous sources, alarms related to the same cyber attack are not semantically linked. It is thus very difficult to understand and learn the global steps of attacks when they occur.
Computer science security researchers and companies now face a new security challenge. They have to study and analyze motives and habits of attackers and cyber criminals in order to be able to set up a global protection response. The collected knowledge about attackers can be ex-tracted by a manual forensic of a compromised host or on the contrary by using automatic methods to classify and analyze a large amount of attack events. That generic knowledge deals with multiple scientific locks, such as activities characterization, heterogeneous data mining (coming from het-erogeneous sensors), combining alerts, reports, and just system events, all that in very large scale database counting millions of rows per month per machines.
In the work presented in this chapter, we show how we deal with all these issues, starting from collected activities of attackers to general classification of activities and attacks. Actually, the activities of cyber attackers were captured using a high-interaction clustered honeypot that is connected on public IPs on Internet. These “fake hosts” allow the attackers to remotely connect to the computer and to obtain a remote shell that will let them perform any system command as a regular user would. In the following sections, we start with a rough analysis of raw data and incrementally reach a fine-grained characterization of attacks. To achieve such results, we manually analyzed the data, proposed algorithms and implemented procedures to automate the analysing and classification tasks of attacks data. The results allowed us to make a tentative of understanding and interpretation of what attackers do, know, get, and want to.
The first part of this chapter describes the different types of honeypots and the specificity of our honeypot. Then, the traces that are collected during the attacks permits to operate a first manual forensic analysis. This analysis gives a first characterization of the attacker’s goals and behavior. Nevertheless, the analysis is extremely hard to achieve and the second part of this chapter shows how automatic tools can give a better understanding of the attacker’s profiles. This part proposes a modelling of the collected attack events and describe methods to correlate these events in order to extract valuable information.
Part I
Manual analysis of rough collected data
To understand the goals of cyber criminals, researchers and security teams use compromised hosts that have been penetrated by attackers. This forensic analysis might give information about the attackers, the way they entered the host and what they did during the time of compromising. Nev-ertheless, the quantity of information is low, as the host has to be reinstalled to guarantee that it is returned in a safe state. An attacker cannot come back on this host and the way he entered the host have been secured. Honeypots are “fake hosts” that solve this problem: their goal is to welcome attackers and to let them perform their illegal activities in order to monitor them. Thus, a large amount of information can be collected as multiple attackers can be monitored at the same time.
When a honeypot has been deployed during several months, the hosts have to be exploited to extract information about the attackers, if this information is still present. The challenge is to collect the maximum amount of information and to be able to conclude about what happened. The easiest
way to proceed is to manually analyze all the data of the hosts: the malware brought by attackers, the shell commands they executed and their effect on the host. On large scale honeypots, this work is hard to achieve because each attacker will behave differently for each attack. Moreover, we may miss some attacks that an expert will not be able to see.
The first part of this chapter shows this manual forensic process on an honeypot of four hosts that have run during two years. We present the first conclusion of the manual analysis of malwares and shell commands. Then, the second part will present advanced methods based on operating system events that will confirm and precise the results obtained in the first part of the chapter.
Honeypots
High and low interaction honeypots
Two types of honeypots are distinguished in the literature. The low level honeypots emulate a limited part of the services, mainly the network protocols. They allow to compute statistical results and to model the attack activities (Kaaniche, Deswarte, Alata, Dacier, & Nicomette, 2006). On the other hand, the high-interaction honeypots deploy real operating systems that allow to capture more complete information. Virtualization solutions (Alata, Nicomette, Kaâniche, Dacier, & Herrb, 2006) allow to deploy several “real” operating systems on the same physical host but the attacker can detect that the operating system is executed in a virtual environment.
Honeypots are connected to the Internet on public IP addresses. Low-interaction honeypots just capture the incoming traffic and emulate responses sent to the attacker (Kaaniche et al., 2006; Leita et al., 2008) whereas high-interaction honeypots send the traffic to the real services, if they exist. The major issue with IP addresses is their disponibility. With the saturation of IPv4 ranges of addresses, only large companies or institutions can deploy large scale honeypots like hundreds of honeypots hidden in thousands of real hosts. Strong efforts are made to deploy distributed honey-pots based on honeyd (Provos, 2004) or agents redirecting attacks to a central honeypot (Antonatos, Anagnostakis, & Markatos, 2007). Moreover, it could be dangerous to maintain numerous honey-pots in a network with normal running hosts. In (Anagnostakis et al., 2005), the authors propose to detect in real time suspicious traffic and to reroute this traffic to a shadow honeypot which helps to maintain a good level of security for the real production hosts.
Hence an attacker has been captured into a high-interaction honeypot, the next challenge is to keep him into the honeypot and to collect information about him. First, the honeypot should behave as a real production host as attackers can use advanced technics to determine if the host is a honeypot (Holz & Raynal, 2005; Innes & Valli, 2005). An operating system that runs into a virtualization solution is not considered anymore as an honeypot, as virtualization is now largely used for running multiple servers on one host. Moreover, if the attackers suspects that he have been captured by an honeypot he can use some tools (Krawetz, 2004) that helps him to test the host. Then, he can launch attacks against the honeypot like flooding him with false information.
Honeypot architecture
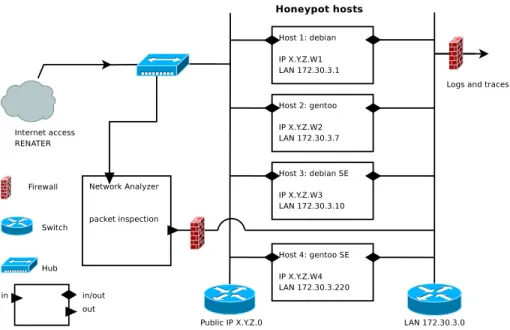
The proposed honeypot architecture have been precisely described in (Briffaut, Lalande, & Toinard, 2009). It proposes a high interaction honeypot where each “fake host” is installed on a physical machine. The global architecture is presented in figure 1. Four hosts are represented on the figure to show that several Linux distributions are deployed. The distribution marked by “SE” refers to SELinux mandatory access control mechanism which provides a high security level as discussed
inn (Briffaut et al., 2009). Each host is connected to internet using one public IP. No firewall is deployed to protect these hosts from the attackers and only a hub replicates the packets that are received to send a copy of these packets to another host that will perform off-line analysis. This architecture enables the attackers to:
• directly send packets to any port of one single host • communicate to any available service of one host
• potentially exploit any known vulnerabilities on these services
Moreover, a modified version of SSHserver allows randomly the attackers to remotely con-nect to these hosts (Briffaut et al., 2009). The attackers obtain a shell account with a home-directory on the host they try to connect to. For example on the debian host, an attacker that tries to con-nect with user oracle with password oracle will have a probability of 0.01 to be authorized to login the system. If he succeeds, a home-directory /home/oracle will be created on-the-fly giving him a prompt shell. Listing 1 shows the beginning of the shell session of zena that tries four classical commands on the debian honeypot.
zena@debian: w
17:26:01 up 104 days, 4:30, 2 users , l o a d average: 0.29, 0.39, 0.31
USER TTY FROM LOGIN@ IDLE JCPU PCPU WHAT
zena p t s /0 X.X.X.X 14:58 0.00s 4.65s 0.11s sshd: zena [p r i v ] zena@debian: ps aux ... zena@debian: cd /dev/shm zena@debian: ls -a t o t a l 0 drwxrwxrwt 2 r o o t r o o t 40 mai 4 17:46 . drwxr -xr -x 14 r o o t r o o t 4,0K mai 27 11:15 ..
Listing 1 Session of zena
These sessions are recorded using a large panel of tools: network sensors are monitoring the network activities; system tools are controlling the system calls (that can be allowed or refused); a session replayer (RPLD) records all the commands and their output. All the collected data are stored
outside the local network for further analysis.
The main characteristics of our architecture is that this honeypot is very difficult to break. It means that the attackers cannot break the system exploiting known vulnerabilities because the Linux hosts are protected by a Mandatory Access Control mechanism called SELinux (Briffaut et al., 2009) and an Intrusion Detection System called PIGA (Blanc, Briffaut, Lalande, & Toinard, 2006) that guarantees high level security properties. These tools make possible to welcome attackers and to protect the operating system from corruption. The hosts do not need frequent re-installation and have collected data during two years.
Rough analysis of collected data
Collected data
The collected data by the different sensors permit to compute statistical results about the attackers. Basically, these collected data are:
Figure 1. High interaction honeypots architecture
Session type Number
empty history 7
no history 1627
history >= 3 lines 173 history < 3 lines 49
Total 1849
Table 1: Sessions details for each ssh-client
• The home-directory of the attacker
• The .bash_history file containing all the entered command, if the file still exists • The created or downloaded files of the attackers, if they still exist
• The rpld sessions i.e. all the entered commands and their result on the standard output • The system calls generated by all activities
• The network packet signature of all incoming connections Overview of shell activities
The first basic analysis that has been done is the analysis of the .bash_history files that contain the none deleted shell activities of attackers. The Table 1 shows that a large part of the sessions do not contain the .bash_history file. The main reason is that attackers useSSH
scan robots that try to connect randomly to any public IP address using login/password dictionaries. When the scan robot obtains a shell account, it logs the success in a file for later use by the attacker. If the attacker does not come back later, the obtained session is never used and does not produce any history file. The second reason is that advanced attackers delete the history file before leaving
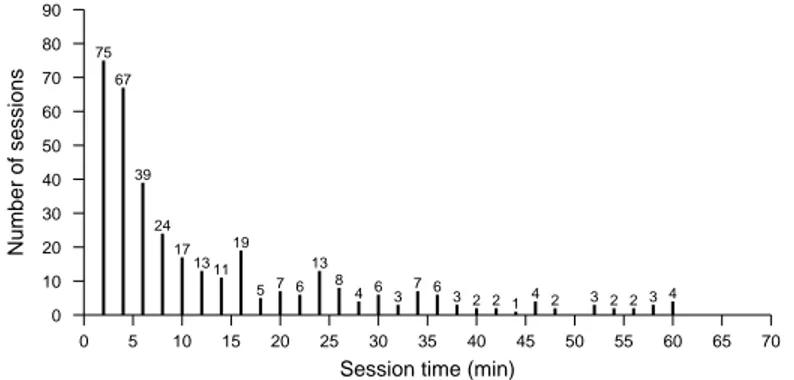
Session time (min) 0 5 10 15 20 25 30 35 40 45 50 55 60 65 70 Number of sessions 0 10 20 30 40 50 60 70 80 90 75 67 39 24 17 13 11 19 5 7 6 13 8 4 6 3 7 63 2 2 1 4 2 3 2 2 3 4
Figure 2. Number of sessions by session time
Number of shell commands
0 5 10 15 20 25 30 35 40 45 50 55 60 65 70 75 80 85 90 95 100105110115120 Number of sessions 0 10 20 30 40 50 60 70 13 43 55 40 25 18 15 6 2 4 4 1 3 5 5 2 3 1 1
Figure 3. Number of sessions by session size
the session. The discussion about this advanced attackers will take place later in this chapter. Using rpld records, Figure 2 shows the number of sessions by duration time. The graph omits empty sessions. The figure shows that one cannot distinguish automatic sessions (scripts launched by the attacker that have a short time execution, less than one minute) from human sessions. The number of sessions is decreasing in 1
x with time with the leaving of attackers. The Figure 3 shows
that most of the sessions have around 15 commands. Short sessions and sessions with more than 40 commands are rare.
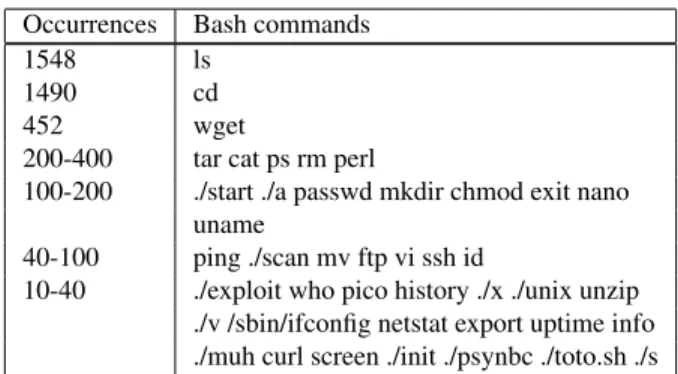
The Table 2 shows statistical results about the most frequent entered shell commands. Clas-sical shell commands like ls or cd appear frequently. Then, the wget command indicates that attackers are downloading malwares in their session, that will be analyzed later. Other classical shell commands indicates that files are manipulated: tar, cat, mkdir, mv, nano. It corresponds to a manipulation of the downloaded malware. Moreover, some others indicate that the attacker inspects the host: ps, cat, id, uname. Finally, malwares with classical names are executed:
Occurrences Bash commands
1548 ls
1490 cd
452 wget
200-400 tar cat ps rm perl
100-200 ./start ./a passwd mkdir chmod exit nano uname
40-100 ping ./scan mv ftp vi ssh id
10-40 ./exploit who pico history ./x ./unix unzip ./v /sbin/ifconfig netstat export uptime info ./muh curl screen ./init ./psynbc ./toto.sh ./s
Table 2: Mostly executed commands
Extension in .bash_history on the disk re-downloading ok no possible re-downloading
.jpg 23 5 2 16 .tar.gz 79 26 12 41 .tgz 127 60 16 51 .tar 28 17 3 8 .zip 19 7 6 6 Total 276 115 39 122
Table 3: Types of malwares used by attackers
Downloaded malwares
The Table 3 focuses on the analysis of the downloaded malwares. We filtered in the
.bash_history files the wget commands in order to see the type of downloaded files. We
compared the number of logged downloaded files with the real files on the disk and, if not present, we tried to re-download the malwares. Only a small number of malwares have been re-downloaded which shows that the used URLs were temporarily active.
In Table 4, we checked if the announced extension was corresponding to a real file, i.e. if a .jpg was really a Jpeg file. Not surprisingly, Jpeg files are mainly gzip files and some tar and tgz files are binaries. Even half part of the txt files are archives, binaries of programs. The different extensions cited in Table 4 shows that the attackers try to obfuscate the malware using classical extensions for images or text. Nevertheless, most of attackers do not try to hide themselves and just download archives (tar.gz, zip) containing binaries of malwares.
Ext Total Good Bad .gz bin tar empty pl C/C++ others
tar.gz 38 31 7 0 0 2 2 0 0 3 tgz 76 61 15 0 5 0 0 0 0 10 jpg 7 0 7 6 0 0 0 0 0 1 tar 21 5 16 10 6 0 0 0 0 0 txt 121 68 53 0 8 0 8 13 14 10 Total 263 165 98 16 19 2 10 13 14 24
Malwares Malwares Decompressed Re-downloaded
occurrences occurrences Malwares from Total Type of malwares Malwares that
in /home in /tmp archives (tgz,. . . ) were missing
704 23 3435 4162 ELF 32-bit LSB executable 150
406 1 881 1288 ASCII C program text 68
197 0 366 563 Shell script 37
260 0 389 649 Object file 61
22 0 290 312 Libraries 16
22 3 366 391 ASCII Perl program text 10
41 0 177 218 ASCII Pascal program text 43
52 0 208 260 C++ program text 14
97 3 266 366 Empty file 15
10 0 23 259 Makefile 6
8273 27 8838 17138 ASCII text 895
13 1 245 47 HTML document text 47
1 0 1 2 ISO 9660 CD-ROM filesystem 0
75 22 0 94 tar.gz,tgz 0
6 1 0 7 zip 0
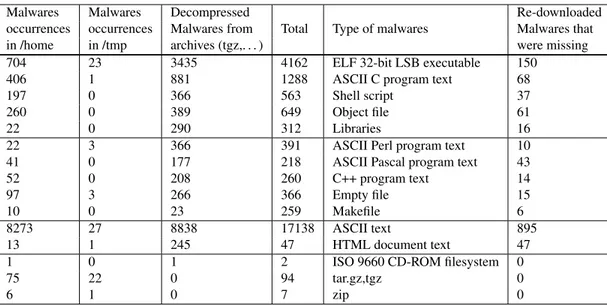
Table 5: Main types of malwares
The malware files are analyzed in Table 5. The classification is done with the files directly found in home directories but also with the files found in the decompressed archives of Table 3. A large number of binaries are found, which confirms that attackers download malwares in order to execute them. Some malwares are using scripts that launch commands or binaries. Some other files that are not executable are found, mainly text files that are configuration or documentation files provided with the malwares. The missing files that appears in .bash_history files have been re-downloaded with the URLs provided after wget commands. The distribution of files is comparable: we found a lot of binaries, some source codes and a large amount of text files.
Geographic study
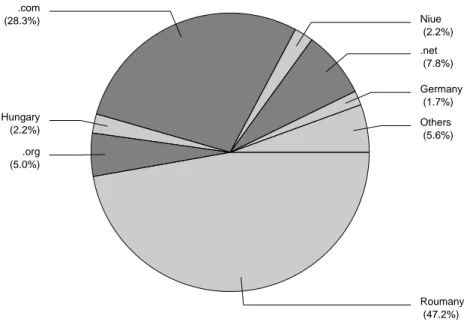
The study of .bash_history files gives information about the possible countries involved in the attack or that provide servers to store malwares. The Figure 4 shows the repartition of URLs that are involved in a wget command. We only used the domain names and dropped the IP ad-dresses Europeans (they will be analyzed later in this chapter). Domains like .com, .org, .net hide the origin of the attacks. It could be also international web hosting services. Other countries are mainly east-European websites where web hosting providers are probably tolerant with their users.
Moreover, the attackers used 27 direct domains (i.e. www.domain.com) and 106 sub-domains (i.e. subdomain.domain.com). The sub-domains are classically created by web hosting providers for their clients. Domains are less frequent because the attackers must own the domain name and are easily identifiable with the whois databases. This is also observable using TTL requests (Time-To-Live) against the DNS services. TTL requests sends back the amount of time that a domain stays associated to an IP address. The Table 6 shows that 67 domains are probably dynamic sub-domains that can change frequently of IP address with a TTL less than 10000 seconds. 32 domains have high TTL and 34 have TTL that cannot permit to decide.
Roumany (47.2%) .org (5.0%) Hungary (2.2%) .com (28.3%) Niue (2.2%) .net (7.8%) Germany (1.7%) Others (5.6%)
Figure 4. Malwares download countries
TTL value category occurrences
< 10000 Surely sub-domains 67
10000 < x < 99999 Undecidable 34
> 100000 Surely domains 32
Table 6: Classification of domains by TTL
Activities of cyber attackers
This section gives a basic characterization of the attacker activities using the analysis of the entered shell commands and investigating the malwares that are dropped into the home-directories. The first that can be observed is when the attacker drops malwares files or not in its home-directory. If no malware is found, the session could be an inspection session that means that the attacker tries to observe the host he entered to decide what to do next. It is not so hard to see that the attacker inspects the host but it is almost impossible to guess why the collected information is valuable for him. The inspection could be extended to the network which means that the attackers tries to guess the topology of the network and to discover new hosts to attack.
An other characterisation is easy to extract from the command line and malware analysis: we succeed to discover the setup of a botnet. A botnet is a distributed install of IRC bots on compro-mised hosts that allows the IRC channel owner to remotely control a pool of host (McCarty, 2003). It is mainly used to launch a denial of service against a target service of an host like an Apache web server.
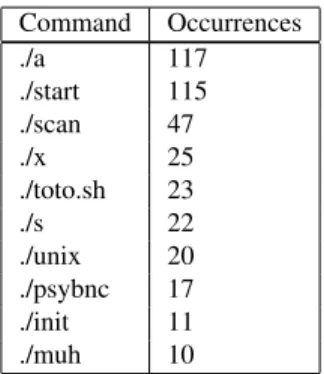
Command Occurrences ./a 117 ./start 115 ./scan 47 ./x 25 ./toto.sh 23 ./s 22 ./unix 20 ./psybnc 17 ./init 11 ./muh 10
Table 7: Most launched malwares
Shell command analysis
The Table 7 shows the most frequent commands launched by attackers. This table aggregates the name of commands. There is no guaranty about the fact that an attacker launching ./a is executing the same binary than another attacker executing ./a. The similarities between malwares cannot be analyzed at this level of forensic: this is one of the reasons that motivates to correlate more information at the level of the operating systems to extract more relevant information, which is done in the next part of this chapter. Nevertheless, we observe that the attackers try to hide their activities using neutral binary names (./a, ./x, ./s) but also that some of them directly indicates that they launchedSSHscan (./scan) or IRC bots (./psybnc, ./muh) (McCarty, 2003).
A first classification of attacker activities have been realized with a simple algorithm that filters the used commands of the .bash_history files. This algorithm uses these simple rules:
• If we find wget, tar and ./ in the same file and in the good order, we will consider that it is a malware session.
• If we find at least two of the three commands cpuinfo, ps aux and who, it will be considered as an inspection session.
• If we find one of the commands bot, eggdrop, bouncer, or psybnc, the session is considered as an IRC bot session.
• If some network commands like ping, netcat, telnet or ssh are launched on local IP addresses, the session is considered as a local network inspection session.
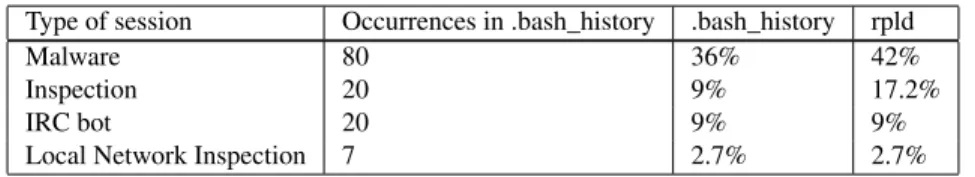
The Table 8 gives the number of classified sessions and their ratio using the
.bash_historyfile or the rpld logs. The inspection sessions are less detected in the bash history
(9%) but appears for about 17% in rpld. This difference suggests that the attackers that inspects our hosts are more humans than automatic scripts and that they clean the environment before leaving the session, deleting the .bash_history. For malwares and IRC bots this difference is not ob-served. The last group in this classification is the local network inspection which is rare and difficult to detect.
Two case studies
Finally, we selected the two most frequent scripts used by attackers. We never encountered two times the same script but we manually found a lot of variation of the same script. The first one corresponds to scans andSSHbruteforce attacks. The pscan2 malware tries to discover IPs
Type of session Occurrences in .bash_history .bash_history rpld
Malware 80 36% 42%
Inspection 20 9% 17.2%
IRC bot 20 9% 9%
Local Network Inspection 7 2.7% 2.7%
Table 8: Basic classification
that answers on port 22 in order to discover theSSHservice. Then, the collected IPs are used by a
bruteforce malware that tries to enter these hosts. At the end, the generated files of the first phase of the attack are deleted from the disk, which makes impossible for a forensic analysis to know what IPs have been attacked.
echo " ∗∗∗∗∗∗∗∗∗∗∗∗∗∗∗∗ PRIVATE SCANNER ! ∗∗∗∗∗∗∗∗∗∗∗∗∗∗∗∗∗ " echo " ∗∗∗ HACK ATTACKS, ILLEGAL ACTIVITY , SCANS, SPAM. ∗∗∗ " echo " ∗∗∗∗∗∗∗∗∗∗∗∗ S p e c i a l p t . Hunter & FLO ∗∗∗∗∗∗∗∗∗∗∗∗∗∗ " echo "−−−−−−−−−−−−−−−−−−−−−−−−−−−−−−−−−−−−−−−−−−−−−−−−−−−−" echo " # i n c e p scanarea f r a t e . . "
./pscan2 $1 22 s l e e p 10
cat $1.pscan.22 | s o r t | u n i q > mfu. t x t oopsnr2=‘grep -c . mfu. t x t ‘ echo " # Am g a s i t $oopsnr2 de s e r v e r e " echo "−−−−−−−−−−−−−−−−−−−−−−−−−−−−−−−−−−−−−−−−" echo " # Succes f r a t e ! " ./ssh-scan 100 rm - r f $1.pscan.22 mfu. t x t echo " Asta a f o s t t o t : ) "
The second script, encountered multiple times, tries to install an IRC bot on the system and to add it to the rc.d scripts to execute automatically at boot time. Nevertheless, even logged as root, our honeypot will disallow the copy of files in the system directories such as /usr/sbin. Moreover, the rc.sysinit file is protected in order to guarantee its integrity: the attacker will not be able to add lines at the end of this script that tries to hide the IRC bot as the kswapd service of the kernel. This type of IRC bots tries to join a botnet session in order to launch denial of service attacks. Even if the attacker could have succeed to install the bot, the limitation of the outside bandwidth of our honeypot prevents from any denial of service launched from our host.
#!/bin/sh
c l = " " cyn= " " wht= " " hcyn= " "
echo " $ { c l } $ { cyn } | $ { c l } $ { hcyn}−− $ { c l } $ { hwht } I n s t a l l i n g mech . . . $ { c l } $ { wht } " ./e n t i t y -gen >>../ i n s t a l l . l o g cp - f mech.set / u s r / s b i n cp - f mech / u s r / s b i n /mech cp - f mech. h e l p / u s r / s b i n cp - f h o s t / e t c cp - f kswapd / u s r / s b i n
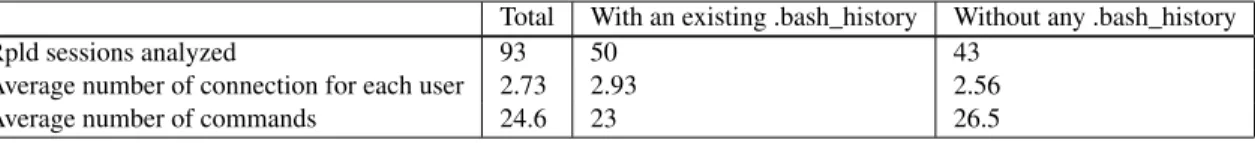
Total With an existing .bash_history Without any .bash_history
Rpld sessions analyzed 93 50 43
Average number of connection for each user 2.73 2.93 2.56
Average number of commands 24.6 23 26.5
Table 9: Rpld Statistics echo >>/e t c / r c .d/ r c . s y s i n i t echo " S t a r t i n g kswapd . . " >>/ e t c / r c .d/ r c . s y s i n i t echo " / u s r / s b i n / kswapd " >>/ e t c / r c .d/ r c . s y s i n i t echo >>/e t c / r c .d/ r c . s y s i n i t /u s r / s b i n /kswapd
echo " $ { c l } $ { cyn } | $ { c l } $ { hcyn}−− $ { c l } $ { hwht } Done . $ { c l } $ { wht } "
Hidden activities
As already described, some attackers are hiding their activities by deleting their
.bash_history file. We analyzed 93 users logged by rpld. The Table 9 shows that 43
ses-sions have no .bash_history file. On these sesses-sions we computed how many times the attacker uses the session (eachSSHconnection creates a rpld log). The first connection is obtained when the
SSHbruteforce succeeds. Then the attackers connects to our honeypot again to execute malwares. If some results are generated by the executed malware, the attacker will probably come back for the third time to get them. For example if the malware is an IRC bot, controlled on an IRC chan-nel, the attacker will just need two connections to setup the bot. It explains the average number of connections of 2.73 on our honeypot. Finally, the attackers that hide their session by deleting their
.bash_historyfiles are entering more shell commands than the others.
We also observe that attackers use special folders to deploy their malwares: the attackers used 19 times the /dev/shm folder, 74 times the /var/tmp folder, 64 times the /tmp. The
/dev/shmfolder is a special folder created in memory consequently not persistent if the computer
is halted.
This is not only the only way for attackers to hide their malwares. Some of them tries to create in their homedirectory special non visible folders difficult to detect when inspecting the host. We give an example on one of our session with the file jet.tgz have been downloaded in a special sub-folder of /var/tmp:
[xxx@localhost malware]$ f i n d / | grep j e t . t g z /v a r /tmp/.. ../j e t . t g z
[xxx@localhost malware]$
Using the folder “.. ..” hides it and its content, because folders beginning by a dot are hidden for the ls command:
[xxx@localhost malware]$ l s / v a r /tmp/ [xxx@localhost malware]$ [xxx@localhost malware]$ l s -a / v a r /tmp/ . .. .. ..
Moreover, it is more difficult for a non specialist to enter the folder because the following command enters the wrong folder (/var/tmp):
[xxx@localhost malware]$ cd / v a r /tmp/.. ../
[xxx@localhost tmp]$ pwd
/v a r /tmp
In the last listing, the second part of “.. ..” is not understood by the Shell because of the extra spaces. Finally, the right command is the following:
[xxx@localhost malware]$ cd " / v a r / tmp / . . . . / "
[xxx@localhost .. ..]$ l s
j e t . t g z
Some variants of this kind of directory have been tried by attackers: “.../”, “.,.”, “. /”, “.,”. This part of the chapter presented the manual analysis of the data collected from the homedi-rectories attackers, the .bash_history files, and the rpld traces. We obtained a first evaluation of the activities of cyber attackers, geographical information about them and analyzed some scripts they use frequently. This is a mandatory process of our work in order to be able to setup more sophisticated and automatized methods. Manual forensic cannot work on large scale computers or distributed honeypot because of a too large amount of data. But these first conclusion helped us to build a methodology based on operating system events that will precise the results and improve their interpretation in the next part of this chapter.
Part II
Modeling and Classification of attacks
As previously said, understanding what attackers do was an objective that we partially faced in the previous part. But it is also a mean to understand what they want to do in fine. Moreover, manually analyse the data as we made in the previous sections is very interesting in the way that it allows to make a first draw of things. But when one deal with many machines encountering large numbers of attacks, the manual forensic quickly becomes difficult to apply. That is why automated methods are needed. Such methods can replay the same algorithms as the ones manually made but also go a step further using some kinds of clustering or text/data mining algorithms, showing things that was not visible for the human, or not statistically relevant with the small sample of attack data used during the manual analysis. In addition, correlation of multiple sources remain almost impossible to be done manually by human.
In the following sections, we will present how, with self proposed methods or existing tools, we are able to highlight phenomena that were previously not visible, or statistically confirm or infirm tendencies we though to be results of the manual analysis.
Introduction
Everyday, the cyber attacks show a growing complexity to evade the security and monitoring systems. With this complexity, it has become very expensive for a human to understand the raw data related to those attacks. The raw data are very large, complex and hard to read. Those problems have been overwhelmed by developing automatic systems that help to understand those attacks and
simplify them to be usable for human. Then humans can take the right decision corresponding with the evaluation of the global impact of each cyber attacks.
Nevertheless, the number of security and monitoring systems have grown with the size of networks producing a large amount of heterogeneous data. In consequence, the more data that can be collected from an attack, the more the knowledge that can be extracted about it: the decisions are suitable, if the right tool is used, to correlate/aggregate/analyse these data. For example, looking the attacks against one computer of the network in order to take actions during a distributed attack on thousands of computers does not allow to understand what is happenning. It results with partial reports that bring only partial or incorrect responses.
The complexity of cyber attacks has increased and the sets of scenarios used during them have grow. It is critical to protect an information system and to have frameworks to classify and cluster the attacks to process them based on the evaluation of their security risks for the information systems. By being able to generate accurate reports on cyber attacks, security administrators are able to take better responses and communicate with the whole enterprise about security concerns and risks in their environment.
Definitions
In this section, we define terms that we use in the following to describe attacks and correlation processes.
• event : an event represents an action on the information system. The action can be on a network or a system. An action that fits a pattern of detection creates an event. For example, each time a system call related to a write operation on a certain computer is done, it generates an event.
• session : a session contains all the actions of a user on the information system from his entry to its disconnection. For example, a session can be all theHTTPrequests and responses done
by one user to communicate with one server during a short period of time. In terms of correlation, a session can be defined as all the events and alarms linked to a single user or attack.
• local (scope) : when talking about local sessions, events or attacks, only one computer or network is considered. For example, a system session begins with the connection on a computer through an entry point likeSSHand ends with a logout of the user.
• global (scope) : contrary to the local scope, a global scope means that it contains infor-mation coming from the whole inforinfor-mation system and takes into account multiple computers and passing through several networks. For example, a global session can contain multiple local system sessions and all the network sessions linked with the system’s ones.
• correlation : a correlation process is the act of grouping some events together to extract knowledge allowing a better understanding of a session and the related actions i.e. attacks.
• characterization : a part of the correlation process. It permits to extract a pattern from multiple instances of the same attack or multiple similar attacks. The similarity is a criteria difficult to establish, depending on what you want to show and the data you have.
• classification : a part of the correlation. It allows to use the pattern generated by the characterization process to label each attack with the fitted pattern(s).
In the next sections, we present our approach that starts with the characterization of low level events happening during system sessions to the high level classification of system sessions. It is an incremental approach as each step depends on the previous one.
Characterization of events
Before explaining the process of characterizing events, it is important to understand what kind of events and alarms are generated by security and monitoring sensors and their differences and interests in the classification of cyber attacks. First, those events are divided into two main categories: network and system. They can be also divided in sub categories from low level events to high level events. For example, system calls are low level system events that describe a small action on an operating system like a read operation. Syslog events sends high level events like the connection of a user on a computer. The high level events are generally composed of numerous low level events of possibly different nature (for example system events and network events). For the network, we can have low level events for a single network packet and high level events describing aSSHnetwork session.
It is important to keep all those events with several of them describing the same action on the information system because it helps to have a multiple and more accurate point of view of the same operation and helps the better understanding of it. It helps to take better responses and reduce the risk of missing some attacks. For example, if we cannot link a system call reading a sensitive data (e.g. /etc/shadow) with the user that did it (using the syslog event), we will loose a very important information about the attack: the identification of the attacker on the information system. In consequence, all those heterogeneous events are more interesting if combined together.
Formatting events
All those events come from heterogeneous sensors are not structured in the same way. For example, a system event, in most of the cases, does not contain network information like an IP
address. They can also use different representations for the same information. For example, some sensors encode IP address as a string whereas other are integer. To be able to use all those events
together, it is critical to structure them with the same format. For this purpose, several frameworks have been developed and provides interfaces to do a set of preprocessing tasks on each event to fit them to a common format (Ning, Reeves, & Cui, 2001; Kruegel, Valeur, & Vigna, 2005; Valeur, Vigna, Kruegel, & Kemmerer, 2004). For example, IDMEF is a RFC proposal that introduces a common structure to format and store each event (Curry & Debar, 2003). It is used by some well known sensors (e.g. Snort (Nayyar & Ghorbani, 2006)) and frameworks (e.g. Prelude). The choice of a common format for each event is a task that needs to be done before any correlation process, keeping in mind that what is to detect and characterize.
Losing information can lead to miss an attack, but too many information bring the need of expensive computing resources to be able to analyze them. The preprocessing task is important to optimize the process of events correlation because some minor changes in the structure of events can greatly improve the performances. For example, changing every IP address from string to integer reduces the performance of the correlation process because it is more efficient to compare integers than strings.
Validating events
After, formatting each event the same way, the next step is to validate each event. This validation process is looking if every field of an event contains all the required information. For example, it checks if anIPaddress can be real or not i.e. if it is in the range 0.0.0.0-255.255.255.255.
address is missing, it may be possible to recover it from other events on the same network session. It can also be used to add information on an event. A geographical location can be added based on
IPaddresses, or a priority based on the sensor that generated the event.
It is also always better to delete an event that contains a missing data or an incorrect data that keeping it because it may lead to false detection and classification that could be used to take inaccurate (and maybe harmful) responses (cf. next subsection).
Finally, our process allows to modify the priority of each event based on regular expression. For example, all the events that are coming from 172.30.3.1 have their priority multiplied by 10 (or set to 10 if their previous priority was 0).
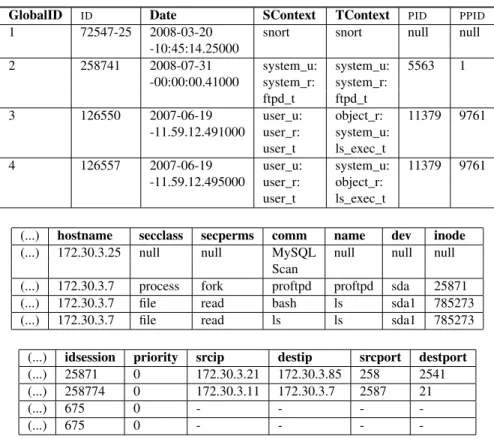
Formatting and validating examples
To conclude this section, we come back on our experimental data and apply the approaches we explained on it. Applied to our experimental data, we take two different types of log traces (cf. Table 10): one log from Snort, three other logs from SELinux. Both sensors logs are formatted to fit the same structure: a Global ID in our database, a unique event (syscall) ID, the date, the source and target SELinux contexts, the PID and PPID of the event, the hostname on which it occurred, security perms and class of the event, the command (comm) and its attributes (name), the device (dev), the inode, the session id (idsession), the source and destination IP and ports.
As an example of malformed logs, we can consider syslog (i.e. the system logs reporter) un-der SELinux that often generates malformed or truncated events. For example, the comm attribute of the 4th event (GlobalID = 4) can be lost. In that case, one cannot know if the command was bashwith ls as the name (i.e. the launching of ls) or if it was ls itself or if it was the f ind com-mand with ls as argument, or any else comcom-mand that could have ’ls’ as its argument (which ls, ./malware ls, etc.).
Following local attackers activities: building local sessions
One of the main goal of establishing attacks’ scenario and reconstructing cyber attacks is to be able to have a complete view of an attack and not be limited to a single event that describes only a part of it. This is why it is important to have an effective way to reconstruct sessions. In this section, we present local sessions i.e. sessions seen from a single point of view like an operating system and not a multiple point of view like a multi-sensors approach.
Network and system session identification
We divided the local sessions in two main groups: network and system sessions.
• The network sessions are all the events linked to a single session as defined in network communication i.e. all the events linked to a connection on a service from the starting packet (SYN/ACK TCP) to the ending oneFIN TCP.
• The system sessions contain all the events linked to a single session as defined previously i.e. all the events linked to a connection to a system from the entry point (in many case, the login process like inSSHsessions) to the disconnection of the user of the system (in many case, the logout
process like inSSHsessions).
They both have their drawbacks and advantages:
• the network sessions are easier to harvest and reconstruct because a single sensor can do the job for thousands of computers. But in the case of encrypted packets (e.g. SSHsessions),
GlobalID ID Date SContext TContext PID PPID
1 72547-25 2008-03-20 snort snort null null
-10:45:14.25000 2 258741 2008-07-31 system_u: system_u: 5563 1 -00:00:00.41000 system_r: system_r: ftpd_t ftpd_t 3 126550 2007-06-19 user_u: object_r: 11379 9761 -11.59.12.491000 user_r: system_u: user_t ls_exec_t 4 126557 2007-06-19 user_u: system_u: 11379 9761 -11.59.12.495000 user_r: object_r: user_t ls_exec_t
(...) hostname secclass secperms comm name dev inode
(...) 172.30.3.25 null null MySQL null null null
Scan
(...) 172.30.3.7 process fork proftpd proftpd sda 25871
(...) 172.30.3.7 file read bash ls sda1 785273
(...) 172.30.3.7 file read ls ls sda1 785273
(...) idsession priority srcip destip srcport destport
(...) 25871 0 172.30.3.21 172.30.3.85 258 2541
(...) 258774 0 172.30.3.11 172.30.3.7 2587 21
(...) 675 0 - - -
-(...) 675 0 - - -
-Table 10: Storage format (one table cut in three parts)
it is impossible to know what is inside the networks packets. Investigating network sessions thus provides very poor information and not critical ones like what the user do on the system, which commands he entered, etc. Thus, it is difficult to detect a large range of attacks really harmful for the targeted operating system.
• The system sessions are harder to harvest because it requires a sensor on each computer (i.e. operating system) and unlike network sessions, system events do not include a unique number common to all events in a single session. You need to find a way to cluster all the events related to a single session without common data to all of them. But, the data gathered from system sessions gives more precise and relevant information. It is not masked by encryption and describes at a fine grained level the user activity e.g. each commands he types in. Moreover, it is almost impossible to counterfeit system sessions but easy to do it for network sessions (e.g. forging fake networks packets). In consequence, system sessions have a higher level of integrity than network ones.
More precisely, different types of system events can be harvested:
• A system call (syscall) event: is the lower level of system event, it describes a single elementary operation on a system like reading an integer from a file or opening a file.
• A syslog trace: is a higher level event that describes an activity on the system that is typically linked to many syscalls e.g. a connection throughSSHor the death of a process.
• A command is an event that describes an activity but this one is produced directly by a user typing a command in a shell interface (e.g. entering the ls command on aSSHconnection).
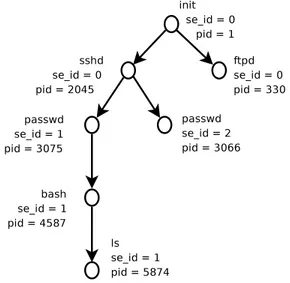
Figure 5. Processus tree
Each of those events contain different structures but they have all in common a list of fields. All the system events can be related to a process with a unique identification number: the system process ID (i.e. thePID). But, that is not enough to reconstruct a complete local session because it can contain multiple processes (i.e. multiplesPIDs). To link processes together, we need to
recon-struct the dependencies between them. It can be done by reconrecon-structing thePIDtree: each process has a uniquePIDon a system and each process are linked to a parent process that created it. From those operating system principle, it is possible to reconstruct a tree (Rouzaud-Cornabas, Clemente, Toinard, & Blanc, 2009) representing the link betweenPIDandPPIDfor every process. The Figure 5 shows a smallPIDtree where the operating system launched two daemons: sshd and ftpd. The initprocess is the father of these two processes. Then, each connection of users creates a branch containing thePASSWD process belowSSHD. Then a successfull authentication creates the bash process that will be the root of any entered command in the shell.
We proposed in (Rouzaud-Cornabas et al., 2009) a methodology to isolate system sessions in thePIDtree, where each new branch is the connection of a new user. For example, aSSHconnection is the beginning of a new branch that can be marked as a system session. Also, the fork (the duplication of a process) of the apache (HTTPserver) due to a new connection of a user on a web
site hosted on the system is the beginning of a new branch that can be marked as a system session. After having chosen which start of a new branch is a new session, it is easy to mark the whole related branch (and the related events) with a unique identification number. This is shown in Figure 5 with the parameter se_id that is set to zero for daemons but is automatically increased when the process
passwdis launched for the incoming attacker. Then, the created session id is maintained for all
the processes of the created branch.
Other methods of system sessions reconstruction can be applied based on higher level of information like syslog login and logout information or security labels of Mandatory Access Control (MAC), like the ones used by the SELinux MACmechanism. When using SELinux, each process
directory. Some transitions of a process from a label to another one can be seen as the creation of a new session. For example, when theSSHprocess go from sshd_t to user_t it represents the
connection of a new user. All the events that are linked to this transition and all the events generated after are marked with a new unique session number.
Applying this process to our experimental data, we are able to reconstruct system sessions based on PID trees or SELinux labeling. Our method creates a unique session ID for each new branch of the tree. For example, figure 5 shows the pid-ppid tree obtained from the filtered event of Table 11.
id scontext tcontext ppid pid host idsession · · ·
1 init ftpd 1 330 www 0 · · · 2 init sshd 1 2045 www 0 · · · 4 sshd passwd 2045 3066 www 1 · · · 6 sshd passwd 2045 3075 www 2 · · · 7 passwd bash 3075 4587 www 2 · · · 8 bash ls 4587 5874 www 2 · · ·
Table 11: SELinux events with idsession
Events and meta-events
The main issue when working with system sessions (and also network sessions) is their size and number. If they are too big and too numerous, it is difficult or impossible to group them and classify them in regards to some criteria. Our aim here is to produce some kinds of more or less small patterns that can describe a system activity, for example, the succession of the system calls generated by a single command. Nevertheless, when a denial of service (DoS) takes place because it generates thousands of events for a single cyber-attack and produces a large number of events and huge sessions or a very large number of small sessions. Those large set of data can lead to a denial of service or at least a decrease of the quality of the classification process.
To avoid those issues, meta-events have been introduced. Those ones group a number of events from two to thousands events into one meta-event that represents them. We divided those meta-events in two main categories that depends of the method that created them. The first one is based on similarity between events: for example, we group into one meta-event all the events related to the reading of a single file during a time frame. The second one is based on common activity: for example, we link all the events related to a bash command (like ls) into a meta-event.
Doing so, we are able to reduce the number of events and so the volume of data to pro-cess in the classification task. This propro-cess tackles the problem that an activity (i.e. the ex-ecution of a single process) can produce a very large number of system calls. Thus, we de-fine a meta-event as an event with an extra field containing the number of time the corre-sponding event appears. For example, the read of a file can generate thousands of events for a single activity. A meta-event will factorize all the read system calls of /etc/rc.conf during a given session 1142 on a given host. The collected information will be composed of the SELinux security context source (scontext = user_u:user_r:user_t) and tar-get (tcontext = system_u:object_r:etc_t), the hostname of the host (hostname =
Hostname # Events # Meta-Events 172.30.3.1 115,804,245 5,514,693
172.30.3.7 74,249,000 4,124,183
172.30.3.10 30,068,871 1,253,769 172.30.3.220 86,423,226 7,201,858
Table 12: Number of events and meta-events of our honeypot
selinux_computer), the created id of the session (idession = 1142), the SELinux class of the system object (secclass = file), the used operation permission (secperms = read), the name of the system object (name = rc.conf), and finally the number of events related to this meta-event (nbevents = 257). The table 12 shows the reduction of the number of events into meta-events on our honeypot.
Session Activity and Session Classification
With those patterns (i.e. small pieces of activity), we can create combinations that represent part of sessions. Then, combining those part, we can represent sessions. With labelling the activities with some specific labels (see Table 13, e.g. file manipulation, file execution, file download, etc.), it is possible to link each session to one or more class (to classify each session). Thus, each session can be seen as a combination of high level activities. With this global classification, it may be possible to provide relevant interpretation of what attackers want. For example, a session having file download without execution of the file will be classified as a simple download event
Experimental session results
On the four main computer that have been monitored during 18 months, we have detected 71,012 sessions in 306,577,215 events. The average size (number of events) of a session is 1,980, the minimum size 1 and maximum size 4,398,034. The average size is more or less the size of a
SSHsession that just succeeds without any command entered by the user. It often happens because
of the number of attackers that tries to bruteforce ourSSHserver and succeed. The minimal size is an attacker that tried a password but failed to find the good one. Finally, the maximal size is reached with a session that launched aDOSattack from the honeypot that ran during two days.
As seen in the figures 6 and 7, most of the sessions have a size that ranges from 0 to 8000 events. Moreover, the sessions have a size smaller than 8,000 correspond to a password try. The session between 400 and 8,000 events are very small sessions that contain only few commands entries. The interesting attacks are contained in the larger sessions that have at least 8,000 events. They need further investigation to understand their content.
Building general characterization: learning and abstraction of activities
Reconstructing (local, distributed, network and/or system) sessions is only the first step. After it, we need to use the sessions to generate reports and decide the responses to take. In most of the cases, with all the data harvested by a large number of heterogeneous sensors and all the network and system events, the sessions are huge and complex. Human analysis is too much expensive for
Sessions
0−400 400−8000
Number of System Events
0 4000 8000 12000 16000 20000 24000 172.30.3.1 172.30.3.7 172.30.3.10 172.30.3.220
Figure 6. Size of sessions (big ones)
Sessions
8000−16000 16000−32000 32000+
Number of System Events
0 30 60 90
172.30.3.1 172.30.3.7 172.30.3.10 172.30.3.220
Figure 7. Size of sessions (small ones)
this task and justifies an automatic process that adds meta-information about the session to ease the decision. This automatic process is divided in two steps:
1. learning how to characterize the sessions in different categories ; 2. classifying the sessions based on the result of the first step.
In this section, we present the two major approaches that allow to characterize sessions and present the one we used to study sessions on our honeypot.
Static rules analysis
This method tries to classify sessions using rules or signatures to filter them. They describe critical data that needs to be contained by the session to be classified into this category. For ex-ample, if a session contains the command unicsd, it can be linked to aDOSattack because it is a well known denial of service tool. It is possible to learn those rules using clustering algorithm (unsupervised learning algorithm). But those rules are designed for a specially craft target and are easily evaded by advanced attackers. For example, just changing the command name of the exe-cuted binary allows to evade the detection ofDOStool. Static rules analysis is often used by network correlation system to detect special flags and data in network packets (e.g. Snort (Nayyar & Ghor-bani, 2006), netFlow (Sommer & Feldmann, 2002; Systems, n.d.)). Also, most common anti-virus, are based on this approach. The critical issue is the need of having a large set of signatures to detect attacks. It easily leads to false positives and false negatives and is not able to detect new attacks. It needs a learning step to classify each new attack. In addition, using unsupervised clustering al-gorithm to learn new signatures is not impossible but not optimal as it often needs the rewriting of ad-hoc algorithms.
Behavior analysis
The behavior analysis tries to describe a session using a specific high level language (Cup-pens & Miege, 2002; Eckmann, Vigna, & Kemmerer, 2002; Morin, Mé, Debar, & Ducassé, 2002) or a formal representation of the attack category using a graph or an automaton in most of the cases (Rouzaud-Cornabas et al., 2009). Those abstract descriptions are more generic and flexi-ble than signatures. They do not describe the precise content (i.e. each event) of the sessions but
which global activities the sessions contain and how they interact with each others. For example, a particularly complex session could be expressed as the following:
1. a user connects to theSSHserver ; 2. he downloads a file from the Internet ; 3. he executes it.
This description represents a generic behavior of a user connected bySSHthat downloads a
file and executes it. Contrary to static rules analysis, it is possible to make generic descriptions that fits multiple attacks’ methods into a single category and not be forced to learn and generate a rule for each new attack. The drawback of this solution is that it is never possible to use an unsupervised learning algorithm. In consequence, the learning phase is more complex and needs more human participation to be successful. Another problem is that the author never gave any real usage for the automation of classifying session. Each automaton described is manually built.
Our aim here is quite more ambitious: we want to automatically learn classification patterns and then automatically classify the sessions.
Discussion
The chosen method is dependant of the type of session the method analyzes: it is simpler to establish rules of network sessions than system’s ones because they used network protocol that clearly defined what is a session. In consequence, both learning approaches are more efficient with network sessions. Moreover, network session are simpler to describe using language and/or graph. System sessions are more complex, their running time are larger, and they are not constrained by protocols. The worst case is the distributed sessions that contain both network and system sessions. It is the type of session that is the hardest to compare.
Another fact that leverages the learning process for both approaches is the grain of details chosen to describe an attack and to generate its behavior or rule. Finer the grain is, the more accurate the process is able to detect specialized attacks (Rouzaud-Cornabas et al., 2009). Nevertheless, the set of rule/behavior becomes larger in order to describe more attacks. A program is not able to choose this level of details, it is up to the security administrator to fix it in order to generate reports with the good level of details he needs to take a decision.
Our approach
In the previous sections, we have exposed the difficulties of characterizing complex sessions. A solution is to only characterize local (system and network) sessions to avoid the issue. But, it looses precious information on the global attack scenario and in consequence can lead to bad responses. To solve the problem, we have proposed an incremental approach that ease the learning and classification process of large sets of data describing sessions. The solution we have designed and used on the honeypot is a framework that allows to build characterization of system activities made by attackers. Those activities are labelled regarding their effects on the system. Our method allows also to classify each session in terms of those activities. Finally, our method allows the characterization and the classification of distributed sessions (Rouzaud-Cornabas et al., 2009).
Analysis
To store the logs, and all meta-data for the honeypot, we setup a classic relationalIBM DB2
Canada (4.8%) Russian Federation (3.9%) Germany (3.1%) Spain (2.5%) Netherlands (3.4%) France (8.2%) United States (9.7%) Romania (3.4%) Hungary (1.8%) Australia (1.5%) Thailand (7.8%) Poland (7.7%) Switzerland (2.5%) Italy (4.1%) United Kingdom (24.3%) others (11.3%)
Figure 8. WGET events repartition by country
from the Business Intelligence (BI) algorithms it provides. But, with so large amounts of data, it is impossible to launch any BI algorithms. Indeed, when making rough multiple joins on all events (more than 300 millions here) theBIalgorithms can not provide any answer in human time. Thus,
we developed our own algorithms and implementations to compute the data. The classicalIBM BD2 database was used following three steps :
1. formatting, structuring and loading the data in the database ; 2. implement and supervise the characterization processes ; 3. implement and supervise the pattern recognition processes. Comparison to manual investigations
Before going any further into specific attacks analysis, this section presents the benefit of computing syslog-SELinux events rather than .bash_history or rpld logs.
First, using the real system events logged, it is almost impossible to miss things that happened on the honeypot. Let us consider the example of the (manual) geographic study presented in the first part of this chapter. Figure 4 presented countries from which malware are downloaded. With only the .bash_history files or rpld information, that was impossible to know if the quantity of data downloaded per country was proportional to the number of downloads per country. By automating a querying procedure looking in the database for events having ’wget’ as the command (comm) and unix_socket (system_:system_r:unix_socket_stream) as the tcontext and read as the security permission (secperm) we can get all IP present in the database and their number. By automating geolocalisation resolution, we can provide information about download countries that present a different vision of things. Indeed, the resulting data, showed in figure 8 show many countries that were not visible in figure 4 and different repartition. We see that the repartition is much more homogeneous with many countries. In particular, UK appeared very often. After comes US, France, Thailand and Poland. The ’others’ slice is quite big because of the big number of other countries, each having small percents.
France Germany Spain UnitedKingdom Portugal Italy Poland Netherlands Austria Hungary Czech_Republic Norway Greece
Romania Sweden Turkey
RussianFederation
Korea India China
Taiwan Uruguay Japan
UnitedStates
Canada Australia
Incoming attack repartition (%)
0 5 10 15 20 25 30 35 40 45
Our honeypot: incoming attacks
Solaris honeypot (McGrew, 2006) incoming attacks
Figure 9. Volume download comparison
By correlating system events and network analysis tools, we are able to answer the download volume question. Actually, multiplying the number of wget read syscalls by the size of pack-ets during each session, we can compare in figure 9 the download quantities with the results given in (McGrew & Vaughn, 2006). The main difference that we observed is a noticeable download volume from Eastern Europe where McGrew didn’t. On the other hand, McGrew noticed an im-portant activity from Asia, where we did not. Some other differences are mainly on Italy and USA. It is important to remark that except those differences, the main activities and download sources remain comparable: Europe, USA, Korea and Canada. The disappearance of some countries and the appearance of some other does not imply real changes. It can be the result of the location of our honeypot, in France, whereas McGrew was located in the USA. USA are traditionally a common target for Asian countries. And Eastern Europe is closer to France than the USA.
In addition, looking at the syscalls of binaries execution can help to ensure that applications launched are not corrupted. For example, in the previous example, the wget command may some-times have been a malware downloaded by an attacker. Comparing the syscall generated by the command to a generic signature of it may help decide if the application is corrupted or not. As explained later, getting such generic signatures is very difficult, especially for complex programs
Belgium France Denmark Germany Hungary Russian Federation Lithuania Poland Switzerland Egypt Austria Spain Sweden United Kingdom other
Figure 10. Distinct source IP per country
that may do many things. But most of the time, for simple linux commands, it may be possible. For example, in our logs, any wget execution that did not contained interaction with the target context unix_socket was considered as an execution of a malware.
The results of figures 10 and 11 show that the use of distinct IP per country was obviously not proportional to downloading activities per country. It shows that attacks coming from the biggest numbers of distinct IP were UK, Switzerland, Poland and France. On the other hand, the most targeted address class by the attackers activities were UK and Poland. In particular, in one session, a quite complete scan of all the addresses in UK was performed, generating millions of events, almost one per IP in UK.
The figures 12 and 13 show that most of the sessions are related to a very small number of IP. For example, in the figure 13 we can see that only 21 sessions were related to more than 10,000 IPs. The session mentioned above which scanned the UK’IPs was one of them.
Again, such investigation were not possible during the manual study phase. Characterization of system activities
Using the meta-event generated during the preprocessing phase, prior to the insertion of data into the database, we build a list of meta-events relevant to attackers activities. That list mainly includes the commands typed most often by attackers. To do this, we search the database for the mostly used commands. Below is a short list of such those commands :
p e r l ,ps,cp,bash,sshd,bzip2 ,sh, f i n d , t a r ,sed,cat ,rm,mv, l s ,wget, apt -get ,sendmail ,dd, v i ,awk,nmap,chmod,passwd,gcc,make,vim, ssh,mkdir , t a i l ,nano, i f c o n f i g ,head,gzip ,scp,ping ,dpkg, c l e a r , cc ,uname,chown,uptime ,python ,who,echo, f t p ,...
Belgium Russian Federation Romania United Kingdom United States Lithuania Hungary Poland Iran Spain Austria France Finland Netherlands Norway
Switzerland ChinaCzech Republic
Sweden Denmark Germany Italy Australia India other
Figure 11. Distinct destination IP per country
1−4 5−99 100−500 500−1000 1000+
0
2407
10 2 2 2
Figure 12. Distinct destination IP per session
1−4 5−99 100−500 500−1000 1000−10000 10000+
0
2344
48 4 1 6 21
After looking precisely on the semantics of those mostly used commands we build commands classes, that we call activity classes. The Table 13 presents these classes and sum up the mostly used/representative commands we considered to build them. Each class is representative of events encountered in sessions. We build 9 main classes plus 2 particular ones (BF and LR) that are more complicated to isolate. For example, the BF class needs complex computations to be detected, as each passwd event as to be repeated more than 50 times.
Class Name Acronym Representative event comm attributes
Malevolent execution ME perl|python|sh(ell) scripts, botnets | malwares execution File manipulation FM touch, mkdir, find, mv, cp,...
File edition FE vi(m), nano,...
File download FD wget, ftp, scp,...
Machine administration MA emerge, apt-get, apt,... Machine inspection MI ps, who, cpuinfo, proc,...
File unarchiving FU unzip, tar, bzip2,... Source code compilation SC gcc, make, cc,...
Network scan NS scan, nmap,...
Brute Forcing BF passwd(many times)
Local Rebounds LR ssh
Table 13: Attackers activity classes
Attacks Profiles
Based on the activity classes above we tried to find in the sessions some high level activities. To do that, we searched the database for sessions that had events of one given class statistically and significantly more than other sessions. Based on other meta-events, we also defined other high level activity that can characterize on our honeypot a wild range of attacks. In this paragraph, we present the most common distributed attack scenario seen using our correlation system and the cybercrime activities that can be linked to them. Of course, some actual attacks may combine many of these high level activities.
Recognition Attacks
First, the most common type of distributed attacks are recognition processes that scan our whole network and every visible systems on it to help the attacker to have information about our configuration. To detect those activities in the database, we search for elements of the NS class (see Table 13) in the database.
This type of attacks does not make (or rarely do) any damages on the system but helps the following steps of an attack. In some cases, they are not followed by attacks. Cyber-attackers always scan the whole Internet to search for targets that fit the type of attacks they want to do. For example, they look for an operating system with a special version of an application. None the less, they are prerequisite to more complex attacks.