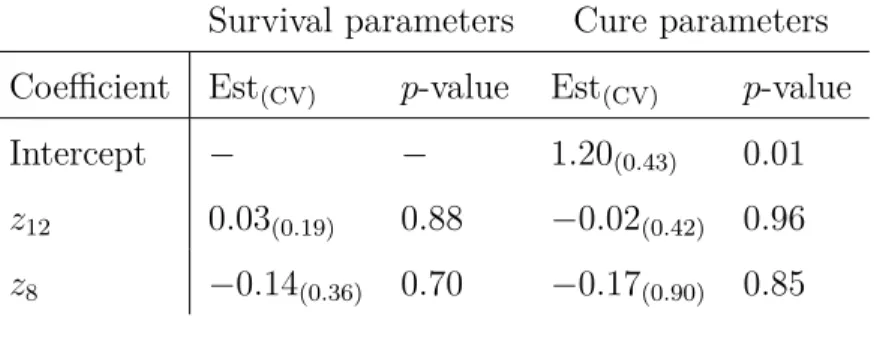
Cure Rate Models
Texte intégral
Figure

Documents relatifs
To see that a qualitative argument can be used: we know that the completely ordered case minimize the energy and we are interested in the states that have the closer possible
In the first article (Upper urinary tract urothelial cell carcinoma: location as a predictive factor for concomitant bladder carcinoma. Epub 2012 May 3) on the timing of Upper Urinary
The following proposition corrects the part of the proof of Proposition 5.7 of the
Recalling the impossibility of doubting his existence and looking back to his “sum”-intuition, the Cartesian
Stability of representation with respect to increasing lim- its of Newtonian and Riesz potentials is established in ([16], Theorem 1.26, Theorem 3.9).. Convergence properties
Figure 10: Estimated instantaneous intensity (years −1 ), with confidence in- terval, of the storms with extreme gradient ( ≥ 100) obtained by extrapolation from the low gradient
Table 1 – MISE of the kernel estimators with bandwidth selected by the Goldenshluger and Lepski method (GL), and with bandwidth selected by cross-validation (CV) of the
In that case, the penalty term being of the same order than the variance over one model, we conclude that the model selection procedure achieves the "expected rate" of order
