UNIVERSITÉ DE MONTRÉAL
BIOMASS GASIFICATION INTEGRATED INTO A REFERENCE
CANADIAN KRAFT MILL
PARDIS ROFOUIEERAGHI DÉPARTEMENT DE GÉNIE CHIMIQUE ÉCOLE POLYTECHNIQUE DE MONTRÉAL
MÉMOIRE PRÉSENTÉ EN VUE DE L’OBTENTION DU DIPLÔME DE MAÎTRISE ÈS SCIENCES APPLIQUÉES
(GÉNIE CHIMIQUE) FÉVRIER 2012
UNIVERSITÉ DE MONTRÉAL
ÉCOLE POLYTECHNIQUE DE MONTRÉAL
Ce mémoire intitulé:
BIOMASS GASIFICATION INTEGRATED INTO A REFERENCE
CANADIAN KRAFT MILL
présenté par: ROFOUIEERAGHI Pardis
en vue de l’obtention du diplôme de: MAÎTRISE ÈS SCIENCES APPLIQUÉES a été dûment accepté par le jury d’examen constitué de:
M. TAVARES Jason R., Ph.D., président
M. PARIS Jean, Ph.D., membre et directeur de recherche
M. PERRIER Michel, Ph.D., membre et codirecteur de recherche M. PRETO Fernando, Ph.D., membre
Dedication
To my beloved grandfather, Karim Kahrizi
Acknowledgements
First, I would like to state my deep appreciation to my advisor Professor Jean Paris for his diligence, experience, and trust and to Professor Michel Perrier for his supports. Many thanks to my friends and classmates for their supports, Maria Mironova, Milad Aghabararnejad, Tatiana Rafione, and Omid Ebrahimpour who I am filled with gratitude for his continuous company. Finally, I would like to thank my mother and my father, Parvin and Reza, and to my brother, Pouya with deep appreciation and sincere admiration for their love and supports.
Résumé
L'intégration de la bioraffinerie forestière dans l'industrie des pâtes et papiers crée une augmentation de la demande d’énergie. Comme l'industrie des pâtes et papiers est un des plus gros consommateurs de biomasse ligneuse au Canada, les déchets (écorces, liqueur noire, etc.) de cette industrie peuvent être utilisés pour répondre à la demande énergétique des usines de pâtes et papiers. Les ressources en biomasse peuvent également être utilisées pour produire des biocarburants, de l'électricité et des produits chimiques de spécialité. Le processus de gazéification est la méthode la plus efficace pour utiliser le potentiel énergétique de la biomasse. Dans cette étude, un bilan de masse et d'énergie ainsi qu’une analyse économique et environnementale d’un procédé de gazéification intégré à une usine Kraft de référence ont été réalisé. Pour ce faire, un modèle d'un procédé de gazéification comprenant une unité de séchage de la biomasse, une unité de gazéification ainsi que des unités de nettoyage des gaz a été simulé sur MATLAB puis sur Aspen Plus. Ce modèle a par la suite été lié à une simulation d’une usine Kraft de référence développée sur la plateforme CADSIM Plus. Un modèle thermodynamique d'équilibres modifiés pour le gazéificateur de biomasse a été développé afin d’améliorer la précision de la modélisation en équilibre. Le modèle a été évalué en utilisant aussi bien des données commerciales que des données provenant de la littérature. Deux études de cas pour la gazéification de la biomasse intégrée à usine Kraft de référence ont été évaluées. La comparaison des données du modèle d'équilibre avec les données expérimentales disponibles à partir de circuler gazogènes de biomasse à lit fluidisé a indiqué que le modèle d'équilibre nettement sous-estimer le rendement en méthane. Dans le modèle modifié, un modèle de dégazage est utilisé pour modérer l'écart du méthane basé sur la reconnaissance du fait que le méthane qui est initialement généré dans le processus de dégazage de la biomasse, ne pas réformer par des réactions de gazéification. Un modèle de dévolatilisation générale semi-empirique est appliqué pour prédire la composition des gaz volatils. Deux coefficients empiriques sont calculés à partir des données empiriques disponibles pour des expériences de dégazage de la biomasse. Les atomes correspondants de carbone et d'hydrogène à partir du méthane rendement prédite par le modèle de dévolatilisation sont éliminés du courant d'entrée gazéificateur. Le modèle modifié donne une meilleure estimation de la composition du gaz de synthèse à partir d'un air soufflé gazéifier de biomasse à lit fluidisé circulant en comparaison avec les données d'équilibre et deux données d'équilibre modifiés sont tirés de la littérature. Dans le
premier cas, le produit issu de la gazéification de la biomasse est utilisé pour substituer le carburant fossile utilisé dans le four à chaux. Dans le second cas, la gazéification de la biomasse a été intégrée à un cycle combiné (cogénération). La faisabilité technique de ces deux scénarios a été démontrée. Une analyse économique pour les deux scénarios tenant compte du coût total en capital, des coûts d'exploitation et des recettes et considérant également la réduction des taxes sur les émissions de CO2 a été réalisée.
Abstract
The integration of forest biorefinery into the pulp and paper industry introduces increased energy demands to the mills. As the pulp and paper industry is the largest woody biomass consumer in Canada, biomass resources such as bark, wood wastes, and black liquor that are used by pulp mills can be processed to supply energy demands of the mills and biorefinery units. Also, pulp and paper biomass resources can generate renewable biofuels, electricity, and chemicals. Gasification process is the most efficient method for utilizing the energy potential of biomass. The principle of this study is to perform mass and energy, economic, and environmental analyses for an integrated gasification process into a reference Canadian Kraft mill. To achieve this, a model of a complete gasification process including biomass drying, gasifier and gas cleaning units was simulated in MATLAB and Aspen Plus and then linked to a reference Kraft process that has been developed on the CADSIM Plus platform. A modified thermodynamic equilibrium model is developed to improve the prediction of syngas composition and heating values. Thermodynamic calculations are implemented based on non-stichiometric formulation to develop an equilibrium gasifier model. Comparison of equilibrium model data with available experimental data from circulating biomass fluidized bed gasifiers indicated that the equilibrium model significantly under-estimate the methane yield. In the modified model, a devolatilization model is employed to moderate the methane deviation based on acknowledgement the fact that methane which is initially generated in the biomass devolatilization process, does not reform through gasification reactions. A general semi-empirical devolatilization model is applied to predict the composition of volatile gases including methane composition. Two empirical coefficients are calculated from empirical data for available biomass devolatilization experiments. The corresponding atoms of carbon and hydrogen from predicted methane yield by devolatilization model are removed from the gasifier input stream. The modified model gives better estimation of the syngas composition from an air-blown circulating biomass fluidized bed gasifier in comparison with equilibrium data and two modified equilibrium data are taken from the literature. Two case studies for integrated biomass gasification with the reference Kraft are evaluated: using wood gasified to fire lime kiln, and integrated biomass gasification combined cycle. In the first scenario, the feasibility of replacing natural gas with syngas from wood residues gasification to fire the Kraft mill lime kiln is assessed. For the second scenario, the feasibility of replacement of the existing bark boiler with the integrated biomass gasification
combined cycle is analyzed. Technical practicability of both scenarios based on the mass and energy balances derived from gasification process model is investigated. To evaluate the economic viability for both scenarios, total capital costs, operating costs, and revenues which achieved through lime kiln fossil fuel reduction, and also CO2 emissions taxes are considered. The net present worth, NPV for 20 years payback period and 10% interest rate are estimated for the two case studies. It has been shown that gasified biomass is an attractive alternative lime kiln fuel for mills with access of woody biomass and concerns in reduction of fossil greenhouse gas emissions. Moreover, if the necessity of new bark boiler installation considered, the replacement of the existing bark boiler with integrated gasification combined cycle is technically viable. The results also show that the replacement of bark boiler has the potential to contribute to reduce global CO2 emissions. Economic analysis proves the replacement of bark boiler with gasification power unit is economically feasible.
Table of Contents
Dedication ... III Acknowledgements ... IV Résumé ... V Abstract ... VII Table of Contents ... IX List of Figures ... XII List of Tables ... XIV NOTATION ... XVICHAPTER 1: Introduction ... 1
1.1. Problem introduction ... 1
1.2. Kraft pulping process ... 2
1.3. Integrated gasification into pulp and paper industry ... 4
1.4. General objective... 5
1.5. Structure and organization ... 6
CHAPTER 2: OVERVIEW OF BIOMASS GASIFICATION ... 7
2.1. Biomass gasification Process ... 7
2.1.1. Biomass feed... 7
2.1.2. Biomass dryer ... 8
2.2. Air biomass gasification ... 9
2.2.1. Pyrolysis ... 9
2.2.2. Partial oxidation ... 11
2.2.3. Char gasification ... 11
2.3. Operating conditions ... 11
2.3.2. Gasifying agent ... 14
2.3.3. Equivalence ratio ... 14
2.3.4. Temperature ... 15
2.4. Evaluation criteria ... 15
2.5. Biomass gasifier modeling ... 16
2.5.1. Thermodynamic equilibrium modeling ... 16
2.5.1.1. Stochiometric models ... 16
2.5.1.2. Non-stochiometic models ... 17
2.5.1.3. Pseudo equilibrium models ... 18
2.6. Devolatilization model ... 23 2.7. Syngas cleaning ... 24 CHAPTER 3: Methodology ... 27 3.1. Main objective ... 27 3.2. Specific objectives... 27 3.3. Overall methodology ... 27
3.3.1. Developing a model of biomass gasification process ... 27
3.3.2. Integration of biomass gasification process into a reference Kraft mill ... 29
3.3.3. Technical and economic analysis of integrated biomass gasification process ... 30
CHAPTER 4: Model Development ... 31
4.1. Biomass dryer ... 31
4.2. Biomass gasifier ... 32
4.2.1. Equilibrium modeling based on the RAND algorithm ... 33
4.2.2. Specification of non equilibrium factors ... 37
4.2.3. Methane yield calculation ... 41
4.3. Syngas cooling and cleaning ... 51
4.3.1. SELEXOL Unit ... 52
4.4. Combined heat and power generation ... 53
CHAPTER 5: Results and Discussion ... 55
5.1. Reference Kraft mill ... 55
5.2. Feedstock’s characteristics ... 56 5.3. Biomass dryer ... 57 5.4. Biomass gasifier ... 57 5.4.1. Model analysis ... 57 5.4.2. Gasifier type ... 61 5.4.3. Gasifier results ... 64 5.5. Case study 1 ... 66 5.6. Case study 2 ... 71
5.7. Gas emission reduction ... 74
5.8. Economic analysis ... 76
CHAPTER 6: Conclusions and Recommendations ... 81
6.1. Conclusion ... 81
6.2. Recommendations ... 82
List of Figures
Figure 1.1. Schematic diagram of a Kraft pulping process ... 3
Figure 1.2. Replacement of recovery boiler with black liquor gasification ... 4
Figure 2.1. Gasification procedures (Gomez-Barea and Leckner, 2010) ... 10
Figure 2.2. Gasifier types, (Stassen et al., 2002) ... 12
Figure 2.3. Structure of (Li et al., 2004)phenomenological model ... 19
Figure 2.4. Procedure of temperature estimation, (Jarungthammachote and Dutta, 2008) ... 22
Figure 2.5. Pyrolysis process ... 24
Figure 2.6. Typical absorption process, (Kanniche and Bouallou, 2007) ... 26
Figure 3.1. Basic process steps of an integrated biomass gasification process ... 28
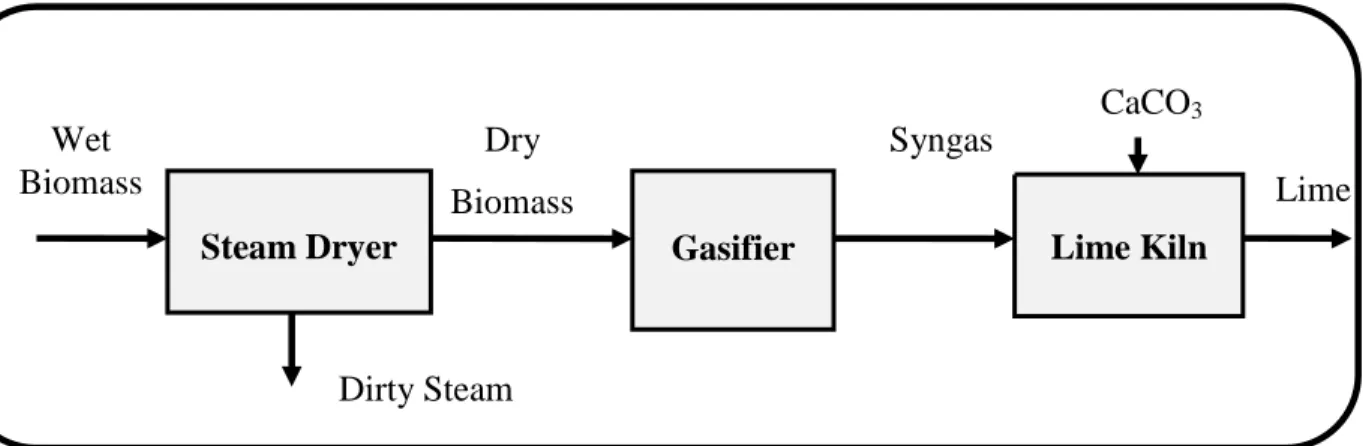
Figure 3.2. Flow diagram for biomass gasification lime kiln process ... 29
Figure 3.3 Flow diagram for replacing bark boiler with a BIGCC ... 30
Figure 4.1. Aspen Plus process for biomass dryer ... 32
Figure 4.2. Developing steps of the modified equilibrium model ... 33
Figure 4.3. Comparison of equilibrium CO with the experimental data ... 39
Figure 4.4. Comparison of equilibrium H2 with the experimental data ... 39
Figure 4.5. Comparison of equilibrium CO2 with the experimental data ... 40
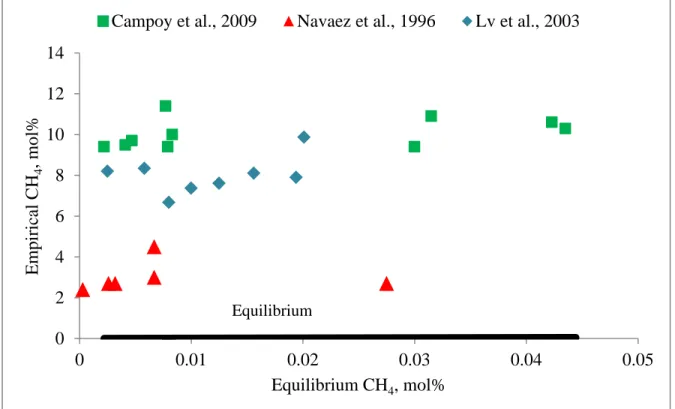
Figure 4.6. Comparison of equilibrium CH4 with the experimental data ... 40
Figure 4.7. Carbon conversions over equivalence ratio for the experimental gasification data ... 41
Figure 4.8. Logarithmic ratio of CO/CO2 over temperature ... 43
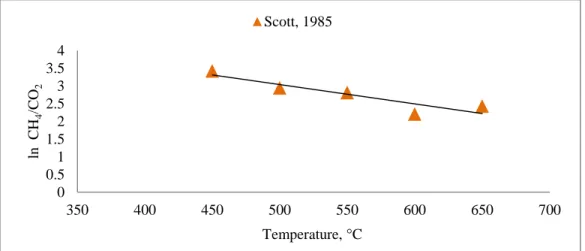
Figure 4.9. Logarithmic ratio of CH4 /CO2 over temperature ... 43
Figure 4.10. Evaluation of estimated yCO/yCO2 with empirical data ... 46
Figure 4.11. Evaluation of estimated yCH4/yCO2 with empirical data ... 46
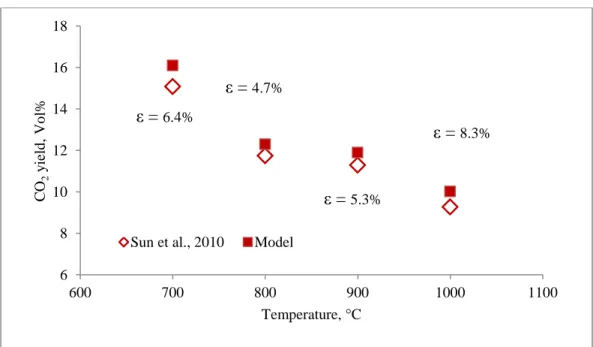
Figure 4.12. Comparison of the predicted CO yield with (Sun et al., 2010) data ... 47
Figure 4.14. Comparison of the predicted H2 yield with (Sun et al., 2010) data ... 48
Figure 4.15. Comparison of the predicted CH4 yield with (Sun et al., 2010) data ... 48
Figure 4.16. Evaluation the estimation of ... 50
Figure 4.17. Model evaluation for a typical gasification test with the CFB gasifier at 861° C .... 51
Figure 4.18. Schematic diagram of dual stage SELEXOL process in Aspen Plus ... 53
Figure 4.20. Schematic diagram of power plant in Aspen Plus ... 54
Figure 5.1. Effect of temperature on syngas composition ... 59
Figure 5.2. Effect of ER on syngas composition ... 60
Figure 5.3. Effect of temperature on syngas heating value ... 61
Figure 5.4. Effect of ER on syngas heating value ... 61
Figure 5.5. Historical chart of crude oil prices,(BP Statistical Review, 2010) ... 66
Figure 5.6. Schematic diagram of a CFB lime kiln gasification process, (Salo, 2009) ... 67
List of Tables
Table 2.1. Advantages and disadvantages of gasifier types ... 13
Table 2.2. Conditions of different gasifying agents (Wang et al., 2008) ... 14
Table 2.3. Comparison between models output and experimental data at T=851˚C ... 21
Table 4.1. The experimental set-up characteristics ... 38
Table 4.2. Activation energy of volatilization gaseous products ... 43
Table 4.3. Experimental data of pyrolysis gas yields ... 44
Table 4.4. Essential quality of syngas for different applications, (Gills, 2008) ... 51
Table 5.1. Key parameters for the reference Kraft mill ... 55
Table 5.2. Reference Kraft mill Woody biomass data ... 56
Table 5.3. Biomass dryer key results ... 57
Table 5.4. The ultimate analysis of biomass feedstock ... 58
Table 5.5. Commercial biomass gasifier data ... 63
Table 5.6. Comparison of the model results for Foster wheeler and Lurgi gasifiers ... 64
Table 5.7. Biomass gasifier results ... 65
Table 5.8. Reference Kraft mill lime kiln data ... 68
Table 5.9. Reference Kraft mill lime kiln data ... 69
Table 5.10. Comparison of syngas characteristics with natural gas and fuel oil ... 70
Table 5.11. Comparison of the results with Pietarsaari mill ... 71
Table 5.12. Performance data for IBGCC ... 74
Table 5.13. Predicted CO2 emissions reduction ... 76
Table 5.14 Total Capital Investment estimation methodology ... 77
Table 5.15. Material costs adjusted to 2010 $ ... 77
Table 5.16. Capital costs for different units, (MM $) ... 78
Table 5.18. NPV results, ($1000) ... 80 Table 5.19. Replacement of natural gas with syngas, annual cost comparison ... 80
NOTATION
AC: corresponding corrected carbon utilized in the calculations.
AC0: True values of the carbon in the system
AH: corresponding corrected hydrogen utilized in the calculations.
AH0: true values of the hydrogen in the system
bk : number of atoms of the kth element in a molecule of species i
b∗ : element abundance vector modified with kinetic carbon conversion, dimensionless : cost of the equipment at capacity
: cost of the equipment at capacity E: activation energy (kJ/mol)
Fk : cash flow at the end of the k period
G: system Gibbs free energy (kJ/mol) IR: interest rate for each year
i : species index
K1: equilibrium constant for water-gas shift reaction
K2: equilibrium constant for C+ 2H2 →CH4
k0: pre-exponential constant (s−1)
L: plant life
M, N: generic chemical species (atom or molecule) Mi : molecular weight of product i at time t
m, n : coefficient of atomic carbon and hydrogen for tar mw: number of moles of water vapor (dry basis)
N' : total number of species considered
: The number of moles of methane produced in the devolatilization step, per kilogram of biomass ni = number of moles of species
nt : total number of gaseous moles in the reactor
nzα: inert moles in phase a (mol)
P : pressure (N/m2)
Px : partial pressure of species
qi: capacity of equipment
R : ideal gas constant 8.314 (J/mol/K) R-squared: statistic fitting factor SSE: explained sum of squares T : thermodynamic temperature (K)
uα : phase split of differential change in total moles of the system
Vi : yield of product i at time t
Vi*: ultimate yield of i at high temperature and long times
: carbon conversion into gaseous products methane conversion by steam reforming
x,y,z : normalized coefficient of atomic hydrogen, oxygen, and nitrogen for biomass molecule x1-x5 :number of moles of H2, CO, CO2, H2O, and CH4
xg : number of moles of oxygen for gasification
: gas yield of pyrolysis product
adt: standard dry ton AGR: acid Gas Removal ASU: air separation unit
CFB: circulating fluidized bed daf : dry, ash fre
DME: dimethyl-ether DC: direct cost ER: equivalence ratio HHV : higher heating value
HRSG: heat recovery steam generator IC: indirect costs
IRR: internal rate of return LP: low pressure MJ: mega joule MM: million MP: medium pressure MW: megawatt MWth: megawatt thermal Nm3: normal cubic meter
NREL: National Renewable Energy Laboratory NPV: net product value
TCI: total capital investment TDIC: total direct and indirect cost TIC: total installed cost
TJ: tetra joule
TPEC: total purchased equipment cost TPI: total plant investment
Greek Letter
ΔGT: Gibbs free energy (kJ/kmol)
∆H: enthalpy changes (kJ/kmol) ∆Hf: heat of formation (kJ/mol)
( )= Lagrange function α: phase index
β : elemental availability, or fractional achievement of equilibrium, dimensionless βC: availability of carbon, dimensionless
βC,1: fraction of carbon converted into gaseous species, dimensionless
βC,2: fraction of carbon converted into methane, dimensionless
fraction of carbon and hydrogen converted into methane βH :availability of hydrogen, dimensionless
: mass fraction of gas species in the volatile gases Kronecker delta
: exponential factor
λk: Lagrange multiplier for the kth element
μi: molar free energy of species i (kJ/mol)
μ*
i : standard chemical potential of species i (kJ/mol)
π: total number of phases in system : acentric factor
𝜏: payback time
φi: fugacity coefficient of species i
CHAPTER 1: Introduction
1.1. Problem introduction
Converting pulp and paper mills to biorefinery-based mills has the potential to help with difficulties such as a decrease in demand for pulp and paper products and increases in energy costs. Reduction of greenhouse gas emissions is also an important driver for converting mills into biorefineries. Kraft pulping process which produces approximately 60% of global pulp and paper products consumes significant amounts of energy generated from fossil fuels. By-products and wood residues resulting from a Kraft mill and black liquor are major biomass resources that can be applied to generate energy and value-added products. On the other hand, the implementation of biorefinery units into a Kraft mill can have two compounded effects on the steam system: it can create additional steam demand for the extraction and conversion units, and reduce steam production capacity. The installation of an integrated gasification system to process wood residues is an attractive solution to avoid increased dependency on fossil fuels and eventually to eliminate their use.
Gasification for enhancing biomass energy utilization is relatively mature compared with other possible technologies. Biomass gasification is a thermochemical conversion method to convert biomass feed into the synthesis gas product via partial oxidation of feedstock in the presence of air, oxygen and/or steam. The produced syngas can be applied directly to produce renewable fuels, energy and other products or it can be subsequently processed in synthesis reactors to generate liquid fuels such as ethanol, DME and mixed alcohols.
In order to precisely investigate the integration of biomass gasification process into a Kraft mill, a comprehensive model of a gasification plant is required. The core of the simulation is the model of the gasification chamber. Most available models are based on equilibrium assumptions. However, equilibrium modeling is valid only when the gasification temperature is high enough and the residence time is larger than the time required to complete the reactions. Due to absence of these conditions, equilibrium models estimate inaccurate syngas composition. In the present study, the equilibrium model is modified to take into account the fact that the biomass gasification occurs in two steps: devolatilization followed by partial oxidation and char gasification.
Finding an alternative fuel for lime kilns which are utilized in Kraft mills to convert lime mud (CaCO3) to lime (CaO) through calcination reactions is an opportunity to reduce fossil fuel consumption in pulp and paper industries. The heat demand of the reaction is generally provided by burning natural gas or fuel oil in the lime kiln. Typically, 8.44 GJ per ton of lime product is required to heat lime kiln process (Francey et al., 2009). Using gasified wood residues to fire in lime kilns is an alternative which will reduce the dependency on fossil fuel consumption.
In addition, the integration of biomass gasification with a pulp and paper mills for electricity and steam production has the capability of reducing greenhouse gas emissions with positive economic benefits. Although, considerable interest has been exhibited in biofuel production, several studies have shown that the combined heat and electricity generation and heating applications are more cost effective (Wetterlund et al., 2011), (Rodrigues et al., 2007), (Wahlund et al., 2004), (Azar et al., 2003), (Dornburg and Faaij, 2001)).
In this study, integration of biomass gasification with a Canadian reference Kraft mill is investigated. As the recovery boiler does not supply the whole steam demand of the mill, a bark boiler is utilized to generate the required Kraft steam. The replacement of the existing bark boiler with a biomass gasifier is studied. In economic evaluation, it is assumed that a new investment would be made to replace an existing bark boiler system which had attained the end of its life. Moreover, the environmental benefits of the replacement are considered. Additionally, the use of gasified biomass as an alternative fuel to fire the lime kiln is investigated. Economic and environmental analyses as well as a technical study are performed to verify the feasibility of the implementation of an integrated gasification process into the reference Kraft mill.
1.2. Kraft pulping process
The Kraft process is the most efficient pulping process to transform woody biomass into paper and pulp. A schematic diagram of the Kraft mill is shown in Figure 2.1. First, to liberate the cellulose fibers, the white liquor, mixture of NaOH and Na2S, is used to heat the wood in the digester to degrade wood into cellulose, lignin and hemicelluloses. Then, after washing and bleaching cellulose fibers are drained, pressed, and thermally dried in a pulp machine.
The dissolved materials include hemicelluloses, cellulose, lignin and together with various others organics are called black liquor and are sent to a series of multi-effect evaporators and concentrators, where it is concentrated from 13-17% solids to 65-85% solids to form a strong black liquor. Subsequently, the concentrated black liquor is burned in a Tomlinson recovery boiler to generate steam and to recover the chemical smelt. Typically, the high pressure steam produced in the recovery boiler is sent to a steam turbine to generate and LP steam. The chemical smelt which is highly concentrated in sodium carbonate and calcium carbonate is recovered through the conversion of sodium and sulfur compounds to sodium carbonate (Na2CO3) and sodium sulfide (Na2S) under local reducing conditions. The smelt leaving the recovery boiler is dissolved in water to form green liquor, which is followed by
the causticization of sodium carbonate with lime to convert Na2CO3 to NaOH. The causticized green liquor known as white liquor, which contains NaOH and Na2S is recycled to the digester. The precipitated calcium carbonate (CaCO3) is separated from the white liquor, washed and dewatered to form lime mud. To recover the lime for reusing in the causticizing unit, the lime mud recovers through the calcination reaction in a lime kilns process as follows:
The required heat for the endothermic calcination reaction is provided by directly firing fuels in the lime kiln (Smook, 1990).
Figure 1.1. Schematic diagram of a Kraft pulping process
1.3. Integrated gasification into pulp and paper industry
The economic and environmental benefits of integrated gasification processes for a variety of industrial plants for electricity production and biofuel generation have been previously studied. Generally, the study of integration of gasification into pulp and paper industries includes two different types of processes: gasification of black liquor generated by the reference mill and woody biomass gasification. Although, integrated black liquor gasification in pulp mills has received considerable attention over recent years ((Lindblom, 2007),(Andersson and Harvey, 2006), (Berglin and Berntsson, 1998), (Larson et al., 2003)), only a few studies have investigated the integration of biomass gasification. Some studies have considered both biomass and black liquor gasification integration into pulp and paper mills. For example, (Naqvi et al., 2010) replaced the old bark boiler with a new power boiler with a higher capacity of power and steam production in order to compensate for the energy amount of black liquor that converted to biofuels (Figure 2.2). As well, (Consonni et al., 2009) considered both black liquor and biomass gasification for integration into an American pulp and paper mill. Seven configurations to produce mixed alcohols, dimethyl ether, and Fischer-Tropsch liquids were proposed in their study. The economic analysis confirmed that gasification-based Kraft mill biorefinery introduced significant benefits.
Recently, (Wetterlund et al., 2011) evaluated the integration of biomass gasification with pulp and paper production. Two biomass gasification scenarios were considered in their work: Biomass Integrated Gasification Dimethyl Ether production (BIGDME) and Biomass Gasification Integrated Combined Cycle (BIGCC). The results showed that energy market parameters strongly influence the profitability of biomass gasification integration with pulp and paper industry. The BIGDME case performs better than BIGCC when district heating is also utilized, whereas greenhouse gas emissions are reduced more in the BIGCC case. While, considerable interest has been shown in standalone biomass gasification in literature and industry; a few studies have been performed on the integration of biomass and wood residues gasification with a Kraft mill (Wetterlund et al., 2011),(Consonni et al., 2009). The integration of wood residues gasification with a Kraft mill in order to substitute the lime kiln fossil fuel can be an attractive alternative. After the enormous increases in oil prices in early 1980's, several lime kiln gasification processes were installed. The Ahlstrom Pyroflow CFB gasifier was installed in 1983 at the Wisa Forest Pulp and Paper Mill in Pietarsaari, Finland to apply gasified wood residues for firing the lime kiln. The target of 85% replacement of oil was obtained in few months with two years payback period. Since then, between 1985 and 1986, three more gasifiers, two in Sweden (25 MWth at Norrsundet Bruks, AB, Norrsundet and 27 MWth at ASSI, Karlsborg Bruk, Karlsborg) and one in Portugal (15 MWth at Portucel, Rodao Mill), were built and installed for firing lime kilns. These gasifiers produce lime kiln fuel from bark and waste wood (Abdul Salam et al., 2010).
1.4. General objective
The aim of the present study is to evaluate the technical, economic and environmental effects of integrated woody biomass gasification with a reference Kraft mill. In the present study, two different scenarios are considered:
Using the syngas generated from biomass gasification as an alternative fuel for the lime kiln.
Applying a biomass integrated gasification combined cycle, BIGCC, to generate steam and electricity in a combined heat and power plant.
In order to obtain the mass and energy balances for the above mentioned scenarios, a complete simulation for the different gasification units is required. Since the gasifier model is the heart of
the simulation, using an accurate gasifier model to predict the syngas composition can be a great benefit. One of the simulation objectives is to generate a precise model of biomass gasification. The modified thermodynamic equilibrium model for biomass gasifier will be developed based on the minimization of Gibbs free energy. The model of biomass dryer, Syngas cooling and cleaning, and heat and power units would be implemented in Aspen Plus. The modified gasifier model would be developed in MATLAB and would be linked to the simulation of other process units in Aspen Plus and to a reference Kraft mill which has been simulated in CADSIM Plus through Excel.
1.5. Structure and organization
In chapter 2, the important parameters and concepts that should be considered in the gasification process are reviewed. As the development of gasifier model is the key target of the present thesis, the research review on gasification modeling receive more attention in this chapter. In chapter 3, the specific objectives and overall methodology are presented.
In chapter 4, the results and techniques used in developing the simulation model for different steps of the gasification plant are illustrated. Also, the model validation of each unit is demonstrated.
In chapter 5, the feasibility analysis of replacing fossil fuel in lime kilns with the produced synthesis gas from the biomass gasification is discussed. Furthermore, the viability of the replacement of existing bark boiler in the reference Kraft mill with an integrated biomass gasification combined heat and power unit is also investigated.
CHAPTER 2: OVERVIEW OF BIOMASS GASIFICATION
2.1. Biomass gasification Process
The main gasification parameters include biomass type and properties, gasifier type, gasification temperature, gasification agents, and flowrates of biomass and oxidizing agents. 2.1.1. Biomass feed
Although, biomass gasifiers are flexible for a variety of biomass feedstocks, the type of biomass has significant effects in the overall syngas composition and operational issues. The biomass types are categorized based on the following parameters (Quaak et al., 1999):
Moisture content
Biomass having high moisture content requires additional heat for evaporation of the moisture. Biomass with high moisture content reduces the gasification temperature causing incomplete cracking of the hydrocarbons generated in the pyrolysis step. Additionally, the moisture content in the presence of CO increases the amount of H2 through the water gas shift reaction. As a result, the CH4 content increases in the presence of the high H2 content. In general, the heating value of the syngas is reduced with higher moisture contents. The reduction can be explained by decreases in the CO content compared with the increase in the amounts of H2 and CH4 (Zainal et al., 2001).
Ash content
The amount of inorganic components and ash content are important parameters especially when gasification occurs in high temperatures.
Volatile matter content
The amount of biomass which is released when the biomass is heated up to 400 °C is called volatile matter. High difference in the amount of volatiles in biomass (70-75%) compared to coal (20-25%) causes a significant variations between them.
Proximate analysis
The proximate analysis categorizes the biomass in terms of moisture content, volatile content, fixed carbon, ash content, and heating value.
Ultimate analysis
The major components are carbon, hydrogen, and oxygen. Generally, biomass includes small amounts of nitrogen and sulfur. The ultimate analysis gives the composition of the biomass in weight percentage of carbon, hydrogen and oxygen as well as sulfur and nitrogen.
Heating value (HHV)
Biomass heating value is given on wet, dry, or dry and ash free basis. For all biomass feed types, higher heating value on a dry and ash free basis is in the order of 20 MJ/kg.
2.1.2. Biomass dryer
The moisture content of “fresh” woody biomass is typically 50% to 55%. In order to decrease the required heat to raise the gasifier temperature, the moisture content needs to be reduced in a dryer. For gasification, the best possible moisture range of biomass after drying is 10-15 wt%. A biomass dryer is an essential unit in a gasification process and influences the feasibility of the gasification plant. The heat source, biomass feed characteristics, and electricity cost determines the selection of the biomass dryer. The most common biomass drying technologies are:
Flue gas dryer
A flue gas-based dryer has the advantage of using flue gas which improves the net mill energy efficiency. However, a large flow of flue gas is needed because of the low temperature of flue gas. The large volume of flue gas mandates a big biomass dryer with considerable electricity consumption. Also, there is a biomass contamination risk from impurities of flue gas. Typical energy estimation for a flue gas dryers is about 3200 kJ/kg H2O (Wimmerstedt and Linde, 1998). Typically, around 2600 kJ/kg water is required to evaporate the moisture. Extra heat is needed to compensate energy losses and to heat biomass feed. To avoid huge dryers with high electricity consumption, biomass dryers in gasification plants utilize hot gas generator to burn a portion of the produced syngas for use in the biomass dryer. Generally, about 25% of the produced syngas is applied for drying.
Air dryer
Recently, low temperature air dryers have received significant interest for biomass drying system because of the low grade heat and low gas emissions (Heyene, 2010). The heat demand for a low temperature air dryer is about 2700 KJ/Kg H2O (Holmberg and Ahtila, 2005).
Steam dryer
As steam dryers have the potential to recover a large amount of the input heat through the moisture condensation, considerable attention has been shown for heat integration in steam dryers (De Kam et al., 2009). Due to energy recovery in steam dryers, the net heat demand for a steam dryer is about 600 KJ/Kg H2O (Heyene, 2010).
2.2. Air biomass gasification
Thermochemical conversion techniques of biomass are categorized by the amount of air, residence time, temperature, and the heat transfer rate in the process. Supplying stochiometric air results in combustion while treatment without air/oxygen leads to in pyrolysis products. Gasification is the conversion of biomass into a gas, syngas, by partial oxidation at high temperature around 700-1000˚C in the presence of a gasifying medium such as air, oxygen or steam (Demirbas, 2009). Syngas from biomass is a mixture of carbon monoxide (CO), carbon dioxide (CO2), hydrogen (H2), water (H2O) and a small amount of methane (CH4).
Biomass gasification has the potential for higher efficiency in comparison with existing technologies. The gasification process can be divided after drying into three steps (Figure2.3): 1. Pyrolysis or devolatilization 2. Partial oxidation 3. Char gasification
2.2.1. Pyrolysis
Pyrolysis is thermal degradation of biomass and does not require oxygen/air. In the initial pyrolysis step, the biomass converts to char (solid phase), tar (liquid phase), and volatiles (gaseous phase):
Figure 2.1. Gasification procedures (Gomez-Barea and Leckner, 2010)
The generated volatile matter in the pyrolysis step is a mixture of CO, CO2, H2, H2O, and CH4 (Kaushal et al., 2010):
(3)
The produced tar converts by thermal cracking, reforming, and partial oxidation in the secondary pyrolysis reactions as follows (Gomez-Barea and Leckner, 2010):
( ⁄ ) ( ⁄ ) Partial oxidation (4) ( ⁄ ) Dry reforming (5) ( ⁄ ) Steam reforming (6) ( ⁄ ) Hydrogenation (7) ( ⁄ ) ( ⁄ ) Thermal cracking
is considered as the tar formulation.
2.2.2. Partial oxidation
In the Oxidation step, the volatile gases and the produced char react with to supply the required heat for endothermic gasification reactions (Gomez-Barea and Leckner, 2010):
(9) ⁄ (10) ⁄ (11) ⁄ (12) (13) (14) 2.2.3. Char gasification
Char reacts with in the gasification step. The char gasification reactions are slow compared to the pyrolysis reactions. The char gasification step includes the following reactions (Gomez-Barea and Leckner, 2010):
(15) (16) (17)
2.3. Operating conditions
Several parameters affect the performance of a gasifier. Biomass type, gasifier type, gasifying agent, equivalence ratio, and temperature are the most important parameters influencing the gas product quality:
2.3.1. Gasifier type
Several types of reactors have been used as biomass gasifiers. The gasifiers can be classified based on the way in which the biomass feed and the gasifying agents are contacted and the hydrodynamics. Fixed bed and Fluidized bed are the most well known types of gasifiers. Among the fixed bed reactors, downdraft and updraft are the most common gasifiers. Furthermore, Bubbling and Circulating Fluidized Bed are the most common fluidized bed gasifiers (Figure 2.4).
Ash Gas,Tar, Water Air Biomass Combustion Pyrolysis a)Updraft Ash Gas,Tar, Water Air Biomass Reduction Pyrolysis b)Downdraft
C) Bubbling bed d) Circulating fluidized bed
Figure 2.2. Gasifier types, (Stassen et al., 2002)
In the updraft gasifier, the biomass and the gasifying agent move in opposite directions. As the syngas formed is not forced to pass through the hot high temperature zone, the tar content is high in the syngas from this type of gasifier. On the other hand, in the downdraft gasifier, the biomass and gasifying agent both move in the same direction. The amount of tar is lower than
that in an updraft gasifier. In fluidized bed gasifiers, feedstock is fluidized in a bed of material like sand/silica with a gasifying medium which can be air or steam. A fluidized bed gasifier can provide higher throughput, heating value and efficiency by improving mass and heat transfer. Circulating fluidized bed has an advantage over the bubbling bed gasifier in term of mass conversion efficiency. It reduces particulate content in the syngas output by trapping solid material in the gas phase in a hot cyclone and recirculating back to the gasification bed (Warnecke, 2000).
The selection of gasifier type depends on many factors such as fuel type, size, moisture content and ash content. Table 2.1 lists the advantages and disadvantages of various gasifier types (EPA-CHP, 2007).
Table 2.1. Advantages and disadvantages of gasifier types
Gasifier Advantage Disadvantage
Updraft fixed bed Handle high moisture No carbon in ash Feed size limits High tar yields Scale limitations Low heating value
Downdraft fixed bed
Small-scale applications Low particulates Low tar
Feed size limits Scale limitations Low heating value gas Moisture-sensitive
Bubbling fluid bed
Large-scale applications Direct/indirect heating Produce high heating value gas
Medium tar yield Higher particle loading
Circulating fluid bed
Large-scale applications Produce high heating value
gas
Medium tar yield Higher particle loading
Entrained flow fluid Potential for low tar Potential for low methane Produce high heating value gas
Large amount of carrier gas Higher particle loading Particle size limits
2.3.2. Gasifying agent
Common gasifying agents are air, oxygen, steam, and carbon dioxide. The required gas composition is an important factor in the choice between steam and air gasification. If methane is the desired product, steam gasification is the preferred method. When hydrogen and carbon monoxide are the desired products, e.g. for Fischer-Tropsch synthesis, air gasification is more suitable. In air gasification, the syngas will contain at least 38% nitrogen. Consequently, the product gas will have a low heating value of around 4–7 MJ/Nm3. This dilution can be avoided by using pure oxygen for gasification or by steam gasification. Pure oxygen gasification produces higher quality gas (10–18 MJ/Nm3). However, due to the high separation cost of oxygen from air, it is not economic (Schuster et al., 2001). As well, the heating value of the syngas can be enhanced by adding steam or CO2 as the gasifying agent. Steam and CO2 gasification require an external heat supply for the endothermic gasification reactions. Main advantages and technical challenges based on the gasifying agent, gasifier type and the operation are summarized in Table 2.2.
Table 2.2. Conditions of different gasifying agents (Wang et al., 2008)
Gasifying Agent Advantage Conditions
Air Moderate char and tar content Low heating value (3–6 MJ N/m3) Large amount of N2 in syngas
Steam High heating value (10–15 MJN/m3
) H2-rich syngas
External heat supply High tar content Catalytic tar reforming Carbon dioxide High heating value
High H2 and CO and low CO2
External heat supply Catalytic tar reforming
2.3.3. Equivalence ratio
Equivalence ratio (ER) is defined as the ratio of the air/oxygen to the stoichiometric air/oxygen. ER has a significant effect on syngas composition. By increasing ER, the combustible products are reduced and higher amount of CO2 is formed. Hence, the heating value of the produced syngas is considerably reduced. As a result, ER plays an important role in determining the overall syngas quality. It should be optimized in order to increase the gasification efficiency.
2.3.4. Temperature
The temperature of a gasifier depends on a variety of parameters such as the moisture content, ER, and heat losses from the system (Corella and Sanz, 2005). Typical temperatures suggested for biomass gasification in a fluidized bed are around 800-1000°C. Higher temperatures increase the carbon conversion. Also, an increase in temperature reduces the tar and char contents inside the gasifier (Zainal et al., 2002). Therefore, higher gas yields can be achieved due to reduction in the char and tar quantities.
2.4. Evaluation criteria
The performance of gasification process is generally evaluated by using following criteria (Rao et al., 2004):
The cold gas efficiency (CGE)
The cold-gas efficiency, CGE, excluding the heating value of the condensable (tars), is defined as the percentage of the fuel heating value converted into the heating value of the product gas:
{ (
) }
{ } (18)
HHV (Higher Heating Value) of the dry gas at the standard state of 101.3kPa and 273 K is a function of gas composition, (Lide and Kehiaian, 1994):
( [ ] [ ] [ ] [ ]
) (19)
Where the species contents are given in mol%, and their heating value of combustion, in MJ/Nm3.
Carbon conversion efficiency ( ):
Carbon conversion is defined as follows:
2.5. Biomass gasifier modeling
A variety of models have been proposed from complex CFD models to simple models based on overall heat and mass balances (Gomez-Barea and Leckner, 2010). Based on the aim of present study, thermodynamic equilibrium modeling approach is selected to predict the syngas composition and gasifier efficiency. The equilibrium modeling is briefly described in the next section.
2.5.1. Thermodynamic equilibrium modeling
Thermodynamic equilibrium modeling provides a reasonable estimation when the reaction temperature and residence time are high enough. Equilibrium conditions are difficult to achieve in practical operating conditions and results obtained from thermodynamic equilibrium modeling can serve as the maximum limit on syngas composition. Numerous equilibrium models have been utilized for biomass and coal gasification in the literature (Kinoshita et al., 1991), (Mansaray et al., 2000), (Li et al., 2001), (Mathieu and Dubuisson, 2002), (Altafini et al., 2003), (Li et al., 2004) (Tang and Kitagawa, 2005), (Jand et al., 2006), (Jarungthammachote and Dutta, 2007), (Nikoo and Mahinpey, 2008), (Huang and Ramaswamy, 2009), (Hannula and Kurkela, 2010).
Equilibrium models can be classified into two approaches: Stochiometric and Non Stochiometric (Smith and Missen, 1982):
2.5.1.1. Stochiometric models
Stochiometric formulation of biomass gasification has been mostly applied in the literature (Zainal et al., 2001),(Schuster et al., 2001),(Melgar et al., 2007), (Huang and Ramaswamy, 2009),(Gautam et al., 2010). In the next section, brief details of stochiometric formulation are clarified.
Assuming that the biomass formula is CHxOyNz and gasification products contain the gas species of H2, CO, CH4, CO2, H2O, and N2, the gasification reaction can be written as (Gautam et al., 2010):
( )
( )
(21)
The stochiometric formulation needs a specified reaction mechanism. If water gas shifts (Equation (14)) and methane formation (Equation (17)) reactions are considered as the two major equilibrium reactions that occur in the gasification process, then the equilibrium constant for these equations as the function of their molar composition can be written as follows:
(22)
(23)
Minimization of Gibbs free energy is used to determine the value of K1 and K2:
(24)
There are six unknown variables (x1-x5, xg) two of which are calculated from Equations (22) and (23), three of them are calculated from mass balances of atoms of carbon, hydrogen, oxygen, and the final unknown is specified from an enthalpy balance equation.
2.5.1.2. Non-stochiometic models
The non-stochiometric formulation has been extensively applied for biomass gasification modeling ((Li et al., 2004),(Jand et al., 2006)). In the non-stochiometric modeling, the gasification reaction mechanism is not required. The elemental composition of biomass indicated from ultimate analysis is the only essential input of non-stochiometric formulation. The non-stochiometric formulation is based on minimizing the Gibbs free energy at the fixed temperature and pressure, subjecting to the element abundance constraints.
( ) ∑
∑
(26)
2.5.1.3. Pseudo equilibrium models
Equilibrium modeling results in a reasonable prediction when temperature is high enough and residence time is larger than the time needed to complete the reactions (Gomez-Barea and Leckner, 2010). As these conditions do not occur in exisiting gasifiers, overestimation and underestimation of produced gas composition occurs in equilibrium modeling. Generally, equilibrium model overestimates the yields of CO and H2, and underestimates the yield of CO2 and CH4. Pseudo equilibrium models by means of empirical relations increase the prediction accuracy of syngas composition. Only, a few number of pseudo equilibrium models have been developed in the literature. Hereafter, the related publications are reviewed.
A straightforward approach for correcting an equilibrium model is implementing the equilibrium relations at a temperature lower than the actual gasifier temperature, i.e. a quasi equilibrium temperature. (Kersten et al., 2003) showed that for the char gasification reaction with H2, CO2, and H2O for temperatures in the range of 740-910 ˚C, the measured unconverted carbon was similar for the equilibrium when evaluated at temperatures in the range of 450-580 ˚C.
(Jayah et al., 2003) considered two of the steps for modelling of gasification process, pyrolysis and gasification. The maximum temperature of system and the composition of produced gas were calculated via a pyrolysis model. The deviation between empirical and model data was corrected by calibration of gasification zone data. In the calibration, the amount of estimated methane was replaced with experimental measurement data of methane.
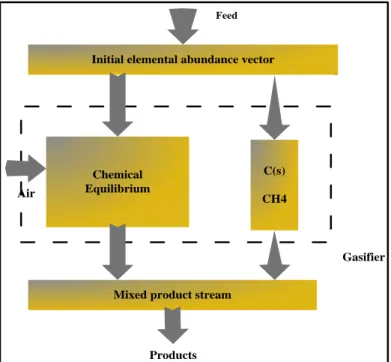
(Li et al., 2004) proposed a phenomenological model to estimate the performance of a circulating fluidized bed gasifier based on the experimental data from gasification of numerous types of woody biomass. The structure of the model is illustrated in Figure 2.5. The model assumed that the produced methane in gasification comes from the pyrolysis step. The amounts of methane and unconverted carbon are estimated and removed from the equilibrium model input stream.
The availability parameter, β, is defined and multiplied in elemental composition to modify the abundance vector: ( ) (27) Chemical Equilibrium C(s) CH4 Initial elemental abundance vector
Mixed product stream Feed
Gasifier
Products Air
Figure 2.3. Structure of (Li et al., 2004)phenomenological model
The amount of carbon converted in pyrolysis step to methane that is not achieved in equilibrium ( ) is removed from the fraction of carbon converted into gaseous species ( ) in order to calculate the available overall fraction of carbon entering chemical equilibrium ( ). One mole of methane contains four moles of hydrogen. The available hydrogen is estimated from availability of carbon:
( ⁄ ) (28)
( ) (29)
(30)
They supposed that complete conversion for other elements in the model which introduces some prediction errors in syngas composition. The estimations of CH4 and H2O contents improved in comparison with the estimations calculated from a pure equilibrium model. Similar to results reported in previous work (Ruggiero and Manfrida, 1999), the predicted H2 component is higher than actual data. They considered this deviation to be a result of the fractional availability of water to water gas shift reaction. They mentioned that considering the unconverted carbon as a solid pure carbon is as another source of equilibrium modeling deviation, while the actual unconverted carbon stays more as coke (CHx) which decreases the availability of both carbon and hydrogen.
(Jand et al., 2006) proposed a method to improve the equilibrium modeling of high temperature biomass gasification. They considered two main stages for modeling: fast pyrolysis and methane and char gasification. To modify the underestimation of char and methane in the rigorous equilibrium model output, the carbon and hydrogen elemental balance constraint corrected as follows:
( ) (32)
( ) (33) Where
AC0: True values of the carbon in the system AH0: True values of the hydrogen in the system
AC: Corresponding corrected carbon utilized in the calculations. AH: Corresponding corrected hydrogen utilized in the calculations.
: Carbon conversion into gaseous products
: The number of moles of methane produced in the devolatilization step, per kilogram of biomass.
XC is typically in the range of 0.8-0.9 depending on the temperature, ER steam, and the gasifier type. The value of
nCH4,dev is estimated 5.5 mol/kg as a result of the (Jand et al., 2006)
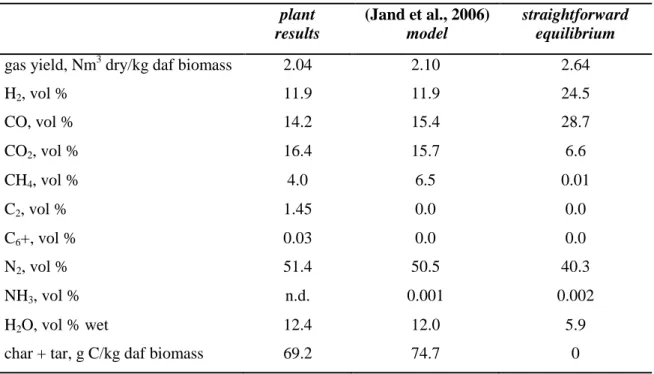
experiment for steam gasification of sawdust. They claimed that XCH4 is non-zero when a catalyst is utilized in the gasification process. In this condition, a proper approximation can be (XCH4=1/3). For active reforming catalysts, higher values (up to XCH4 = 2/3) should be considered. For air gasification, an insignificant conversion of methane (XCH4 = 1/4) can be approximated.The (Jand et al., 2006) model in comparison with (Li et al., 2004) model is more consistent with experimental data. Table 2.3 illustrates the comparison of the proposed and a base equilibrium model with one of experimental data. The results were obtained for XC = 0.85 and the methane conversion assumed to be negligible. As shown in the Table 2.3, good agreement is observed between the results from the modified model and the experimental data.
Table 2.3. Comparison between models output and experimental data at T=851˚C plant results (Jand et al., 2006) model straightforward equilibrium
gas yield, Nm3 dry/kg daf biomass 2.04 2.10 2.64
H2, vol % 11.9 11.9 24.5 CO, vol % 14.2 15.4 28.7 CO2, vol % 16.4 15.7 6.6 CH4, vol % 4.0 6.5 0.01 C2, vol % 1.45 0.0 0.0 C6+, vol % 0.03 0.0 0.0 N2, vol % 51.4 50.5 40.3 NH3, vol % n.d. 0.001 0.002 H2O, vol % wet 12.4 12.0 5.9
char + tar, g C/kg daf biomass 69.2 74.7 0
(Melgar et al., 2007) recommended an equilibrium model based on the chemical equilibrium and minimization of free Gibbs energy. They calculated the reactor temperature using energy balance equations and then estimated the output gas composition as a function of the temperature. The chemical equilibrium constants and the thermodynamic properties that are
functions of temperature were adapted in iterations of temperature calculations. They investigated the influence of two operating parameters, the relative gasifying fuel/air ratio and the biomass moisture content on the maximum temperature that can be reached.
(Jarungthammachote and Dutta, 2008) used the minimization free Gibbs energy approach to estimate the concentrations of output gas for a spouted fluidized bed biomass gasifier. They modified the equilibrium model by considering the carbon conversion in the constraints and also in the energy balance equations. The procedure for the calculation of the reaction temperature is illustrated in Figure 2.6. First, concentrations of the output gas based on the minimization of Gibbs free energy are calculated in the initial temperature. Next, the that is a negative value based on the energy balance calculation is obtained. The reaction temperature is repeatedly reduced until the becomes zero. Otherwise, the temperature is increased. Next, the composition of the produced gas is calculated and accordingly the energy balance is checked. The procedure is continued until approaches zero.
Start Input: InitialTemperature T, Chemical elements in feedstock Calculate: ni by using minimization of
Gibbs free energy
Calculate:
ΔH by using energy balance Adjusted T
Abs ΔH< 10-5 End
YES
NO
Figure 2.4. Procedure of temperature estimation, (Jarungthammachote and Dutta, 2008)
They assumed that the observed differences between the experimental and calculated data are mainly generated due to ignoring the carbon conversion. Thus, the model was modified by considering carbon conversion. The average value of 60% was considered as the carbon conversion. The modified model results showed that the concentrations of CO and CO2 are
much closer to the empirical data that those from non-modified equilibrium model. However, the overestimation of CO composition causes the higher heating value (HHV) compared to the actual HHV.
(Huang and Ramaswamy, 2009) developed an equilibrium thermodynamic model based on the stochiometric approach with and without considering char. The models were modified by fitting the methane and carbon monoxide compositions to the constant values which were determined from experimental data. They multiplied the two coefficients to the equilibrium constants of steam methane reforming reaction (Equation (17)) and water gas shift reaction (Equation (14)) reactions in order to consider fractional achievement of equilibrium for methane and carbon monoxide. The two coefficients were estimated by setting up the fractions of methane and carbon monoxide in the dry output gas in the average values computed from experimental data. The most important bottleneck of the reviewed pseudo equilibrium models is that the majority of the proposed models are attempts to improve the performance of the equilibrium modeling for particular gasification conditions. As a result, a significant lack of a comprehensive pseudo equilibrium model in literature was observed.
2.6. Devolatilization model
Considering that a devolatilization model is employed in the proposed model, in this section a brief review of devolatilization (pyrolysis) model is presented.
The goal of a devolatilization model is to estimate the yields of pyrolysis products, gas, tar, and char. A devolatilization model can be classified as basic, distributed activation energy, and structural models (Souza-Santos, 2004). Basic models are a single reaction or a combination of several reactions. The kinetic parameters (activation energy and kinetic constant) and reaction order are specified through experiments. Although, a large number of studies have been investigated to specify the kinetic parameters; a considerable deviation is observed between the parameters. The combination of series and parallels reactions (Figure 2.7) improves the modeling accuracy (Di Blasi, 2008) , (Rath et al., 2002). The most important problem in this approach is that kinetics of the reactions is not well known.
Biomass Volatiles Tar Char Gas 1 Tar 1 Gas2 Tar2 G as 2 T ar 2
Oxidation, Reforming, Cracking
Figure 2.5. Pyrolysis process
The distributed activation energy pyrolysis method expresses the activation energy by a continuous distribution function, developed by fitting empirical data of volatiles over time. This method is more applicable for complex structure such as coal (de Diego et al., 2002).
The published pyrolysis models generally estimate only the overall yields of volatile, tar, and char. To predict the yield of gas products, empirical correlations have been utilized (Hajaligol et al., 1982), (Nunn et al., 1985), (Jand and Foscolo, 2005), (Radmanesh et al., 2006). The empirical relations are function of operating conditions, type of feedstock, particle size, temperature, and heating rate. Concerning the fact that each correlation is valid for particular operating parameters and biomass feedstock, it is not applicable as a comprehensive approach. Structural model have been developed for biomass in terms of the cellulose, hemicelluloses, and lignin fractions. The overall devolatilization model is a combination of the three reference components. The model is capable to predict the yield of gas species (Ranzi et al., 2008).
2.7. Syngas cleaning
As the syngas obtained from the gasifier contains particulate, tars, alkali compounds, and other contaminants, a gas cleaning unit is generally utilized before syngas application. Particulate and
tars should be removed to avoid clogging of downstream processes. Sulfur compounds have to be removed particularly when catalysts are used in fuel synthesis applications otherwise there is the potential of catalyst poisoning or deactivation.
Physical methods such as cyclones are frequently employed to remove particulates. The particulate removal should be done before the syngas is cooled down in order to avoid tar condensation. Hot temperature metal and ceramic filters can also be applied to remove particulates.
Various techniques of tar removal have been developed (Milne and Evans, 1998). Physical removal by the use of wet scrubber is a common method to remove tar and alkali after gasification. The other techniques are catalytic or thermal conversion of tar to non-condensable gas. Sulfur in the biomass mostly forms into hydrogen sulfide (H2S) and if necessary must be removed separately.
CO2 capturing in biomass gasification process is in favor for biofuel fuel production such as hydrogen production. While, acid gas removal including CO2 capturing for integrated black liquor and coal gasification combined cycle is essentially required; for the cases which the produced syngas burned in gas turbines or in lime kilns, generally, the CO2 capturing units are not utilized.
CO2 capturing technologies can be divided in four methods: Chemical absorption
Physical absorption Solid adsorption Membrane
Membrane technology is an attractive method to capture CO2,, but it has been not employed in industrial applications yet. Solid adsorption is applicable for limited gas volumes. Chemical and physical absorption have been shown to be the appropriate approaches for industrial gasification plants. A typical absorption process is shown in Figure 2.8. First, the syngas is cooled, and then injected at the bottom of the absorber while the solvent is fed at the top of the absorber to capture CO2. The bottom stream of absorption column is heated and then sent to regeneration column to recover the solvent. Different amines formulas have been used as the chemical
solvent. Among of physical solvents, methanol and Dimethyl of polyethylene glycol are more favorable due to their chemical stability and high absorption capacity. Rectisol and Selexol physical absorption technologies which respectively utilize methanol and dimethyl polyethylene glycol as the solvents are known in gasification plants for acid gas removal. As the Rectisol technology operate at low operating temperature compared to the Selexol technology, in the most integrated gasification combined cycle processes, Selexol technology is employed for acid gas removal (Chiesa and Lozza, 1999), (Persons, 2002), (Okeefe et al., 2002), (Foster Wheel, 2003).
Figure 2.6. Typical absorption process, (Kanniche and Bouallou, 2007)
CHAPTER 3: Methodology
3.1. Main objective
The main objective of this study is to evaluate the integration of a wood biomass gasification process into a Canadian reference Kraft mill.
3.2. Specific objectives
The specific objectives of the present study include:
To develop a complete model of the gasification process that includes biomass dryer, syngas cooling and cleaning, and heat and power unit.
To assess the use of the syngas produced in biomass gasification process as an alternative fuel for firing the reference Kraft mill`s lime kiln.
To evaluate the replacement of the bark boiler in the reference Kraft mill with an integrated biomass gasification combined cycle.
3.3. Overall methodology
3.3.1. Developing a model of biomass gasification process
In order to evaluate the integration of biomass gasification into a Kraft mill, a robust model of gasification process is required. Figure 3.1 illustrates the basic process steps of an integrated biomass gasification process.
Figure 3.1. Basic process steps of an integrated biomass gasification process
In order to obtain mass and energy balances for the integration process, Aspen Plus software was used. All process steps except the gasifier model were simulated based on the commercial technologies in Aspen Plus. In the present project, the biomass dryer was simulated in Aspen Plus based on steam dryer from GEA Barr-Rosin technology. As well, the model of heat and power unit was implemented in Aspen Plus based on GE technology. Also, a modified equilibrium model for the biomass gasifier was developed in MATLAB. First of all, an equilibrium thermodynamic model based on the minimization of Gibbs free energy was generated. Then, to identify the non-equilibrium parameters, the syngas compositions from the generated equilibrium model were compared with a large number of experimental data of woody biomass gasification. Subsequently, the methane yield and carbon conversion were specified and estimated as the two non-equilibrium factors. The corresponding atoms of carbon and hydrogen are deducted from the ultimate analysis of biomass input stream and the estimated methane yield is considered as the final methane yield. The predicted syngas compositions and heating value from modified equilibrium model were evaluated by comparison with several existing commercial woody biomass gasification plants.