UNIVERSITÉ DE MONTRÉAL
MONITORING SYSTEM FOR THE ONLINE ESTIMATION OF THE
INTERNAL PARAMETERS OF A MICROBIAL FUEL CELL OPERATED
INTERMITTENTLY
JAVIER DARIO CORONADO DÉPARTEMENT DE GÉNIE CHIMIQUE ÉCOLE POLYTECHNIQUE DE MONTRÉAL
MÉMOIRE PRÉSENTÉ EN VUE DE L’OBTENTION DU DIPLÔME DE MAÎTRISE ÈS SCIENCES APPLIQUÉES
(GÉNIE CHIMIQUE) NOVEMBRE 2013
UNIVERSITÉ DE MONTRÉAL
ÉCOLE POLYTECHNIQUE DE MONTRÉAL
Ce mémoire intitulé :
MONITORING SYSTEM FOR THE ONLINE ESTIMATION OF THE INTERNAL PARAMETERS OF A MICROBIAL FUEL CELL OPERATED INTERMITTENTLY
présenté par : CORONADO Javier Dario
en vue de l’obtention du diplôme de : Maîtrise ès Sciences Appliquées a été dûment accepté par le jury d’examen constitué de :
M.SRINIVASAN Bala, Ph. D., président
M. PERRIER Michel, Ph. D., membre et directeur de recherche
M. TARTAKOVSKY Boris, Ph. D., membre et codirecteur de recherche Mme. WOODWARD Lyne, Ph. D., membre
ACKNOWLEDGEMENT
Well, when it comes down to saying thanks, I just open my heart to all those I am grateful to. I have always thought that gratefulness only achieves its real value when it is communicated from the heart. I will only translate my acknowledgement words for you, Michel and Boris. Please try the Spanish version, it is much more beautiful.
Some years ago, I had the chance to read a book in Strategy consulting that finished by giving an advice: "Wherever you go in life, always find a mentor". Recently, life gave me the chance to add 2 very special people to a very long list of very beloved mentors: Michel, and Boris. Michel: without realizing it, you brought fun to my life in a moment in which it was actually difficult to find. I will always be grateful to you for having trusted me when I most needed it. Simply, THANK YOU SO MUCH! Boris: if it was not for your advice, and respect (patience!) for my ideas (passionate, though not always structured), besides all the trust you always had in my work, half of the results in this document would have never been possible. I will always be grateful for your unconditional support.
A la hora de los agradecimientos, no suelo guardarme nada. Quizás algunos lo sepan, otros quizás no, pero soy un convencido de que la gratitud sólo alcanza su verdadera grandeza cuando se expresa de corazón. Por ello, estas palabras son para ustedes:
Hace unos años, tuve la oportunidad de leer un libro de estrategia que en su último capítulo aconsejaba: “a donde vayas, busca siempre un mentor”. Más tarde en la vida caí en cuenta que siempre he gozado de excelentes mentores. Al nacer, la vida me bendijo con los que han sido mis 2 mayores pilares: papá y mamá. A ustedes les debo todo cuanto soy. Este paso en mi vida se los comparto, como les he compartido muchos otros. Sin duda, de no ser por todo lo que ustedes me inculcaron, hoy por hoy yo no sería quien soy.
Más recientemente, la vida trajo a mí dos personas que desde ya hacen parte de esa lista de espectaculares mentores: Michel y Boris. Michel: sin saberlo, trajiste diversión a mi vida en un momento en el que me era difícil encontrarla. Siempre te estaré agradecido por haberme dado un voto de confianza cuando más lo necesitaba. Sencillamente, ¡MUCHAS GRACIAS! Boris: de no ser por tus consejos, tu respeto (¡y paciencia!) por mis ideas (apasionadas, más no siempre estructuradas), además de toda la confianza que depositaste en mi trabajo, la mitad de los
resultados en este documento no hubieran sido posibles. Siempre te estaré agradecido por todo tu apoyo incondicional.
A toda la colonia colombiana en Polytechnique (¡todos!), muchas gracias por muy agradables momentos juntos. Quebeca: si no me hubiera contigo en aquel ya lejano 2010, no hubiese caido en cuenta de que aún tenía por descubrir una de mis grandes pasiones en la vida: la ingenieria química. ¡Gracias!
Un párrafo aparte para quien ha sido mi compañero de batalla en todas éstas: ¡Chucho! Mi hermano, si no hubiera chupado de su sangre todos estos años, nada de esto sería posible. Gracias por toda su paciencia y tolerancia. Yo sé que no es fácil lidiar conmigo. Usted lo sabe… Estoy trabajando en un milagro del que usted hace parte integrante. Si mi intuición no me engaña, la vida nos depara aún muchas otras batallas de las cuales sé que habremos de salir vencedores.
Por último, más no por ello menos importante: ¡Tú! Sí… ¡Tú! ¡Ángela! Este triunfo es tan tuyo como mío… Tú eres la responsable de todos y cada uno de los anteriores párrafos. Nunca antes dediqué un documento a nadie. Bueno, ¡pues éste es para ti! No me alcanzan las palabras para darte las gracias…
RÉSUMÉ
Cette étude décrit l'opération des Piles à Combustible Microbiennes (PCMs) avec la connexion intermittente de la résistance externe (mode R-PWM). L'étude est composée de 2 sections : la première décrit l'opération de la PCM à basses et hautes fréquences, avec différents taux de connexion/déconnexion de la résistance externe. La deuxième partie rejoint le mode de fonctionnement RPWM à la solution analytique d'un Modèle de Circuit Équivalent (MCE), afin de développer une procédure de supervision en ligne. Cette stratégie rend le suivi périodique des paramètres internes de la PCM possible.
Quant à la première partie du projet, l'analyse des profils de tension acquis démontrent la présence de composants dynamiques lents et rapides. Ceux-ci peuvent être décrits par un modèle de circuit équivalent simple, qui est d'ailleurs approprié pour des applications comme la commande de procédés. Aux fréquences d'exploitation plus élevées que 100 Hz, une amélioration considérable de la performance des PCMs est observée, avec une augmentation du 22 % au 43 % de la puissance de sortie, en comparaison avec l'opération de la PCM avec sa résistance externe continuellement connectée.
Basé sur les dynamique identifiées pour la PCM à basse et haute fréquence, la solution analytique pour le modèle de circuit équivalent est ensuite utilisée comme base pour développer une stratégie de supervision en ligne. L'algorithme permet le calcul en ligne des paramètres internes de la PCM. Pour valider l'exactitude des valeurs estimées, les profils de tension électrique à bas et haute fréquence sont générés et statistiquement comparés aux profils réels de tension de la PCM. Quand les 2 profils sont comparés, des erreurs quadratiques moyenne de 5.26e-4 sont obtenues pour les profils de basse fréquence. À haute fréquence, l'erreur est 9.69e-6. Par ailleurs, les estimations en ligne des paramètres internes sont comparées à des paramètres calculés hors ligne. Les évolutions observées sont en effet semblables, même si les valeurs diffèrent.
La stratégie de supervision en ligne a été testée sous 2 conditions d'opération différentes : d'abord, une PCM a été utilisé dans pour étudier l'évolution des paramètres en réponse aux changements de la charge organique. De plus, une deuxième PCM a été construite pour faire le suivi périodique de l'évolution des paramètres internes dans le temps, du démarrage de la PCM à sa maturité.
ABSTRACT
This research study describes the operation of a Microbial Fuel Cell (MFC) under pulse-width modulated connection of the external resistor (RPWM mode). The study is composed of 2 main sections: the first one describes the MFC operation at low and high frequencies, and under varying periods of external resistance connection/disconnection or duty cycle (D). The second part blends the RPWM mode of operation to the analytical solution of a proposed Equivalent Circuit Model (ECM) in order to develop an on-line monitoring procedure. This monitoring strategy allows the periodic follow-up of the MFC internal parameters.
Regarding the first part of this project, the analysis of the output voltage profiles acquired during R-PWM tests showed the presence of slow and fast dynamic components, which can be described by a simple equivalent circuit model (ECM) suitable for process control applications. At operating frequencies above 100 Hz a noticeable improvement in MFC performance was observed with the power output increase of 22–43% as compared to MFC operation with a constant external resistance.
Based on the identified dynamics for the MFC dynamics at low and high frequency, the analytical solution for the equivalent circuit model is used as a basis for an on-line monitoring strategy. This algorithm allows the online estimation of the MFC internal parameters. To validate the accuracy of the estimations, low and high frequency voltage profiles are generated and statistically compared to actual voltage profiles for the MFC. When actual and online estimated profiles are compared, mean square errors of 5.26e-4 for low frequency profiles, and 9.69e-6 for high frequency profiles were obtained. On-line estimations of the MFC internal parameters are also compared to off-line estimated parameters, and similar evolution trends are observed.
The on-line monitoring strategy was tested under 2 different operating conditions: first, one MFC was used in under to study parameter evolution under varying organic load. Then, a second MFC was newly built in order to make a periodic follow-up of the internal parameters' evolution in time, from the MFC start-up to its maturity.
CONDENSÉ
Introduction et objectives
Les Piles à Combustible Microbiennes (PCMs) sont considérées une solution technologique prometteuse dans la recherche de nouvelles sources d'énergie renouvelables, capables de remplacer des combustibles fossiles comme source d'énergie principale des humains. En général, une pile à combustible est définie comme un dispositif électrochimique avec la capacité de convertir l'énergie chimique directement en électricité. Quoique des réactions chimiques ayant lieu dans des piles à combustible soient semblables à ceux ayant lieu dans des batteries conventionnelles, la différence principale entre ces deux vient du fait que les piles à combustible sont des systèmes ouverts où les réactifs coulent continuellement dans la pile.
Même si les PCMs ne pourront pas remplacer le pétrole dans un futur proche, leur capacité à produire de l'énergie électrique les rend un sujet de recherche intéressant. Étant un système bio-électrochimique, les PCMs ont déjà prouvé leur capacité à produire de l'électricité, ainsi qu'à traiter des eaux usées (Oh, et d'autres., 2010). C'est pourquoi, des sciences multiples se mêlent présentement dans leur étude : la microbiologie, la chimie, le génie chimique, le génie électrique, le génie civil, ainsi que les sciences des matériaux sont en fait le cas. Néanmoins, un des plus grands défis scientifiques est toujours lié à la modélisation et au contrôle, étant donné la nature toujours changeante des systèmes vivants.
Ce document présente alors les résultats obtenus du projet de recherche visant à développer un outil de supervision en temps réel pour l'analyse en ligne de la performance électrique d'une Pile à Combustible Microbienne opérée de façon intermittente. Afin d'atteindre cet objectif, deux tâches principales sont exécutées:
1. la caractérisation de la performance électrique de PCMs opérées de façon intermittente en fonction de la fréquence d'opération et du ratio de connexion/déconnexion de la résistance externe, et
2. le développement d'un outil de supervision en ligne pour évaluer les paramètres internes électriques d'une PCM modélisée à partir d'un modèle de circuit équivalent (MCE) simplifié.
Mode R-PWM et caractérisation en fréquence
Afin d'évaluer l'effet de la connexion intermittente de la résistance externe (mode d'opération R-PWM), deux (2) PCMs ont été opérées à plusieurs fréquences dans une plage entre 0.1 Hz et 1000 Hz. À chaque fréquence testée, Rext est connectée à la PCM pendant la première
moitié du cycle et débranché pour le reste du cycle. Ces tests ont été effectués pour des valeurs de
Rext entre 8 et 47 ohms. La tension moyenne a augmenté avec l'augmentation de fréquence,
ensuite un plateau est atteint à peu près entre 100 et 500 Hz.
Aux fréquences d'exploitation plus élevées que 100 Hz, une amélioration considérable de la performance des PCMs est observée, avec une augmentation du 22 % au 43 % de la puissance de sortie, en comparaison avec l'opération de la PCM avec sa résistance externe continuellement connectée.
MCE et les dynamiques à basse et haute fréquence
À basse fréquence (~0.05 Hz) deux composants dynamiques différents sont remarqués lors de la connexion intermittente de la résistance externe. D'abord, il y a un changement soudain de la tension de sortie de la PCM, jusqu'à atteindre d'une certaine valeur intermédiaire. Cette transition rapide est suivie par une courbe exponentielle, qui s'approche de la valeur stationnaire à un taux beaucoup plus lent.
Par contre à haute fréquence (~100 Hz), seulement la dynamique rapide apparaît dans le profil de tension de la PCM, alors que la dynamique lente disparaît et le voltage semble essentiellement commuter entre deux niveaux. La tension la plus haute correspond à l'état de circuit ouvert (résistance externe déconnectée). D'autre côté, la tension la plus basse correspond à l'état de circuit fermé (résistance externe connectée). Ces deux (2) dynamiques peuvent être décrites par un modèle de circuit équivalent (Randles le modèle, (Randles, 1947)). Ce modèle consiste de deux résistances et une capacitance, qui permet la description des réponses de tension de sortie lentes et rapides observées pendant les tests. Pour le modèle montré dans la ¡Error! No
se encuentra el origen de la referencia. de ce document, correspond à la tension de circuit
ouverte de la PCM (tension idéale), C représente la capacitance réelle de la MFC, R1 représente
les pertes ohmiques, alors que R2 représente les pertes par activation et par concentration de la
Le MCE et la stratégie de supervision en ligne
Généralement, les propriétés électriques de systèmes bio-électrochimiques sont mesurées au moyen des méthodes électrochimiques hors connexion comme des courbes de polarisation ou avec des voltamètres cycliques. Bien que ces méthodes fournissent des mesures précises pour des paramètres électriques comme la résistance interne et la capacitance, ils exigent que le système soit pris hors ligne pour la mesure pour être précis.
Dans le but de pouvoir appliquer les principes de commande de procédé à l'amélioration de la performance des PCMs, il est nécessaire d'avoir des outils permettant le suivi en ligne des paramètres internes des PCMs. La stratégie de supervision proposée dans ce projet de recherche est basée tant sur la solution analytique du modèle de circuit équivalent étudié (MCE), que sur les profils à bas et haute fréquence retrouvés lors de l'opération intermittente de la PCM.
La stratégie de supervision en ligne a été testée pour deux (2) conditions d'opération différentes : d'abord, l'évolution des paramètres en réponse aux changements de la charge organique a été étudié. Ensuite, l'évolution des paramètres internes dans le temps est étudiée, en suivant le comportement dynamique d'une PCM du démarrage à sa maturité.
L'algorithme permet en effet le calcul en ligne des paramètres internes de la PCM. Pour valider l'exactitude des valeurs estimées, les profils de tension électrique à bas et haute fréquence sont générés et statistiquement comparés aux profils réels de tension de la PCM. Quand les 2 profils sont comparés, des erreurs quadratiques moyenne de 5.26e-4 sont obtenues pour les profils de basse fréquence. À haute fréquence, l'erreur est 9.69e-6. Par ailleurs, les estimations en ligne des paramètres internes sont comparées à des paramètres calculés hors ligne.
TABLE OF CONTENTS
ACKNOWLEDGEMENT ... III RÉSUMÉ ... V ABSTRACT ... VI CONDENSÉ ...VII TABLE OF CONTENTS ... X LIST OF TABLES ... XIII LIST OF FIGURES ... XIV LIST OF ABBREVIATIONS ... XVICHAPTER 1 INTRODUCTION ... 1
1.1 Problem Definition ... 2
1.1.1 Microbial Fuel Cells ... 2
1.1.2 Microbial Fuel Cells and Water Treatment ... 3
1.1.3 Dynamic Systems, Process Control and Frequency Analysis ... 3
1.1.4 Pulse Width Modulation (PWM) and Power Control ... 4
1.2 Project Objectives ... 4
1.3 Document Structure ... 5
CHAPTER 2 LITERATURE REVIEW ... 6
2.1 Biochemical Processes: an overview ... 6
2.2 Microbial Fuel Cells Modeling: from Microbiology to Process Dynamics ... 7
2.3 Microbial Fuel Cells: Performance Optimization, Energy Storage, and Control ... 7
2.3.1 Performance optimization ... 8
2.3.2 Energy Harvesting and Storage ... 8
CHAPTER 3 MATERIALS AND METHODS ... 12
3.1 MFC design, inoculation, and operation ... 12
3.2 External resistance connection (R-PWM Mode of Operation) ... 13
3.3 Frequency and Duty Cycle Tests ... 14
3.4 Perturbation/Observation algorithm ... 15
3.5 Numerical methods ... 15
CHAPTER 4 MFC OPERATION WITH PULSE-WIDTH MODULATED CONNECTION OF REXT 16 4.1 Frequency Characterisation of MFCs ... 16
4.2 Dynamic Response of MFCs at Low and High Frequency ... 17
4.3 The Equivalent Circuit Model Explained ... 19
4.3.1 The High Frequency Profile ... 20
4.3.2 Power Analysis for High Frequency Operation ... 21
4.3.3 The Low Frequency Profile ... 22
4.4 The Proposed Equivalent Circuit as a Modeling Tool for MFCs ... 22
4.5 Duty Cycle (D) Characterisation of the MFCs ... 23
CHAPTER 5 ECM APPLICATION FOR ONLINE MONITORING AND PARAMETER ESTIMATION OF A MFC ... 28
5.1 Monitoring Procedure: from Electrical Modeling to Online Monitoring Tool ... 28
5.2 Parameter Estimation and Online Monitoring Tests ... 30
5.2.1 MFC Internal Parameters Variation as a Function of Organic Load ... 30
5.2.2 MFC Internal Parameters Variation as a Function of Time ... 37
CHAPTER 6 CONCLUSION AND RECOMMENDATIONS ... 43
6.1 Conclusions ... 43
6.2.1 Characterisation of MFC performance under a wider range of frequencies ... 44
6.2.2 The online monitoring strategy as a sensor for process control ... 44
A personal quote ... 45
BIBLIOGRAPHY ... 46
LIST OF TABLES
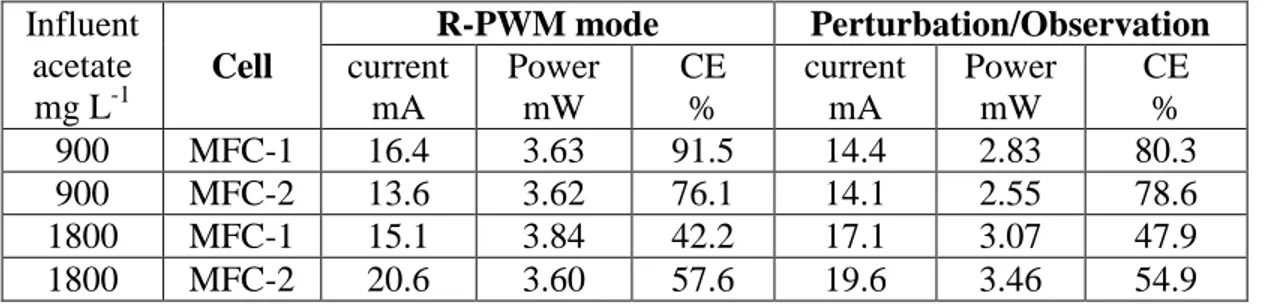
Table 1 A comparison of average currents, power outputs and Coulombic Efficiencies (CE) obtained during - PWM and Perturbation/Observation tests carried out at two influent
acetate concentrations. ... 25
Table 2 Mean Square Errors for UMFC estimated profiles at different organic loads ... 32
Table 3 Summary of Standard Deviations for Online and Offline Estimations... 37
Table 4 Mean Square Errors for UMFC estimated profiles during organic maturation of MFC ... 39
LIST OF FIGURES
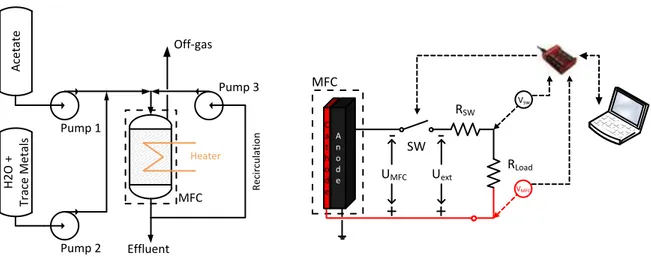
Figure 1. Schematic diagrams: (A) experimental setup, and (B) electrical circuit used in all tests.
... 13
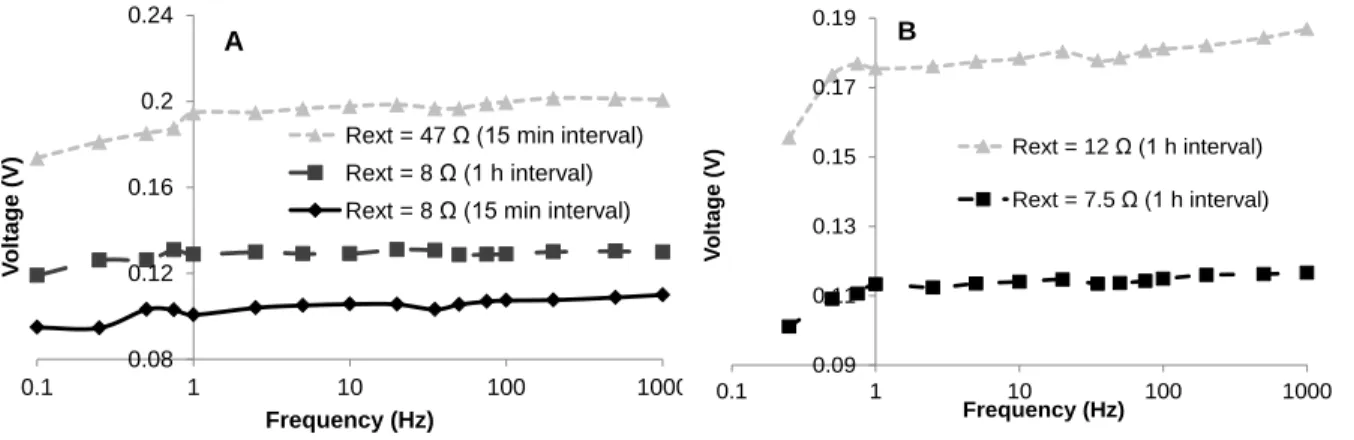
Figure 2. Average external voltage ( ) as a function of Rext connection / disconnection frequency. A – MFC-1 tests with 15 min and 1 h intervals between frequency changes; B – MFC-2 tests performed with frequency changes at 1 h intervals. ... 16
Figure 3. Profiles of MFC voltage ( ) measured at connection / disconnection frequencies of (A) 0.05 Hz (D=75%) and (B) 100 Hz (D=90%). ... 17
Figure 4. MFC Equivalent Circuit Model (ECM) ... 19
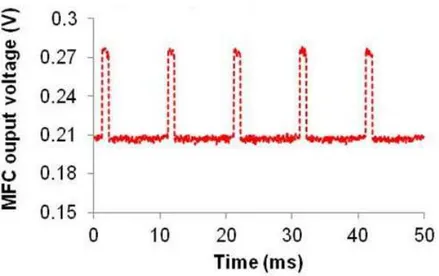
Figure 5. High frequency profile of a MFC operated under R-PWM mode ... 21
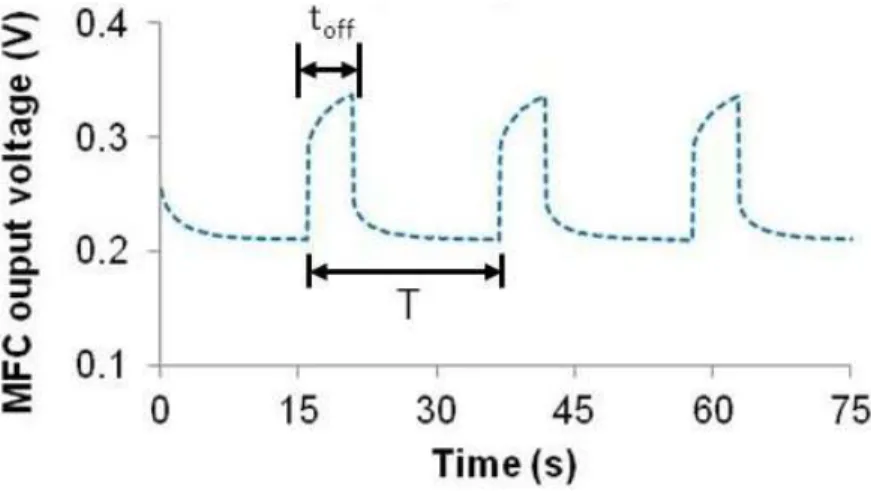
Figure 6. Voltage profile for a MFC operated at low frequency ... 22
Figure 7. MFC Power outputs of MFC-1 (A) and MFC-2 (B) as a function of their duty cycles. Power output at D=100% corresponds to MFC operation with fixed external resistance. All D-tests were carried out at a frequency of 500 Hz. ... 24
Figure 8. UMFC profile at low frequency operation ... 29
Figure 9 Flow rates of acetate stock solution ... 31
Figure 10 UMFC voltage profiles at nominal or higher influent concentration (≥ 900 mg L-1)... 32
Figure 11 UMFC voltage profiles at low influent concentration (450 mg L-1) ... 33
Figure 12 Results for on-line and off-line estimation of R1 ... 34
Figure 13 Results for on-line and off-line estimation of R2 ... 34
Figure 14 Comparison of Rint estimations (on-line and off-line) with experimentally measured values based on polarization tests. ... 35
Figure 15 Results of on-line and off-line estimation of Uoc. ... 36
Figure 16 Results of online and offline estimation of C. ... 37
Figure 18 UMFC voltage profiles 1 week after the MFC start-up. ... 38
Figure 19 UMFC voltage profiles 20 days after the MFC start-up. ... 39
Figure 20 R1 and R2 evolution in time. ... 40
Figure 21 Rint evolution in time. ... 41
Figure 22 UOC evolution in time. ... 41
LIST OF ABBREVIATIONS
D Duty Cycle
DC Direct Current
ECM Equivalent Circuit Model MCE Model de Circuit Équivalent MSE Mean Square Error
MFC Microbial Fuel Cell
MPPT Multi-unit Maximum Power Point Tracking PCM Pile à Combustible Microbienne
P/O Perturbation / Observation Algorithm PWM Pulse Width Modulation
CHAPTER 1 INTRODUCTION
Just like every living form on Earth, human beings are constantly changing. That is why, evolving has always been deep in our nature. Nevertheless, growth transitions, like adolescence, often cause problems to humans. Adaptive behavior is needed in order to catch up with new circumstances. Moments of transition always represent great challenges for human's creativity and adaptability. Nowadays, humanity is hugely concerned by a great moment of transition that challenges our scientific and technological knowledge. Maybe for the very first time in our young history, the challenge embraces human's capacity to sustainably live in a society.
Human's need for sustainable development imperatively demands: 1) the change of our highly non-renewable and contaminating energy sources by renewable ones; 2) the optimization of wastewater treatment procedures, as well as 3) the efficiency improvement of the energy recovery techniques currently in use in industry. Beautifully, the challenge has not only attracted the attention of scientists around the world, but it has been the main reason for multiple television series and science fiction films for the last two decades. AVATAR, IRON MAN, BATMAN or PRISON BREAK are just a small proof of it.
Microbial Fuel Cells (MFCs) are considered a promising technological solution that could help tackling the challenges previously mentioned. Even though MFCs are not yet considered an energy source capable of replacing petroleum based fuels in a foreseeable future, their capacity for electrical energy recovery make them an interesting subject for research. As a bio-electrochemical system, MFCs have already proven their capacity to generate electricity while biochemically treating wastewater (Oh, et al., 2010). Hence, multiple sciences have merged in their study: microbiology, chemistry, chemical, civil, and electrical engineering, as well as material science. Nonetheless, one of the biggest scientific challenges is always tied to the modeling and control of the continually changing nature of the oxidation-reduction reactions taking place in the bioreactors.
For the case of study described in this document, chemical and electrical engineering gather together once again in the quest for a beautiful goal: modeling, optimizing and controlling MFCs. This fusion have proven extraordinary results for science in the past, giving even birth to heat transfer modeling by means of basic first order electrical circuits (Bergman, Lavine, Incropera, & Dewitt, 2012). So, just as heat exchangers were initially studied using electrical
models to later become a major energy recovery tool in industrial process plants, electrical circuits are currently used as a modeling tool in the research to attain a major understanding of inherently living systems such as the MFCs.
Therefore, the research presented in this document looks forward to improving human's understanding of MFCs by using some engineering tools to study them, while improving their performance. For sure, MFCs are foreseen as a feasible technology for electrical energy recovery in the search for reducing electrical energy consumption in wastewater treatment plants. Power efficiency improvement has become a common issue in current research studies.
Hereafter, some major concepts are presented. These represent the major scientific framework inside which this research has been developed. Besides, they create a technical framework prior to introducing the main objectives of this research project.
1.1 Problem Definition
1.1.1 Microbial Fuel Cells
In general, a fuel cell is defined as an electrochemical device with the capacity to directly convert chemical energy into electricity. Though chemical reactions taking place in fuel cells are similar to those occurring in conventional batteries, the main difference between these two arises from the fact that fuel cells are open systems where reactants are continually flowing into the cell. Oxidation-Reduction reactions take place in fuel cells. Oxidation takes place at the anode, known by convention as the negative electrode, while reduction takes place at the cathode, the positive electrode. When reaction takes place, electrons are liberated, allowing current to flow between both electrodes. To foster ion exchange, the electrodes are commonly placed in an electrolyte solution.
In the particular case of MFCs, electricigenic microorganisms work as the catalysers of the bio-electrochemical reaction. Wastewater containing dissolved organic matter may be used as fuel for the cell. The organic matter is degraded by these microorganisms, which need this material for their biological cycle that comprises their metabolism, growth and reproduction.
1.1.2 Microbial Fuel Cells and Water Treatment
MFCs are a new type of bioreactors with a proven capacity for treating a large variety of highly diluted organic matter while producing electricity (Logan & Regan, 2006); (Debabov, 2008).
In general, MFCs are composed of two chambers: the anaerobic anode, and the aerobic cathode. These two are separated by an ion conducting membrane. Anaerobic respiring bacteria attached to the anode work as catalysers, while oxidizing organic matter and producing both protons and electrons. The electrons are transferred to the anode, where they subsequently pass through an external electrical circuit to produce current. Protons migrate through the membrane to the cathode, where they react with oxygen to produce water.
Research on MFCs may be divided into three main areas (Oh, et al., 2010):
1) the reactor design in order to reduce unwanted biomass production in wastewater treatment,
2) the study of the microbial communities participating in the bio-electrochemical process, and
3) modeling, control and optimization of operating conditions.
One of the main goals of applying control and optimization techniques is the enhancement of MFCs low power density (Logan, et al., 2006).
1.1.3 Dynamic Systems, Process Control and Frequency Analysis
Systems in engineering are studied in two different ways: dynamically and statically. Dynamic models comprise both transient and steady state responses, while static systems are commonly studied in order to identify the steady state response of a given system. Dynamic models are commonly represented by differential equations in a time based space, while different frequency space transformations (Fourier, Laplace, etc.) are highly used in order to make stability analysis in a frequency based space.
Commonly, when a dynamic model is achievable, control laws are established in order to improve the performance of the system. In the case of biochemical systems, as it is the case for MFCs, models are difficult to develop due to their highly non-linear time variant inherent characteristic.
In the case of MFCs, electrical studies have been carried out neglecting fast dynamics related to electrical properties of the MFCs (Aelterman, Versichele, Marzorati, Boon, & & Verstraete, 2008); (Woodward, Perrier, Srinivasan, & Tartakovsky, 2009)). These research studies model MFCs as electrical systems by means of exclusively resistive circuits. More recently, MFCs electrical dynamics has been paired to first order circuits (Yang, Zhang, Shimotori, Wang, & Huang, 2012). Furthermore, periodic operation of MFCs is currently being studied in order to improve MFCs power generation capacity, as well as for modelling their transient response (Grondin, Perrier, & Tartakovsky, 2012); (Coronado, Perrier, & Tartakovsky, 2013).
When dynamic systems are modeled, low and high frequency analysis become very useful as a stability analysis and modeling tool. Besides, frequency based methods make it possible to accurately establish the frequency response of electrically modeled systems. Different frequency-based methods used in process control comprise: bode diagrams, root-locus representation, and Nyquist stability analysis, among others.
1.1.4 Pulse Width Modulation (PWM) and Power Control
Pulse Width Modulation (PWM) is a control technique commonly used for power control in power electronic applications. In these applications, the average power to a load is controlled by commuting on and off an electronic power switching device. As voltage (and current) coming out of the power source are modulated (switched 'on' and 'off'), power is controlled so maximum power feed may be achieved, subsequently optimizing the energy furnished to the attached load.
Duty cycle (D) corresponds to the portion of 'on' time to the period of time. It is commonly expressed in percent. Generally, low power corresponds to a low duty cycle, while 100% means that the circuit is always 'on'. PWM is a well-known electrical control technique already under study on MFCs, mainly looking forward to enhancing the system's energy storage capacity (Wu, Biffinger, Fitzgerald, & Ringeisen, 2011).
1.2 Project Objectives
General Objective: To develop a real-time process monitoring tool for the on-line analysis of the electrical power performance of a Microbial Fuel Cell operated intermittently.
Specific Objectives:
1) Characterize the performance of a MFC operated intermittently as a function of the external resistance connection/disconnection rate (variable frequency and duty cycle). 2) Develop an on-line monitoring tool for estimating electrical internal parameters of a MFC
modeled using a simplified equivalent circuit model (ECM).
1.3 Document Structure
After presentation the literature review and the material and methods that give a frame to this project, the main research results are presented in chapters 4 and 5.
Chapter 4 mainly explains the proposed method of operation for the MFC (R-PWM). Two main studies are presented: the characterisation of MFC power performance to an intermittent operation at low and high frequencies, as well as the MFC power performance in response to varying period of connection or duty cycle (D). Besides, the Equivalent Circuit Model (ECM) is first explained, creating the links between this model and the MFC operation at low and high frequencies.
Chapter 5 describes the way in which the analytical solution of the ECM is used in order to achieve an on-line monitoring and parameter estimation algorithm. The results for 2 different experiences are presented. First, the on-line monitoring strategy is used to make the follow-up of MFC internal parameters while organic load is periodically varied. Second, a MFC was newly built and followed-up by means of the propose on-line parameter estimation procedure. The evolution of parameters in time is then evaluated.
Finally, the conclusions to the study presented in this document are mainly focused on the results presented in Chapters 4, and 5.
CHAPTER 2 LITERATURE REVIEW
This literature review is composed of three main sections. The first one makes a brief overview of the principles of biochemical processes. Then, the second section describes how modeling of MFCs has evolved in time, while the last section summarizes some state-of-the-art studies on MFCs optimization and control.
1.4 Biochemical Processes: an overview
Basically, a biochemical process is focused on the growth of certain type of microorganism. In order for a microorganism to grow, nutrients must be fed at favourable environmental conditions (temperature, pH, etc.). Hence, while the biochemical process takes place, a carbon source (substrate) is consumed in order to produce such products as oils, cheeses, enzymes, amino acids, ethanol or biogas, among others, depending on the main interest of the corresponding industry.
Modeling a biochemical system is a critical stage prior to its optimization and control. A biochemical reaction scheme is initially established in order to describe the biological and chemical reactions that take place in the bioreactor. Reactions belonging to the reaction scheme may include: microorganisms' growth, product generation, and microorganisms' mortality. Schemes are normally completed (Bastin, et al., 2001) by including the reactions' rates and the consumption yields. Reaction kinetics are often modelled by means of a Monod model, which is based on the Michaelis-Menten reaction kinetics (Eddy, 2003).
Reaction's schemes are completed with mass and energy balances. In fact, these schemes make it possible to establish dynamical models for the biochemical system. Mass balances are highly dependent on the type of reactor used (batch, fed batch or continuous stirring tank reactor (CSTR)). Balances are normally expressed as a function of different variables (substrates, products or biomasses) that describe the dynamics of the system. Finally, reaction rates are expressed as a function of the chosen variables for simulation, control or optimization purposes.
1.5 Microbial Fuel Cells Modeling: from Microbiology to Process Dynamics
Microbial fuel cells (MFCs) are based on biochemical processes in which electricity is a final product for the reacting system (scheme). The main challenge arising while modeling MFCs is the adequate interpretation of the narrow relationship between microbial growth and metabolism, and electricity generation and performance.Although MFCs were initially modeled as one-population microbial systems, (Zhang & Halme, 1995); (Marcus, Torres, & Rittmann, 2007)), more recent studies (Picioreanu, Katuri, Head, Van Loosdrecht, & Scott, 2008) proved the need for multi-population biological models in order to accurately understand the biological behaviour inside the bioreactors used for MFCs' applications. Nonetheless, the complexity associated with multi-population models makes necessary to design simplified models for control and optimization purposes.
A simplified two-population bio-electrochemical model was proposed by Pinto et al., (Pinto R. P., Srinivasan, Manuel,, & Tartakovsky, 2010.) for off-line process optimization. The proposed model describes the competition of two types of microbial populations for a common substrate in a MFC: anodophilic and methanogenic bacteria. By means of multiplicative (double-Monod) models (Bae & Rittmann, 1996a), and Nernst based equations ("Fuel Cell Handbook," 2005), the model proposes a dependence of electrical parameters on anodophilic biomass density, besides proving the influence of organic load and external resistance on power output and long-term performance.
1.6 Microbial Fuel Cells: Performance Optimization, Energy Storage, and
Control
Given their low power density (Logan, et al., 2006), researchers currently dedicate their research work to the development of optimization strategies allowing to increase their capacity for electrical energy production
1.6.1 Performance optimization
Different approaches are used in order to improve MFCs' performance. Some of them are related to Material Science and focus on improving bioreactor's performance. Some others seek a deeper understanding of the bio-electrochemical behaviour of the dynamic system.
A recent study aimed at improving bioreactor's performance demonstrates that using extended longitudinal tubular MFCs reactors may increase power recovery and organic removal efficiency (Kim, et al., 2011). Moreover, in (Saito, et al., 2011), the effect of carbon clothes anodes modified with 4(N,N-dimethylamino)benzene diazonium tetrafluoroborate over MFCs' performance is proved by demonstrating that the lowest the amount of nitrogen source in the anode, the highest maximum power density may then be achieved.
Aelterman et al., (Aelterman, Rabaey, Pham, Boon, & Verstraete, 2006) developed some tests with stacked microbial fuel cells in order to improve continuous electricity generation at high voltages and currents. The study proves the capacity of their approach to increase the values of both voltage and current, noting that microbial communities concentration are affected by the biological and electrochemical interactions between MFCs.
Moreover, substrate consumption has been optimized by means of staging strategies. A reactors-in-series approach (staging) (Pinto, Tartakovsky, Perrier, & Srinivasan, 2010) has already been proven to optimize substrate consumption in a MFC. The staging strategy was used to resemble CSTRs in series to Plug Flow Reactors (PFRs) dynamics. From the point of view of influent treatment performance, connection in series proved to have better treatment capacities than the connection in parallel.
1.6.2 Energy Harvesting and Storage
Electrical energy storage is also of great interest for researchers. In order for MFCs to be able to feed electrical energy to actual electrical loads, it is necessary to increase their capacity for electricity generation. To do so, (Dewan, Donovan, Heo, & Beyenal, 2010) have already developed a Microbial Fuel Cell tester with the capacity to calculate the power of the MFC as a function of the time needed to charge an external capacitance that harvests the power supplied by
the MFC. Power is optimized by varying the capacitor value and the charging and discharging potentials.
The principles of electrical power switching supplies are also currently under study looking forward to improving the energy storage capacity of stacked MFCs. Wu et al,. (Wu, Biffinger, Fitzgerald, & Ringeisen, 2011) designed a DC/DC booster circuit in order to increase a typical operational voltage to produce a maximum output power. Values for the DC/DC circuit are optimized using a proposed procedure while power consumed by the circuit was reduced to a minimum.
Similarly, Yang et al. (Yang, Zhang, Shimotori, Wang, & Huang, 2012) used a Power Management System (PMS) in order to improve a MFC's energy harvesting capacity. Super capacitors' impedance were optimized for maximum average harvested power, while a circuit composed of a transformer and a DC/DC boost converter is designed to increase both voltage and current supplied to an electrical non-resistive load. The transformer-based PMS network designed by Yang et al. works at a lower voltage that other MFC PMS designs.
The internal equivalent circuit model used by Yang et al. (Yang, Zhang, Shimotori, Wang, & Huang, 2012) is identical to that used by Grondin et al. (Grondin, Perrier, & Tartakovsky, 2012), though for different research purposes, following different approaches for the calculation of the MFC internal current.
1.6.3 Control and Optimization
Control theory is originally based on human's will to control and regulate systems just as the human body biologically regulates itself. However, two major restrictions arise on bioprocesses control and optimization (Bastin, et al., 2001):
1) the living nature of bioprocesses makes them difficult to model by means of already highly developed scientific methods, and
2) the unavailability of sensors for the continuous measurement of variables such as biomass, substrate, or product concentration.
Despite this, control and optimization techniques are broadly considered in the research for strategies that give scientists a further understanding of MFCs as a bio-electrochemical system. Both of them combined have extensively proven their capacity to identify system's parameters by using advanced well-known mathematical methods, what makes them highly attractive for the characterization and optimization of MFCs. Some state-of-the art studies are presented hereafter.
While varying electrical load (impedance) attached to an MFC, Premier et al., (Premier, Rae Kim, Michie, Dinsdale, & Guwy, 2011) proved that the automatic control of the load helps increasing both the MFCs' power and efficiency. When comparing the results of automatically changing the load to those obtained while letting the load fixed, an improvement of 19.73% in the MFC's electrical power performance is obtained. Both experiences were executed for MFCs operating at the same organic load.
Woodward et al., (Woodward, Perrier, Srinivasan, & Tartakovsky, Maximizing Power Production in a Stack of Microbial Fuel Cells Using Multiunit Optimization Method, 2009) developed a Multi-unit Maximum Power Point Tracking (MPPT) algorithm that calculates the gradient using outputs of two identical MFCs. The MFCs are operated at different resistive loads and the power difference between them indicates the direction the gradient should follow. Although the Achilles' heel of the proposed method arises at stating that both MFCs as identical, Woodward et al., (Woodward, Perrier, & Srinivasan, Comparison of Real-Time Methods for Maximizing Power Output in Microbial Fuel Cells, 2010) proved that this method converges faster than a perturbation-observation (P/O) algorithm, which varies the value of the controlled variable in order to establish the optimal operating point.
Furthermore, Degrenne et al., (Degrenne, Buret, Allard, Bevilacqua, & P., 2012) operated ten identical single-chamber 1.3L MFCs following a MPPT algorithm to control an electrical converter in order to improving global MFC performance. Their MPPT algorithm mainly consisted of the regulation of the MFC voltage to one-third of the open circuit value. The results obtained for power output following the proposed method were quite similar to those obtained when using a (P/O) algorithm.
Recently, external electrical circuits optimization is increasingly being used for MFC's research. Park et al. (Park & Ren, Hysteresis controller based maximum power point tracking
energy harvesting system for microbial fuel cells, 2012) developed a hysteresis controller based MFC energy harvesting system. For this case study, both an energy harvesting network and a voltage boost converter were conceived. The proposed MPPT algorithm uses potentiometers for the hysteresis controller. Their strategy eliminates the need for external resistances and enables simultaneous maximum power point tracking and maximum MFC energy harvest in real-time.
Electrical circuit modeling is another strategy increasingly being studied in order to complete the highly complex multi-population models of the MFCs. Besides estimating internal parameters of an internal equivalent circuit model proposed, Grondin et al. (Grondin, Perrier, & Tartakovsky, 2012) use the duty cycle principle in order to optimize power output to a fixed resistive load.
The proposed method makes a duty cycle control based on voltage measurements for minimum and maximum output voltages. It was proven that power output may be maximized both under limiting or non-limiting organic load conditions, without changing the value of the external resistance, just by intermittently connecting the electrical load based on established voltage thresholds. This system achieved maximum power output at different duty cycle values, while the value of the external resistive load was changed.
Another duty cycle analysis over a MFC was made by Wu et al. (Wu, Biffinger, Fitzgerald, & Ringeisen, 2011). In this case, a duty cycle and a frequency analysis were made over a DC/DC booster circuit connected to the studied MFC. The frequency analysis was made from 10 to 50 kHz in order to establish the frequency at which maximum output power is achieved from 3 stacked mini-MFCs connected in parallel. In the case of study of Grondin et al. (Grondin, Perrier, & Tartakovsky, 2012), no frequency analysis is described, though frequencies used are .
CHAPTER 3 MATERIALS AND METHODS
1.7 MFC design, inoculation, and operation
Two membrane-less air-cathode MFCs were constructed using nylon plates as described elsewhere (Grondin et al. 2012). The anodes were 5 mm thick carbon felts measuring 10 cm × 5 cm (SGL Canada, Kitchener, ON, Canada) and the cathodes were 10 cm x 5 cm manganese - based catalyzed carbon E4 air cathodes (Electric Fuel Ltd, Bet Shemesh, Israel). The electrodes were separated by a nylon cloth. Two MFCs, MFC-1 and MFC-2, were built. Both MFCs had an anodic compartment volume of 50 mL. MFC-1 contained two 10 cm x 5 cm carbon felt anodes with a total thickness of 10 mm and two cathodes (one on each side connected by a wire) with a total surface area of 100 cm2. MFC-2 had one 10 cm x 5 cm carbon felt anode with a thickness of 5 mm and one 50 cm2 cathode.
Each MFC was inoculated with 5 mL of anaerobic sludge with volatile suspended solids (VSS) content of approximately 40-50 g L-1 (Lassonde Inc, Rougemont, QC, Canada) and 20 mL of effluent from (Pinto R. , Srinivasan, Guiot, & Tartakovsky, 2011a)an operating MFC. The MFCs were maintained at 25ºC and were continuously fed with sodium acetate and trace metal solutions using a syringe pump and a peristaltic pump, respectively. The acetate stock solution was composed of (in g L-1): sodium acetate (37.0), yeast extract (0.8), NH4Cl (18.7), KCl (148.1),
K2HPO4 (64.0), and KH2PO4 (40.7). The infusion rate of the acetate stock solution was varied in
order to obtain the desired influent concentration. The trace metal solution was prepared by adding one mL of the trace elements stock solution to 1 L of deionised water. A detailed composition of the stock solution of the trace elements is given elsewhere (Pinto R. , Srinivasan, Guiot, & Tartakovsky, 2011a).
Figure 1. Schematic diagrams: (A) experimental setup, and (B) electrical circuit used in all tests. An influent acetate concentration of 900 mg L-1 and a hydraulic retention time of 6-7 h were typically maintained, with an exception of the high and low-load tests, where the influent acetate concentration was varied. For organic load characterisation purposes, 4 different organic loads were used : 450 mg L-1, 900 mg L-1, 1350 mg L-1, and 1800 mg L-1. The mathematical calculation of acetate flow rates from these organic loads is later explained in this document. Figure 1A shows the schematic diagram of the experimental setup, while a detailed description of MFC design, stock solution composition, and operating conditions can be found elsewhere (Grondin, Perrier, & Tartakovsky, 2012).
1.8 External resistance connection (R-PWM Mode of Operation)
Pulse-width modulated connection of the external resistor (Rext) to MFC terminals was
achieved by adding an electronic switch (IRF540, International Rectifier, El Sequndo, CA, USA) to the external electrical circuit (denoted as SW in Figure 1B, the corresponding resistance is shown as RSW). The switch was computer-controlled using a Labjack U3-LV data acquisition
board (LabJack Corp., Lakewood, CO, USA). The data acquisition board was also used to record MFC voltage at a maximum rate of 22,500 scans/s.
Pump 1 Pump 2 Heater Off-gas Pump 3 MFC Effluent R ec ir cu la ti o n H 2 O + Tr ac e M et al s A ce ta te RLoad C a t h o d e A n o d e SW
-+
UMFC-+
Uext VMFC Vsw MFC RSWAs shown in Figure 1B, the data acquisition board measured MFC output voltage (UMFC)
and voltage after the switch (Usw). Electrical connections corresponding to these measurements
are shown in Figure 1B as VMFC and VSW, respectively. Voltage over the resistive load (ULoad)
was calculated as the difference between UMFC and Usw (ULoad = UMFC – Usw). Electric current
was calculated as I = ULoad / RLoad by applying Ohm's law over the external load resistance
(RLoad).
For calculation purposes, the switching device was considered as an ideal switch in series with a resistance Rsw to represent power losses in the switch. Rsw value was estimated by dividing
the voltage over the switch by the current. In the following discussion, Rext denotes the sum of the
external load connected to the circuit and the switch resistance (Rext = RLoad + Rsw) with a
corresponding external voltage Uext, as follows from the diagram shown in Figure 1B. The
voltage measurements described above and the calculation method accounted for power losses due to the fast switching.
1.9 Frequency and Duty Cycle Tests
Frequency and duty cycle tests were carried out with either 15 min or 1 h intervals between parameter changes. The tests were performed in a broad range of frequencies from 0.1 Hz to 1000 Hz. Duty cycle was set to 50% when frequency tests were carried out. For the duty cycle analysis, duty cycles were varied between 5% and 100% at a constant frequency of 500 Hz. Between the R-PWM tests, the MFCs were operated using the Perturbation/Observation algorithm described below.
MFC performance was expressed in terms of average (per cycle) output voltage, current, and power output. Average values per cycle were obtained as follows:
(1)
Where m(t) is either the voltage, current, or power measurements at each moment of time
t, T is the cycle duration, and is the corresponding average value. Integrals were numerically
calculated. To reduce errors due to sampling noise at least 100 average (per cycle) values were acquired and then the mean values were calculated.
1.10 Perturbation/Observation algorithm
The perturbation observation (P/O) algorithm for maximum power point tracking (MPPT) was used to optimize MFC performance during the tests with a fixed external resistor (control tests) and between frequency and duty cycle tests. At each iteration, the P/O algorithm modified
Rext (digital potentiometer) with a predetermined amplitude (∆R) at each iteration. The direction
of resistance change was selected by comparing the value of the power output with that at the previous resistance. Once the algorithm converges to a vicinity of the optimum resistance value, the Rext will oscillate around this optimum with a maximum distance of ∆R. A
computer-controlled digital potentiometer with a resistance variation range from 4 to 130 Ω and a step of 1.25 Ω was used (Innoray Inc, Montreal, QC, Canada). A detailed description of the P/O algorithm can be found in (Woodward, Perrier, & Srinivasan, 2010).
1.11 Numerical methods
Computer simulations were carried out using the equivalent circuit model and model solutions described in this document. Parameter estimation was carried out using Fmincon function of
Matlab R2010a (Mathworks, Natick, MA, USA). In the parameter estimation procedure the root
mean square error (RMSE) between the model outputs and measured values of UMFC was
minimized using data of five on/off cycles. At an R-PWM frequency of 0.1 Hz this corresponded to 637 data points. At a frequency of 100 Hz, 1000 data points were used to estimate model parameters.
CHAPTER 4 MFC OPERATION WITH PULSE-WIDTH MODULATED
CONNECTION OF R
EXT1.12 Frequency Characterisation of MFCs
In order to evaluate the effect of a pulse-width modulated connection of the external resistance (R-PWM mode of operation), MFC-1 and MFC-2 were operated at several frequencies ranging from 0.1 Hz to 1000 Hz. At each tested frequency, was connected to the MFC during the first half of the cycle and disconnected for the rest of the cycle, thus corresponding to a duty cycle of 50%.
Figure 2A shows the average output voltage ( ) calculated over the external resistor
( ) of MFC-1 during the R-PWM tests. The frequency tests were carried out with values of 8 and 47 . It can be seen that in all tests the average voltage increased with the initial frequency increase, then a plateau was reached at around 100-500 Hz.
Figure 2. Average external voltage ( ) as a function of Rext connection / disconnection
frequency. A – 1 tests with 15 min and 1 h intervals between frequency changes; B – MFC-2 tests performed with frequency changes at 1 h intervals.
Initially, frequency tests were carried out with 15 min intervals between each frequency change. The tests were also repeated with 1 h intervals between the changes. Figure 2A shows a comparison of profiles obtained with 15 min and 1 h intervals. It may be appreciated that
profiles area qualitatively similar dependence. However, the average voltage was always higher in the tests carried out with 1 h intervals, i.e. the average (per cycle) power output was improved.
0.08 0.12 0.16 0.2 0.24 0.1 1 10 100 1000 V oltage (V) Frequency (Hz) A
Rext = 47 Ω (15 min interval) Rext = 8 Ω (1 h interval) Rext = 8 Ω (15 min interval)
0.09 0.11 0.13 0.15 0.17 0.19 0.1 1 10 100 1000 V oltage (V) Frequency (Hz) B Rext = 12 Ω (1 h interval) Rext = 7.5 Ω (1 h interval)
This suggests that a 15 min interval was insufficient to establish steady-state conditions corresponding to a new operating frequency. Also, it appeared that the R-PWM mode of operation led to an overall performance improvement, as power outputs were consistently higher as compared to a fixed . To insure reproducibility, the frequency tests were repeated in
MFC-2 with values of 7.5 and 12 .
Once again, a similar trend was observed with a near linear increase of as the operating frequency increased from 0.1 Hz to 500 Hz (
Figure 2B). This increase in average voltage and, accordingly, in average power output was followed by stabilization at around 100-500 Hz.
1.13 Dynamic Response of MFCs at Low and High Frequency
MFC response to periodic connection/disconnection of was also characterized by
observing the dynamics of MFC output voltage ( ) during each cycle. Figure 3 compares
values acquired during MFC-1 operation at a low frequency of 0.05 Hz (Figure 3A,
D=75%) and at a high frequency of 100 Hz (Figure 3B, D=90%).
Figure 3. Profiles of MFC voltage ( ) measured at connection / disconnection
frequencies of (A) 0.05 Hz (D=75%) and (B) 100 Hz (D=90%).
It should be understood that when is connected, the output and external voltages are equal, i.e. = . However, if is disconnected, then = 0, while > 0. At both frequencies, MFC output voltage ( ) abruptly decreases when is connected (closed circuit with switch ON), while it increases when is disconnected (open circuit with switch
0.1 0.2 0.3 0.4 0 20 40 60 80 M FC ou tp ut v oltage (V) Time (s) A model output measurements 0.1 0.2 0.3 0.4 0 5 10 15 20 25 M FC ou tp ut v oltage (V) Time (ms) B model output measurements
OFF). Also, when is connected to the MFC, current demand increases and a voltage divider
is created between the MFC's internal impedance and the external resistance, causing to decrease.
At 0.05 Hz two different dynamics components are evidenced during each on-off or off-on transitioff-on (Figure 3A). At first, there is an abrupt change of until reaching some intermediate value. This fast transition is followed by an exponential curve, which approaches the steady-state value at a much slower rate. At a frequency of 100 Hz (Figure 3B), only fast dynamics appear in the curve, while the slow dynamics disappears and essentially
switches between two levels, with higher voltage corresponding to the open circuit state and lower voltage corresponding to the closed circuit state. This dynamics is consistent with the results of the frequency tests shown in Figure 2 and can be described by a simple equivalent circuit model (Randles model, (Randles, 1947)) previously used for modeling batteries (Durr, Cruden, Gair, & McDonald, 2006). The same equivalent circuit model was also recently used to simulate a MFC power management system (Yang, Zhang, Shimotori, Wang, & Huang, 2012). The model consists of two resistors and a capacitor, which enables the description of the slow and fast output voltage responses observed during the tests. ¡Error! No se encuentra el origen
de la referencia. shows the model diagram, where corresponds to MFC's open circuit voltage (ideal voltage), C represents the actual MFC capacitance, accounts for the MFC's ohmic losses, and represents the resistive component accounting for both the activation and concentration losses (Yang, Zhang, Shimotori, Wang, & Huang, 2012).
1.14 The Equivalent Circuit Model Explained
Figure 4. MFC Equivalent Circuit Model (ECM)
The following first order differential equation describes voltage dynamics over the capacitance: (2)
where is the voltage at the internal capacitor, is the external resistance, and
is the apparent open circuit voltage. By applying Kirchhoff’s circuit law to the diagram in ¡Error! No se encuentra el origen de la referencia., the following analytical solution can be
used to obtain MFC output voltage ( ) as a function of time at low operating frequencies:
(3)
where,
(4)
Here, the capacitance final voltage Ufinal and the time constant are defined as: (5) VOC C R1 R2 SW Rext MFC
+
-UMFC+
Uext-1.14.1 The High Frequency Profile
At sufficiently high frequencies of connection/disconnection, the voltage over the capacitance is considered to be constant, as capacitance C opposes to be charged or discharged. Current over the capacitance is supposed to be zero over a cycle of operation. Hence,
(6)
When the switch is closed (from t = 0 to t = t),
(7)
On the other hand, when the switch is open (from t = t to t = T),
(8)
In this case, voltage sign changes as capacitance is supposed to discharge through resistance when the switch is open. When solving the latter integral, may be obtained as a function of the duty cycle D ( ).
(9)
Then UMFC(t) can then be calculated as:
(10)
will then vary between two values: when the switch is open,
and when the switch is closed. The term I represents the closed circuit current, which is given by:
(11)
Figure 5 illustrates an example of a experimentally obtained high frequency profile of a MFC operated under R-PWM mode.
Figure 5. High frequency profile of a MFC operated under R-PWM mode
1.14.2 Power Analysis for High Frequency Operation
The optimal duty cycle can be found by substituting the capacitance voltage in equation (10) with the expression given in equation (9). Then, current is then defined as a function of duty cycle (D), as shown in equation (16) below:
(12)
For intermittent operation, power is defined by:
(13)
The optimal value of D at which power output reaches its maximal value can be found from the first-order optimality condition is evaluated. It can be seen that power output is maximized at the following value of D.
(14)
Since under optimal operating conditions,
(15)
which implies that maximal power output is achieved at D=1 (100%), at least according to equivalent circuit model analysis.
1.14.3 The Low Frequency Profile
For intermittent operation in R-PWM mode, may be equated to its true value when the switch is closed. On the other hand, when the switch is open and no current flows through the circuit, may be considered infinity (∞), so may be equated to zero. Besides, the RC circuit time-constant becomes . Finally, is given by the value at which the capacitance is charged when the switch position is commuted. Figure 6 illustrates an example of a experimentally obtained high frequency profile of a MFC operated under R-PWM mode.
Figure 6. Voltage profile for a MFC operated at low frequency
1.15 The Proposed Equivalent Circuit as a Modeling Tool for MFCs
The proposed ECM might have a limited predictive capacity as it assumes that all the electrical elements are constant. Furthermore, this model does not consider any changes in biomass concentration, microbial activity, and carbon source concentration, i.e. constant values of these parameters are assumed. The MFC internal resistance and open circuit voltage were already demonstrated to be strongly dependent on bio-film density, on carbon source concentration in the anodic liquid, and on temperature (Pinto R. P., Srinivasan, Manuel,, & Tartakovsky, 2010.) (Pinto, Srinivasan, & Tartakovsky, 2011b.). Therefore, the equivalent circuit model might be lacking the predictive capacity of bio-electrochemical models such as recently developed two-population bio-electrochemical MFC model (Pinto R. P., Srinivasan, Manuel,, & Tartakovsky, 2010.) and the conduction-based MFC model (Marcus et al. 2007) and cannot be used to predict the influence of various process inputs, such as the organic loading rate and the operating temperature, on MFC performance.
Nevertheless, it offers some insight on the fast process dynamics linked to the electrical properties of a MFC. Indeed, when the electrical circuit is operated in the continuous mode (i.e.
is constant), the internal capacitor is fully charged and the total internal resistance can be
expressed as . The capacitor dynamics may only be evidenced when the system
is disturbed, for example by means of a switch operated at a low frequency.
Figure 3 compares the equivalent circuit model outputs with voltage measurements at low (Figure 3A) and high (Figure 3B) frequencies of connection/disconnection. For this simulation, model parameters were estimated by minimizing RMSE between the measured voltage values and corresponding model outputs, as described above. The following parameters were estimated : = 0.33 V, = 4.24 Ω, = 3.25 Ω, C = 0.38 F. The comparison of simulated and measured voltage values shows that the model adequately describes process dynamics at both frequencies, although at the high operating frequency the model appears to somewhat underestimate the output voltage. As mentioned above, although process dynamics is adequately described within each cycle, the model is too simplified to predict the output voltage over extended periods of time.
Furthermore, while the equivalent circuit model analysis might suggest that the power output is maximized at D equal to 100%, previous studies demonstrated improved MFC power output at D values below 100%, at least when the MFC was operated at very low frequencies below 0.1 Hz (Grondin, Perrier, & Tartakovsky, 2012). Consequently, the performance of MFC-1 and MFC-2 was evaluated in a series of tests (D - tests) performed at a frequency of 500 Hz and various D values ranging from 5% to 100%, the latter corresponding to a fixed resistor.
1.16 Duty Cycle (D) Characterisation of the MFCs
Notably, MFC power output might also be dependent on the selected value of . Indeed, power output is maximized if external and internal impedances are matched. Therefore, prior to D tests total internal resistances ( ) of MFC-1 and MFC-2 were estimated by
conducting polarization tests and calculating values using linear parts of each polarization curve. Based on this technique, both MFCs showed internal resistance values in a range of 12 - 15 Ohm.
Figure 7A shows MFC-1 power output at different values of the duty cycle and different external resistances. When D tests were conducted with = 17 , which is slightly above the
estimated value of based on the corresponding polarization test, power output was
maximized at D = 95%. A duplicate test performed immediately after the first test demonstrated excellent reproducibility. Following this test, to compare R-PWM and mode of operation with the power output corresponding to a constant , MFC-1 was operated at D = 100% for three days.
A slow decline in power output over time was observed with the power output stabilizing at 2.23 mW (Figure 7A, D = 100%). Interestingly, a re-evaluation of Rint suggested an increase to 20 .
A third D test conducted following MFC-1 operation with a constant confirmed a power output decrease (Figure 7A).
Figure 7. MFC Power outputs of MFC-1 (A) and MFC-2 (B) as a function of their duty cycles. Power output at D=100% corresponds to MFC operation with fixed external resistance. All D-tests were carried out at a frequency of 500 Hz.
D tests were also performed in MFC-2 with = 13.5 , which corresponded to an
estimated value of . In this test, MFC power output at D = 100% was estimated using the same experimental procedure previously performed for other D values, i.e. the voltage was measured after one hour of MFC-2 operation with a fixed resistor. Consequently, the power output decrease at D = 100% was much lower as compared to D = 95% (Figure 7B). When the test was repeated at = 21 , which was above the estimated value of , there was no
difference between power outputs at D = 95% and D = 100%. For the tests conducted at = 6 (well below estimation), the power output was maximized at around D = 45%, as can be seen from the data presented in Figure 7B. Although this maximum was below the highest power output observed at , the R-PWM mode of operation prevented a sharp drop in power output typically observed at . and improved MFC stability by limiting the current.
0 1 2 3 4 0% 20% 40% 60% 80% 100% P ow e r (mW ) Duty Cycle (%) A Rext = 17 Ω Rext = 17 Ω (duplicate) Rext = 17.5 Ω 0 1 2 3 4 5 0% 20% 40% 60% 80% 100% P ow e r (mW ) Duty Cycle (%) B Rext = 13.5 Ω Rext = 21 Ω Rext = 6 Ω