Quantifying Uncertainty in Systems - Two Practical Use Cases Using Machine Learning to Predict and Explain Systems Failures
GABRIELLE GAUTHIER MELANÇON Département de mathématiques et de génie industriel
Mémoire présenté en vue de l’obtention du diplôme de Maîtrise ès sciences appliquées Mathématiques appliquées
Décembre 2019
c
Ce mémoire intitulé :
Quantifying Uncertainty in Systems - Two Practical Use Cases Using Machine Learning to Predict and Explain Systems Failures
présenté par Gabrielle GAUTHIER MELANÇON en vue de l’obtention du diplôme de Maîtrise ès sciences appliquées
a été dûment accepté par le jury d’examen constitué de :
Andrea LODI, Ph. D., président
Louis-Martin ROUSSEAU, Ph. D., membre et directeur de recherche Yossiri ADULYASAK, Ph. D., membre
DEDICATION
“Some of the biggest problems facing the world — war, hunger, poverty, and environmental degradation — are essentially system failures.
They cannot be solved by fixing one piece in isolation from the others, because even seemingly minor details have enormous power to undermine the best efforts of too-narrow thinking.”
ACKNOWLEDGEMENTS
Merci à mes merveilleux collègues et amis à JDA, Element AI et Polytechnique. Je n’en serais pas là aujourd’hui sans ce réseau d’aide incroyable qui m’a permis d’apprendre et me dépasser. Je suis tellement reconnaissante de l’apport de chacun d’entre vous dans l’accomplissement de ce travail. Mes remerciements sont longs et ce n’est pas pour rien.
Merci à JDA, Element AI et Michelin d’avoir accepté que je puisse publier les résultats de mes expériences et de m’avoir alloué du temps pour mes cours et la rédaction. En particulier, merci à Suresh Acharya, Martin Bernier et Alexei Nordell Markovits pour leur continuel soutien et support à l’interne afin que je puisse concilier travail et études. Merci d’avoir cru en moi et de m’avoir supportée dans ce retour aux études.
Un merci tout spécial à Philippe Grangier pour ta contribution, ta patience, tes précieux conseils et tes encouragements. Tu as été une personne clé pour moi du début à la fin. Merci aussi à Éric Prescott-Gagnon et à Emmanuel Sabourin. Nous formions une super équipe. Un énorme merci à tout ceux à Élement AI qui m’ont aidée, que ce soit avec les innombrables discussions sur l’incertitude, les bugs latex, les embeddings, les re-lectures, ou encore les en-couragements, le support et même l’hébergement. Merci Xavier Snelgrove, Orlando Marquez, Waseem Gharbieh, Iman Malik, Jeremy Barnes, Nicolas Chapados, Misha Benjamin, Marie-Claude Côté, Frédéric Branchaud, Lorne Schell, Émilie Perrault, Parmida Atighehchian, Lindsay Brin, Archy de Berker, Claudel Rheault, Jonny Linton, Éric Laufer, Ayushman Dash, Isabelle Bouchard, Tara Tressel ainsi que tous les autres.
Merci à mes amis et mes parents qui m’ont aussi soutenue dans cette aventure, et même avec l’anglais. Vos messages d’encouragement m’ont toujours fait chaud au coeur. Pour en nommer que quelques-uns, merci à Nic, Kat, Maryse, Vince, Caro... Un merci tout particulier à Kev, qui m’a encouragée et inspirée à poursuivre dans cette voix.
Pour terminer, merci aux professeurs qui ont été là pour me guider et m’enseigner. Merci à Charles Audet, pour m’avoir acceptée dans son bureau chaque semaine pour les premiers mois afin que je ré-apprenne toutes les notions mathématiques que j’avais oublié, et à en découvrir de nouvelles. Mais surtout, un énorme merci à mon directeur de recherche, Louis-Martin Rousseau, sans qui je ne me serais jamais lancée dans cette aventure. Merci d’avoir cru en mon potentiel et de m’avoir soutenue à travers toutes ces années. Les mots me manquent pour exprimer toute ma gratitude. Merci à tous!
RÉSUMÉ
Afin d’accomplir et automatiser des tâches complexes, différents modèles et composantes peu-vent être organisés sous forme d’un système. Par exemple, les chaînes d’approvisionnement sont des systèmes qui permettent de transformer et transporter des matières premières en produits finis. Ces systèmes sont primordiaux lorsque la complexité d’un processus est telle qu’elle ne pourrait être gérée manuellement par un seul humain. Cependant, différentes sources d’incertitude peuvent affecter le comportement d’un système et son résultat. Cela peut mener à ce que l’on désigne comme une défaillance du système, c’est-à-dire lorsqu’un système ne produit pas un résultat désiré. Ce mémoire présente et compare deux projets où l’on utilise l’apprentissage machine afin de prédire les défaillances dans les systèmes, en modélisant ces sources d’incertitude avec une approche holistique.
Dans le premier projet, pour lequel nous avons soumis un papier au INFORMS Journal on Ap-plied Analytics, nous cherchons à prédire les défaillances dans les chaines d’approvisionnement. Nous avons développé notre approche à JDA, un fournisseur de logiciels en chaînes d’appro-visionnement, et en coopération avec Michelin, un manufacturier international de pneus. Dans le cadre du projet, nous avons défini une défaillance du système comme étant une baisse du niveau de service en dessous d’un seuil désiré. Nous avons modélisé les différents risques présents dans la chaîne d’approvisionnement en fonction de leur habilité à prédire les dé-faillances quelques semaines à l’avance. Nous démontrons que notre modèle d’apprentissage automatique donne de bons résultats sur un large éventail de produits. Nous soulignons également l’importance de considérer dans l’approche la façon dont les utilisateurs interagis-sent avec les prédictions. Pour cela, nous avons développé un outil interactif afin que les utilisateurs puissent naviguer à travers les prédictions et obtenir le contexte nécessaire afin de comprendre la source de la défaillance. Cet outil a permis de convertir les prédictions en actions concrètes afin de prévenir et éliminer les défaillances avant qu’elles ne se pro-duisent. Dans nos résultats, nous présentons également comment l’outil a permis d’identifier des causes récurrentes de défaillances dans leur chaîne d’approvisionnement.
Dans le cadre du second projet, nous présentons nos résultats préliminaires effectués à Ele-ment AI, un fournisseur de logiciels en intelligence artificielle. Le projet consiste à quantifier la confiance associée à chaque prédiction générée par un système d’intelligence artificielle. Le système en question est composé d’une séquence de modèles, incluant deux algorithmes d’apprentissage profond et quelques heuristiques. L’objectif du système est d’extraire au-tomatiquement de l’information contenue sur un document. Dans une approche similaire
au premier projet, nous avons identifié les sources principales d’incertitude dans le système, telle de l’incertitude aléatorique et épistémique, pour ensuite les modéliser avec une approche d’apprentissage machine afin de déterminer la confiance du système dans chacune de ses pré-dictions. L’approche est de ce fait inverse à notre premier projet, puisque nous quantifions la possibilité que le système ne soit pas en état de défaillance. En pratique, cela revient à la même tâche. Nos résultats préliminaires suggèrent que notre approche est prometteuse. Pour nos deux approches, nous prédisons les défaillances d’un système dans le même but, celui d’identifier les situations incertaines où un humain-dans-la-boucle (human-in-the-loop) peut intervenir afin de rectifier le résultat du système et ainsi éviter la défaillance. Cela permet de mettre à profit la créativité et la connaissance de l’humain pour les situations plus délicates, et ainsi augmenter la performance du système. Dans le contexte des chaînes d’approvisionnement, cela peut vouloir dire d’ignorer les paramètres du plan afin de déplacer des items au bon endroit ou encore augmenter manuellement la production. Dans un sys-tème d’intelligence artificielle, l’humain peut directement changer la prédiction du syssys-tème en regardant par lui-même les données, dans notre cas lire le document et extraire lui même l’information. Nous soulignons aussi comment notre approche est générique et peut s’adapter à divers types de systèmes, avec différentes granularités et sources d’incertitude. Nous discu-tons également comment le modèle utilisé se doit d’être explicable, afin que les utilisateurs puissent identifier et potentiellement éliminer les causes récurrentes de défaillances. Pour ter-miner, notre approche permet aussi d’augmenter la confiance de l’utilisateur dans le système utilisé ainsi que l’automatisation qu’il permet.
ABSTRACT
Systems are widely used to execute complex tasks, such as supply chain systems, which transform and transport raw materials into finished goods. We often rely on systems to automate, at least partially, a process that would be unmanageable or not-efficient for humans to tackle manually. However, different sources of uncertainty can affect systems’ outcomes and behavior, and eventually lead to system failure. The definition of failure is dependent on the context, and it represents an outcome of the system that we want to avoid. This thesis presents and compares two different tracks of work where we explored how to predict system failures, using machine learning, by modeling its sources of uncertainty holistically.
In the first project, for which we submitted a paper to the INFORMS Journal on Applied Analytics, we predict failures in a supply chain system. We developed our approach at JDA, a supply chain software provider, in co-operation with Michelin, an international tires manufacturer. In our approach, we modeled risks with features from different segments of the supply chain that could be good indicators of a future failure. We defined failure as a drop in the service level below the desired target. We showcase that our machine learning model works well on a large variety of products. Most importantly, we highlight the importance of considering in the approach how users interact with the models’ predictions. We designed and built an interactive tool for users so they could navigate through the predictions, get the necessary context, and receive an explanation as to the cause of the failure. The tool allowed for predictions to become actionable, so users could act and avoid system failures. We also present in our results how planners identified recurrent issues in their supply chains.
In the second use case, we present early experiments that we have done at Element AI, an artificial intelligence software provider, on quantifying the confidence of an AI system in its prediction. The system is composed of a sequence of models, including deep learning algorithms, and aims at extracting text from documents. In a similar idea to the first project, we modeled the primary sources of uncertainty of the system, such as aleatoric and epistemic uncertainty, and used a machine learning model to measure confidence estimates in each AI system’s predictions. Our early results on a given dataset suggest that our method is promising.
In both approaches, we predict system failure for a similar purpose: identifying uncertain sit-uations where a human-in-the-loop can rectify the system’s outcome to avoid failure. Indeed, by leveraging a human’s creativity and knowledge in complex cases, we can boost the sys-tem’s performance. In supply chains, this could mean overriding the syssys-tem’s parameters to
change the location of some stock or increase the production. In the AI system use case, this could mean to change the predicted text to its correct value manually. We also highlight how our approach to system failure prediction is generic and flexible to various types of systems, with different granularity, failure definition, and uncertainty sources. We further underscore how the model needs to be explainable so that users can identify and potentially eliminate recurrent causes of system failure. Lastly, failures prediction also help to build general trust in the system and the automation it is providing.
TABLE OF CONTENTS DEDICATION . . . iii ACKNOWLEDGEMENTS . . . iv RÉSUMÉ . . . v ABSTRACT . . . vii TABLE OF CONTENTS . . . ix
LIST OF TABLES . . . xiii
LIST OF FIGURES . . . xiv
LIST OF SYMBOLS AND ACRONYMS . . . xvii
LIST OF APPENDICES . . . xix
CHAPTER 1 INTRODUCTION . . . 1
1.1 Definitions and concepts . . . 1
1.1.1 What is a system? . . . 1
1.1.2 What is uncertainty? . . . 3
1.2 The Problematic . . . 4
1.2.1 Uncertainty in Systems . . . 4
1.2.2 Understanding System Behavior . . . 4
1.2.3 Uncertainty Quantification and Explainable AI . . . 4
1.2.4 Why Uncertainty Quantification is Important . . . 5
1.3 Research Objectives . . . 6
1.3.1 Supply Chain Use Case . . . 6
1.3.2 AI System Use Case . . . 7
1.4 Thesis Outline . . . 7
CHAPTER 2 LITERATURE REVIEW . . . 9
2.1 Uncertainty in Supply Chains . . . 9
2.1.1 Supply Chains are Complex Systems . . . 9
2.1.3 Risks Identification: Sources of Uncertainty in Supply Chains . . . . 9
2.1.4 Risk Mitigation . . . 10
2.1.5 Gap in Literature: Predicting System Failures . . . 11
2.2 Uncertainty Quantification in Artificial Intelligence . . . 11
2.2.1 Why Is There Uncertainty in Artificial Intelligence? . . . 11
2.2.2 Why is Uncertainty Quantification Important in Artificial Intelligence? 11 2.2.3 Why is Uncertainty Quantification Hard in Artificial Intelligence? . . 12
2.2.4 Approaches for Uncertainty Quantification in Artificial Intelligence . 12 2.2.5 Dataset Shift and Out-Of-Distribution Detection . . . 13
2.2.6 Gap in Literature: Artificial Intelligence Systems . . . 13
CHAPTER 3 SUMMARY OF THE WORK . . . 14
3.1 Our Approach . . . 14
3.1.1 The Full-Stack Uncertainty Model . . . 14
3.1.2 Introduction to the Two Use Cases . . . 14
3.2 Adjacent Topics . . . 15 3.2.1 Expert Systems . . . 15 3.2.2 Reliability Engineering . . . 16 3.2.3 Predictive Maintenance . . . 17 3.2.4 Meta-Models . . . 17 3.2.5 Meta-Learning . . . 18
CHAPTER 4 ARTICLE 1: A MACHINE-LEARNING-BASED SYSTEM FOR PRE-DICTING SERVICE LEVEL FAILURES IN SUPPLY CHAINS . . . 19
4.1 Authors . . . 19 4.2 Journal . . . 19 4.3 Abstract . . . 19 4.4 Introduction . . . 20 4.5 Related Work . . . 21 4.6 Michelin Context . . . 21
4.6.1 Service Level Failure . . . 22
4.6.2 Challenges and Opportunity . . . 22
4.6.3 Sources of Service Level Failure . . . 23
4.7 Methodology . . . 23
4.7.1 The task . . . 24
4.7.2 Features . . . 24
4.7.4 Evaluation Metrics . . . 25
4.8 User Interaction with the Model . . . 25
4.8.1 Supply Chain Health Check . . . 25
4.8.2 Focusing on Useful Alerts . . . 25
4.8.3 Model Explainability . . . 27
4.9 Results . . . 27
4.9.1 Experiments Overview . . . 28
4.9.2 First phase - Initial Performance . . . 29
4.9.3 Second phase - Business Validation with Users . . . 30
4.9.4 Third phase - Full Scope of Tires in Europe . . . 31
4.9.5 Fourth phase - Dynamic Phase on Full Scope . . . 31
4.10 Perspectives . . . 33
4.10.1 Available Data . . . 33
4.10.2 Managerial Insights . . . 34
4.10.3 Long Term Viability . . . 34
4.11 Conclusion . . . 34
4.12 Acknowledgement . . . 35
4.13 Appendix: Data and Parameters . . . 35
4.13.1 Data Format . . . 35
4.13.2 Features Set . . . 35
4.13.3 Algorithm . . . 37
4.14 Acknowledgement of Receipt . . . 37
CHAPTER 5 PREDICTING CONFIDENCE ESTIMATES FOR AN ARTIFICIAL IN-TELLIGENCE SYSTEM . . . 40
5.1 Problem Description . . . 40
5.1.1 Artificial Intelligence Systems . . . 40
5.1.2 Current Data Entry Process . . . 40
5.1.3 Using Artificial Intelligence to Extract Information: Form Extractor . 41 5.1.4 Uncertainty Quantification in Form Extractor . . . 42
5.2 Methodology . . . 42
5.2.1 Overview of the Approach: the Full-Stack Uncertainty Model . . . 43
5.2.2 Model’s Task . . . 44
5.2.3 Available Data . . . 44
5.2.4 Features Engineering . . . 45
5.2.6 Algorithm . . . 48
5.2.7 Evaluation Methodology . . . 49
5.3 Results . . . 49
5.3.1 Experiments Details . . . 49
5.3.2 Model Performance . . . 50
5.3.3 Explainability of the Results . . . 51
5.4 Limitations and Future Work . . . 53
5.4.1 Training Data . . . 53
5.4.2 Features . . . 54
5.4.3 Algorithm . . . 54
5.4.4 Out-Of-Distribution Detection . . . 55
CHAPTER 6 GENERAL DISCUSSIONS . . . 56
6.1 Comparison of Both Systems . . . 56
6.1.1 Different Granularity . . . 56
6.1.2 Physical Processing Units and Time . . . 56
6.1.3 Stock and Feedback Loops . . . 57
6.2 Features to Predict Failures in Systems . . . 57
6.2.1 Stock . . . 58 6.2.2 Epistemic Uncertainty . . . 58 6.2.3 Aleatoric Uncertainty . . . 60 6.2.4 Validation Features . . . 61 6.3 Users Workflow . . . 61 6.3.1 Explainable AI . . . 61 6.3.2 Useful Alerts . . . 62
6.3.3 Thresholds and Performance Metrics . . . 62
CHAPTER 7 CONCLUSION AND RECOMMENDATIONS . . . 64
7.1 Summary of Works . . . 64
7.2 Limitations . . . 65
7.3 Future Research . . . 66
REFERENCES . . . 67
LIST OF TABLES
Table 4.1 Changes observed over three weeks of corrective actions in service level (in percentage points), demand (%), and days of coverage. Values were measured before and after the prediction horizon, hence three weeks apart. The columns Action display aggregated results on all items impacted by a corrective action based on a Machine Learning (ML) alert. The columns No Action display aggregated results for the remaining items, thus for which the supply chain plan remained as is. The total is a weighted average according to the volume of tires in each category. . . 33 Table 4.2 Data format used in the model. . . 36 Table 4.3 Features set used in the final model, according to data availability. . . 37 Table 4.4 Distribution of features used in the model, computed for the training
data. . . 38 Table 4.5 Cross-Validation splits used to train and test the model. . . 39 Table 5.1 Data available to train the Full-Stack Uncertainty Model model . . . 45 Table 5.2 Examples of output format validation features . . . 46 Table 5.3 Available datasets to train and test the Full-Stack Uncertainty Model 50 Table 5.4 Performance of the Full-Stack Uncertainty Model on the combined
dataset using 5 splits of Cross Validation . . . 51 Table A.1 Features set used in the Full-Stack Uncertainty Model model . . . . 72
LIST OF FIGURES
Figure 1.1 A system is composed of interconnected elements which together achieves a purpose. . . 2 Figure 3.1 The Full-Stack Uncertainty Model (FSU) uses features from different
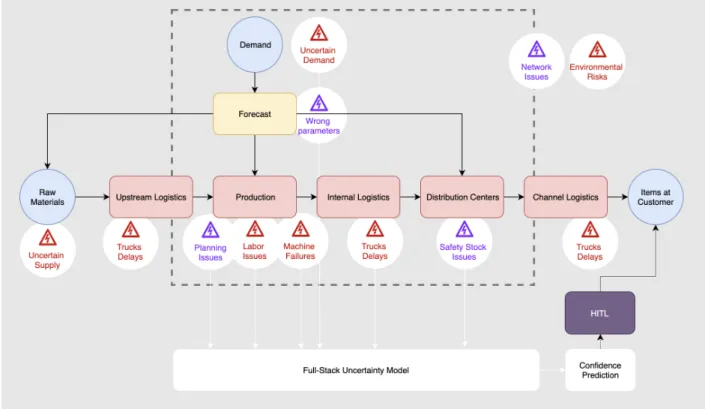
stages of the underlying system to provide an uncertainty estimate of the whole system achieving its purpose. Features typically characterize the uncertainty that may occur in each system’s elements, here repre-sented by lightning. The uncertainty estimates, when high, can trigger the intervention of a Human-in-the-loop (HITL) which can rectify the system to avoid the failure. . . 15 Figure 3.2 Full-Stack Uncertainty Model System for failures prediction in the
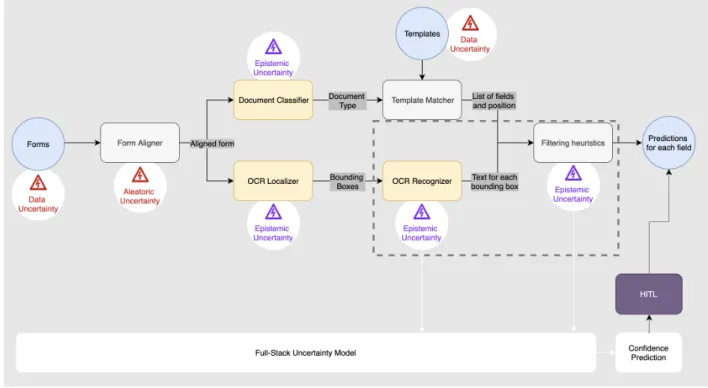
sup-ply chain. . . 16 Figure 3.3 Full-Stack Uncertainty Model System for failures prediction in Form
Extractor, an Artificial Intelligence system. . . 17 Figure 4.1 In the store-and-sell channel, the flow of material starts at raw
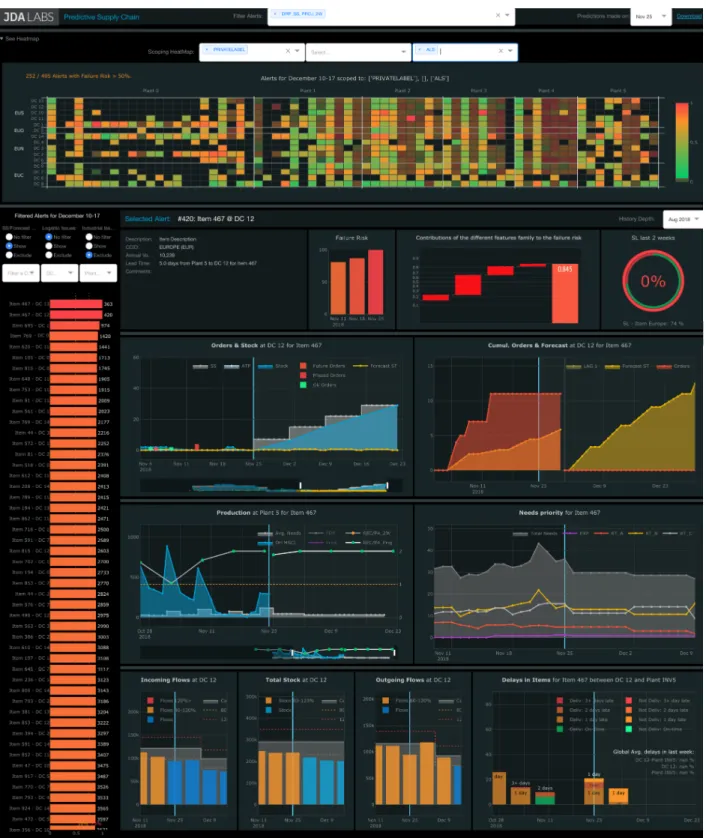
mate-rials procurement and ends when retailers receive the tires. As part of this study, we measured service level failures at the shipping door of the Distribution Centers (DCs). As such, we ignored channel logistics. Raw materials procurement and upstream logistics were also left out as Michelin determined these segments were rarely influencing service level failures. . . 23 Figure 4.2 We developed an interactive User Interface (UI) which can be used to
have an overview of all alerts and to explore each prediction individ-ually, providing context and explanations to identify potential failure resolutions. . . 26
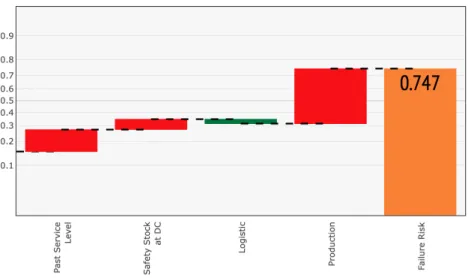
Figure 4.3 In the context of Gradient Boosted Decision Trees (GBDTs), Shapley values sum to the difference between the prediction (failure risk) and the model’s baseline, in our case, the average service level in the train-ing set (y intercept). In this example, the rightmost bar displays the overall prediction of 0.747. Through a waterfall graph, the other bars illustrate the sum of the contributions (Shapley values as estimated by Tree SHAP [2]) for each feature family. The Table 4.3 in the Appendix indicates the mapping between features and features’ family that we considered. Contributions can be positive (green) and decrease the failure risk or negative (red) and increase it. Note that Shapley val-ues share the same units as the model’s output, here log-odds ratio, and as such, they represent log-odds contributions. The graph uses a non-linear (logit) y-axis so that the contributions of the bars can be linearly comparable. . . 28 Figure 4.4 Precision-recall curves for train and test on 17" Summer Tires. The
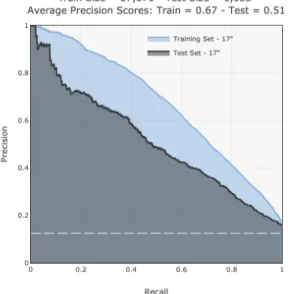
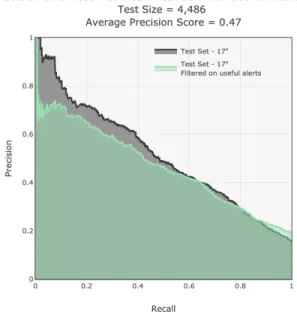
gray area represents the training performance on the first twelve months of data for 17" summer tires, more precisely from 2016-09-01 to 2017-09-20. The blue area is the test performance on the following two months and a half of data for the same tires, from 09-21 to 2017-12-12. The horizontal dotted line displays the mean service level in the dataset. The model reaches good performance. . . 29 Figure 4.5 Precision-recall curve on useful alerts only. The blue area represents
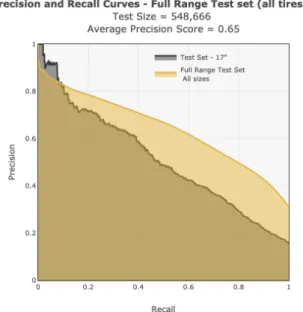
the test set with 17" tires as shown in Figure 4.4. The green area displays the performance on a new test set of 17" summer tires, filtered down to useful alerts only. However, for this analysis, only exclusive and actionable alerts were considered as alerts concerning tires of all significance were included (big runners, medium runners and long tail products). . . 30 Figure 4.6 Precision-recall curves on a test set containing the full range of tires.
The blue area is the initial test set as shown on Figure 4.4. The yellow area displays the performance on all sizes of tires (around 4k items for 11 months of data). The performance is similar, indicating that the model generalizes well to new items. . . 32 Figure 4.7 Email confirming the article was submitted to IJAA, and revised on
2019, November 20th. . . . 37 Figure 5.1 Different components of the Form Extractor system. . . 41
Figure 5.2 Example of screen to set different workflows based on the system’s confidence. . . 43 Figure 5.3 Confidence estimates predicted by the Full-Stack Uncertainty Model
on the 5th Cross Validation split . . . . 52 Figure 5.4 SHAP summary plot displaying the most influential features and their
LIST OF SYMBOLS AND ACRONYMS
AI Artificial Intelligence
XAI Explainable Artificial Intelligence ML Machine Learning
DL Deep Learning
OR Operational Research HITL Human-in-the-loop OOD Out-Of-Distribution
GBDT Gradient Boosted Decision Tree SVM Support-vector Machine
SCRM Supply Chain Risk Management DC Distribution Center
FE Form Extractor
FSU Full-Stack Uncertainty Model CV Cross Validation
OCR Optical Character Recognition API Application Programming Interface NLL Negative Log-Likelihood
ECE Expected Calibration Error
AUROC Area Under the Receiver Operating Characteristic PPV Positive Predictive Value
NPV Negative Predictive Value GPU Graphics Processing Unit
UI User Interface
LIST OF APPENDICES
CHAPTER 1 INTRODUCTION
1.1 Definitions and concepts
In this thesis, we explore the usage of Machine Learning (ML) for system failure predictions by modeling a system’s primary sources of uncertainty. In this section, we first present what is a system, drawing from Meadows [1]. In her book, Thinking in Systems, the author discusses how to define and identify systems around us and explore why they work so well. We use some of her concepts and terminologies throughout this thesis. Subsequently, we explore the concept of uncertainty and the importance of quantifying it to predict systems’ behavior. This will lay the foundation on which we will present our research on utilizing ML to predict failures in two different types of systems, supply chains, and Artificial Intelligence (AI) systems.
1.1.1 What is a system?
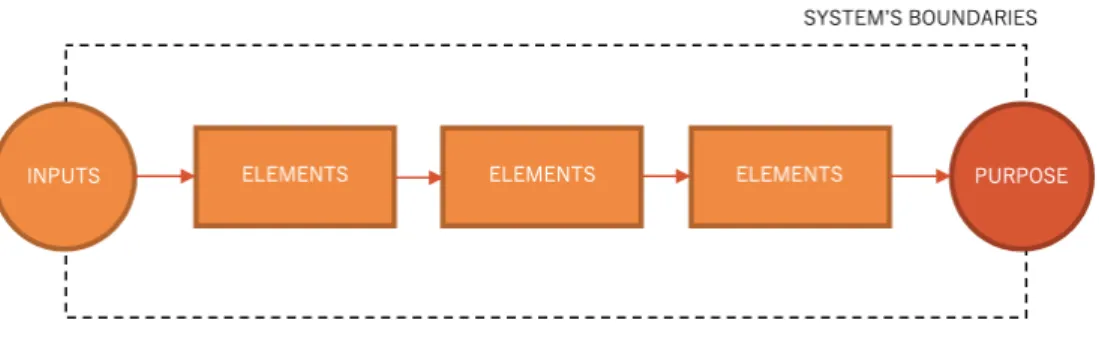
Meadows [1] defines a system as “an interconnected set of elements that is coherently orga-nized in a way that achieves something”. Systems surround us in our everyday lives - heating systems, trees, human bodies, ecosystems, supply chains - and even though these concepts appear quite different, they all share interesting systems properties. First, systems contain elements that communicate and interact with each other through interconnections. Elements are the parts of the system that are usually tangible. As an example, a human body has elements such as lungs, stomach, and legs. Interconnections can be physical flows, such as blood in the veins, or flows of information, such as signals in our nervous system. Secondly, every system has a purpose, which corresponds to its behavior that persists through time. We could argue that the purpose of our body is to stay alive. Thirdly, systems have this particularity where it is challenging to draw its boundaries so that the main factors influ-encing its behavior are considered. As an example, the human body’s behavior is influenced by its surroundings, such as the ambient temperature or the level of stress occasioned by its current situation. It cannot be understood in isolation from these variables. Additionally, elements in a system can be repeatedly broken down in sub-elements, and systems can even be nested in systems. Every organ in the human body can be seen as a system. Ultimately, organs can be decomposed in cells which also belong to a system. If the system boundaries and granularity level are not carefully chosen, it can create misunderstandings or surprises when analyzing its behavior. Essential elements or interconnections should not be left out.
Figure 1.1 A system is composed of interconnected elements which together achieves a pur-pose.
As we analyze a system’s behavior over time, some of its elements accumulate. Meadows [1] categorizes any material or information that builds up over time as stock - such as food (energy) in our stomach or air in our lungs. Stock levels change because of flows. Eating or burning calories are flows which increase or decrease the amount of energy in our system. Stock is a fundamental notion in systems since it allows the inputs and outputs of the system to be momentarily independent and unbalanced. Hence, they act as buffers, or shock absorbers, allowing the whole system to adapt in uncertain environments. When the amount of stock varies in a system, it can trigger a feedback loop. This last concept is key to increase systems resiliency. Feedback loops activate flows to compensate a change in stock. Our body contains numerous feedback loops that allowed us to survive without needing to consciously and continuously think about eating and breathing. Not all systems have feedback loops, but systems that can achieve their purpose in evolving conditions typically have them. Systems are everywhere and rightly so - they work very well. Their structure allows them to be resilient and self-organized; they can adapt, learn, and evolve in variable environments. Systems are also useful and simple in their design, which allow reducing the amount of information stored in each part of the system. Each element can be self-contained and can even often be replaced without impacting the system’s behavior significantly. It helps to reduce complexity for systems achieving difficult and complicated tasks. On the other end, systems’ structure also brings challenges. Interactions between elements can result in unexpected outcomes. Each system sub-part has its purpose, and they do not always add up to the desired system’s purpose. This complexity makes it hard to study and predict system behavior.
With such broad concepts, many concepts surrounding us can be seen as systems. Through-out this thesis, we explore more specifically systems where at least one of its elements is either an algorithm or a machine. These systems are typically used to automate a complex
task. However, many ideas explored could apply to more generic cases too.
1.1.2 What is uncertainty?
Uncertainty is a state in which we cannot describe a current situation or future outcome. In the literature, uncertainty is typically attributed to either randomness of events or incom-plete/unknown information. Nevertheless, some authors consider them the same, arguing that randomness is a form of unknowledge [3]. It is common to refer to those two types of uncertainty as aleatoric vs. epistemic uncertainty [4]. Aleatoric uncertainty, derived from
alea in Latin - a rolling of dice, includes unavoidable unpredictability, or chance, where we
cannot know the outcome. A flip of a coin is aleatoric. Epistemic uncertainty, derived from
epist¯em¯e in greek - knowledge, refers, as its name suggests, to uncertainty due to a lack of
knowledge. In this case, we do not know the outcome, but we could with more information. An example would be where we flip a coin but hide its result. Taleb [3] defines epistemic arrogance as this tendency that we have as humans to underestimate what we do not know and overestimate what we know.
In the ML community, aleatoric uncertainty is usually referred to as data uncertainty and accounts for the noise in the dataset. It can be sensor noise or randomness in the data gener-ation process, such as a dice throw. Even as more data is collected, this type of uncertainty cannot be reduced. Epistemic uncertainty, on the other end, is usually identified as model uncertainty and can be reduced by collecting more data. It includes uncertainty around the model’s parameters, including the choice of model [5].
Various terms and notions gravitates around the notion of uncertainty, such as risks,
confi-dence, failure, and such. While it is beyond the scope of this thesis to define these terms in
details and how they relate to one another, it is important to discuss how we refer to them in the next sections. Risks, in some fields such as finance, is defined as the estimated variance of an expected return [6]. It can hence have a positive or negative connotation. However, in other fields such as Supply Chain Risk Management (SCRM), risks are usually defined as being a subcategory of uncertainty where the outcome is undesirable. Confidence can also have various interpretations, and as part of this work, we consider it loosely as being the opposite of uncertainty. Lastly, failure is defined as being the state in which the desired outcome is not met, usually viewed as the opposite of success. Uncertainty is a likely cause of failures.
1.2 The Problematic
In this section, we discuss how uncertainty can impact system behavior and lead to system failure. We present how uncertainty quantification can be used in systems to alleviate the impact of different sources of uncertainty.
1.2.1 Uncertainty in Systems
Systems are inherently complex and they function in uncertain and evolving environments. Inevitably, systems do not always behave as expected. Even the most resilient systems are not sheltered from failure. Different sources of uncertainty can cause system failures. The most obvious case is uncertainty in the environment surrounding the system that can affect its input and operations. It could be noise in the data or operating conditions rarely observed in the past. In addition, epistemic uncertainty can be present within the system in the form of improperly configured feedback loops, poor interactions between sub-parts of the system, or epistemic uncertainty in the elements themselves. Some components can also have inherent randomness and produce aleatoric outcomes. All these different sources of uncertainty propagate and interact with one another in complex and non-linear ways, thus affecting the system’s behavior.
1.2.2 Understanding System Behavior
To understand the impact of uncertainty, one must analyze the system holistically and not only look at its sub-parts in isolation [7]. However, the challenge lies in how systems are typically built; elements are often designed and tested in isolation. Rahwan et al. [8] discuss how AI machine behavior needs to be studied at the individual, collective, and hybrid human-machine scale. The study at the individual level, that is, at the algorithm itself, is often done by the scientists and engineers who design and develop the machine. Understanding machine behavior at the collective and hybrid levels, respectively the study of the interaction between machines and the study of interactions between machines and humans, are much more difficult. Yet, they are crucial in order to benefit from AI systems while minimizing or avoiding harm.
1.2.3 Uncertainty Quantification and Explainable AI
As part of this work, we define uncertainty quantification as the task of quantifying how likely uncertainty can cause a system to fail at any given time. In AI, the field of quantifying uncertainty in ML models is often tied, or even included, in the field of Explainable Artificial
Intelligence (XAI). This area of research became popular in the last few years, due to the proliferation of AI methods deemed too opaque or hard to understand. In the AI community, there is no clear agreement on the definition of XAI [9]. For instance, the field can be referred as explainability, interpretability or even understandability. Quantifying the uncertainty of an AI system can be categorized as a form of XAI, as it gives more visibility to the underlying models and their limitations.
1.2.4 Why Uncertainty Quantification is Important
Uncertainty quantification is important for preventing system failures, identifying system improvements, building trust, and adding robustness to any downstream task.
Avoiding System Failure
First, the primary motivation behind predicting when a system is likely to fail is to pre-vent failure from happening. One typical way to enable this is to involve a Human-in-the-loop (HITL) in complex and rare situations, to intervene and make the system perform adequately. As humans are creative, knowledgable, and learning beings, they can leverage more information and perform more actions than the system naturally possess. By identify-ing situations at risk for human review, uncertainty quantification becomes a way to increase the resiliency of the system. From this perspective, the human becomes a feedback loop in the system, boosting the system’s performance by intervening in uncertain cases where the system’s stock is not adequate for the task at hand. In supply chains, this may be a situation where supply or product stock is low as compared to the demand. In AI systems, this may be a situation where the amount of knowledge accumulated at training time (in this case, the stock - knowledge - is intangible) is not sufficient to make a confident prediction.
System Improvement
Second, by repeatedly identifying situations where the system is failing, uncertainty quan-tification can indirectly help to detect the most common causes of failure and trigger their abolition. An example of this in AI would be using active learning to identify data that should be labeled in priority to increase the model’s knowledge. It could also be about identifying one feedback loop which is continuously not working correctly, such as incorrect safety stock targets in supply chains. Therefore, uncertainty quantification becomes a way to explore and address common failure patterns, improving the system substantially.
Trust
Third, systems’ users need consistency and reliability so that trust can be gained. Lee and See [10], in a paper on trust in automation, define misuse as failures due to users relying on automation inappropriately, and disuse as failures due to users rejecting the capabilities of automation. If uncertainty is miscommunicated to users, there is a risk in both.
Robustness of Downstream Tasks
Lastly, uncertainty quantification is also useful when the system’s outcome is the input to another system. The system’s uncertainty becomes a source of uncertainty for the subsequent systems. A typical example of this is when a ML model predictions feed in a Operational Research (OR) model, such as forecasts in supply chain inventory optimization models.
1.3 Research Objectives
Throughout this research, we use a ML model to predict failures in two different systems. We will discuss how our approach can be very generic and applicable to different contexts. In both use cases, the objective of the approach is to focus users’ attention on situations at risk where an action can be performed to omit a failure and improve the system’s performance. In our approach, the definition of failure is flexible and can be adapted to the users’ context. We will present how we consider that useful alerts concern situations that are actionable, significant, and exclusive. We will also show the importance of building an explainable model, so users can have the right tools to improve the avoid the alerts, improved the underlying system, and gain trust.
One minor distinction in our approach with the two use cases lies in what the model predicts. In the first use case, the model outputs the likelihood of system failure, also referred to as uncertainty estimates. In the second use case, the model outputs the opposite, i.e., confidence estimates in the system not failing. In practice, predicting one or the other generates the same outcome.
1.3.1 Supply Chain Use Case
In the first use case, we explore a supply chain system, which purpose is to provide the right amount of products to the right location at the right time. A supply chain is a system with delays, as products usually cannot be produced and delivered instantaneously. These delays force supply chain planners to use some foresight to deliver their products in a timely and
costly manner. Inventory throughout the supply chain acts as a buffer for situations such as uncertainty in the processes, demand, or supply. Because of these delays, predicting a supply chain failure in real-time does not allow for users to intervene and avoid the failure. Hence, the proposed model predicts if the supply chain will meet its demand a few weeks ahead. When the model is not confident the supply chain will succeed, we call those supply chain failures.
1.3.2 AI System Use Case
In the second use case, we explore a very different system, which is a AI system that predicts what information should be retrieved from a physical document - in our case filled text on a form. The system is composed of two Deep Learning (DL) models, one ML algorithm and a few heuristics. Quantifying the uncertainty of AI models is a growing topic in the literature. However, uncertainty quantification in a situation where different models interact together to execute a complex task has not been explored significantly. Each model has epistemic and aleatoric uncertainty. One erroneous output of a model can feed into a second model to produce unexpected outcomes. For the AI system of interest, as its purpose is to predict text, we defined a system’s failure as a system’s prediction that is not an exact match (at least one character of the text is wrong). Inversely to the first use case, we developed a model to predict the confidence in the system being successful. As such, the model outputs its confidence that the predicted text is an exact match.
1.4 Thesis Outline
In Section 2, the LITERATURE REVIEW, we will review the two main areas which gravitate around our two projects mentioned above. First, we will discuss literature around our first use case, uncertainty in supply chains, referred to as Supply Chain Risk Management (SCRM). Secondly, we will present the literature around uncertainty quantification in AI for our second use case.
In Section 3: SUMMARY OF THE WORK, we introduce our approach and the two use cases. We also present additional fields of research which are linked to our approach: expert systems, reliability engineering, predictive maintenance, meta-models and meta-learning. Other fields could also have been of interest, such as uncertainty quantification in traditional statistics, cybernetics, or how OR models typically handle uncertainty. These fields of study were left out as they are only adjacent or complementary to our approach.
PREDICT-ING SERVICE LEVEL FAILURES IN SUPPLY CHAINS, we present our paper which was submitted at the INFORMS Journal on Applied Analytics on 2019, May 13th, and re-submitted based on reviewer comments on 2019, November 20th. This work was done with JDA Software and one of their clients, Michelin, an international tires manufacturer. In Section 5, entitled PREDICTING CONFIDENCE ESTIMATES FOR AN ARTIFICIAL INTELLIGENCE SYSTEM, we present some initial experiments that were done at Element AI, to quantify the uncertainty of an AI system, most specifically in the context of a data entry task. This work is still ongoing, and experiments are too early to be conclusive. However, we believe that our early results are encouraging and show that the approach is promising. Lastly, in the GENERAL DISCUSSIONS, we draw parallels between the two use cases and approaches, and we link it back to the concepts outlined in the Introduction. As the two projects have been done in different contexts and companies, the reader will notice that the vocabulary and methodology used are somewhat different. As such, this section will discuss how they relate to one another.
CHAPTER 2 LITERATURE REVIEW
2.1 Uncertainty in Supply Chains
2.1.1 Supply Chains are Complex Systems
In the last few years, supply chains have evolved to deal with a lot of added complexity, due to several factors such as increased competition between businesses, rising costs, and the need to serve customers globally [11]. Supply chains are inherently complex systems, where every subpart of the chain has multiple interactions with one another, and where risks and uncertainties make it difficult for companies to deliver their products effectively at low-cost [12]. Since uncertainty at any step of the supply chain can have an impact throughout the chain, risks mitigation need to be managed with a holistic approach, modeling the supply chain from end-to-end [6]. For more information on supply chains, the reader is referred to Stadtler and Kilger [13].
2.1.2 Supply Chain Risk Management
Dealing with uncertainties in supply chains is often referred to as Supply Chain Risk Man-agement (SCRM), where deviations from the plan can cause disruptions in the ability of the supply chain to deliver the right amount of products at the right time. SCRM usually includes both the identification of potential risks as well as the mitigation plans to reduce their impacts and disruptions on the supply chain [14]. SCRM is thus a framework which goal is to increase the resiliency of the supply chain to risks. A few review papers provide a good overview of the SCRM literature, such as Tang [15], Ritchie and Brindley [16], Rao and Goldsby [6], Heckmann et al. [17]. For more information on SCRM, the reader is referred to Khojasteh [18].
2.1.3 Risks Identification: Sources of Uncertainty in Supply Chains
Many papers in the SCRM literature attempt to identify and classify uncertainties and risks in supply chains into different categories. Kumar et al. [12] refer to two types of risks: internal and external risks. Amongst internal risks, is included demand risk - where the forecast is not accurately representing the customer’s demand, production risk - such as a machine failing at the plant, distribution risk causing uncertainty in lead times, and lastly, supply risk -such as shortage in raw materials. On the other end, external risks include the impact of
the environment on the supply chain, such as political, social, economic, and environmental factors that may cause delays or problems [12]. Other terminologies are used in other papers for the same two concepts, such as operational (internal) risks - referring to uncertainties such as uncertain demand, supply or cost, vs. disruptions (external) risks - referring to uncertainties due to human-made or natural disasters [15, 11, 19]. Jüttner et al. [20] also propose similar categories. First, the authors refer to external risks as environmental risks - uncertainty caused by the interaction of the supply chain with its environment. However, internal risks are broken down in two distinct risk sources: organizational risks and network risks. Organizational risks refer to uncertainty within the supply chain boundaries, such as machine failures. Network risks, on the other end, refer to risks associated with interactions between sub-parts of the supply chain. The authors highlight that this last type of risk is very impactful but often under-estimated. Some papers classify risks at an even more granular level, such as categorizing sources of risk in environmental, industry, organizational, problem-specific, and decision-maker related factors [6], or between operational factors, market factors, business/strategic factors, product factors and miscellaneous [21]. Heckmann et al. [17] also propose a detailed way to classify risks and explore how to measure and model them. In Khojasteh [18], they classify risks differently, where they focus on the impact of risks instead of its source. The authors categorize risks between process, supply, and demand risks, where internal and external risks can have an impact on each of those categories.
2.1.4 Risk Mitigation
Since risks are inevitable, SCRM does not only care about identifying them. It also involves planning operations in a way that reduces risks impact when they happen, while maintaining low costs. Most literature in SCRM revolves around that area, usually referred to as risk mitigation. It relies on some quantification of the risks, which can then be added to the supply chain plan to increase its robustness in the face of uncertainty. Khojasteh [18] pro-vides an exhaustive review of papers using quantitative methods to mitigate uncertainties. Most papers use mathematical models to do so, such as stochastic programming, and a few uses game theory or statistical models. In another review paper, Tang [15], one of the most cited paper in SCRM, the author classifies papers according to how they approach risk mit-igation - supply management, demand management, product management, and information management. Fahimnia et al. [22] also classify quantitative and analytical models for man-aging risks in supply chains. Most of these methods, such as stochastic optimization, rely on some quantification of the risks so it can be taken into account in the problem modeling [17]. Different papers approach this differently, using tools such as scenario-based modeling or deviation-based measures (variance, standard deviation) [18]. In other cases, the use of
probabilities can be difficult due to a lack of historical data or if the historical data is not representative of the future. A such, some papers use possibility distributions, such as fuzzy theory [18, 23].
2.1.5 Gap in Literature: Predicting System Failures
In the literature, the field of SCRM and the field of uncertainty quantification are typically disconnected. As such, most approaches to handle uncertainty in the supply chain have been tackled by supply chain researchers integrating risks notion into the supply chain models, instead of adapting risk models from the literature to supply chains. Hence, there is a gap in the literature around approaching SCRMs with typical uncertainty approaches [24]. As presented above, most papers in the SCRM domain revolves either around identifying sources of uncertainty or around risk mitigation. Few authors have explored using typical risk analysis methods in supply chain context, such as uncertainty propagation with Bayesian networks [24, 25]. No paper explores system failure predictions in supply chains.
2.2 Uncertainty Quantification in Artificial Intelligence 2.2.1 Why Is There Uncertainty in Artificial Intelligence?
AI, such as ML or DL models, are complex systems which aim to perform a prediction task by learning complex patterns and interactions in some dataset. However, data tend to be noisy and incomplete, affecting models’ ability to perform well on new data. Begoli et al. [26] discuss some challenges in DL, which explains why models tend to fail in certain contexts. First, in most DL applications, there is an absence of theory, referred to as "hard laws" such as laws of physics, which makes it impossible to ground uncertainties and bound assumptions. Second, DL models usually rely more on correlation than causation, which causes a lack of robustness when a test data point is far from the training data. Third, DL models are sensitive to noise in the data.
2.2.2 Why is Uncertainty Quantification Important in Artificial Intelligence? In some applications, such as medical cases, the cost of an error can be fatal. Hence, un-certainty quantification is essential so that models can indicate their level of confidence in their prediction. However, even in low-stake scenarios, uncertainty quantification is crucial to build trust with the models’ users [27], identify opportunities for HITL [28] and also identify erroneously classified data points and Out-Of-Distribution (OOD) instances, including
distri-butional shift in the data [29, 27]. A related application is active learning, where uncertainty estimates are used to identify the priority of the data that should be labeled. Finally, uncer-tainty estimates can also help with model interpretability, especially when well-calibrated, as humans tend to have a good intuition for probabilities [30].
2.2.3 Why is Uncertainty Quantification Hard in Artificial Intelligence?
The most naive approach for uncertainty quantification is to directly use a model’s output as an uncertainty estimate, such as soft-max probabilities [29]. However, different authors have shown experimentally that this does not always work well, and that AI models tend to estimate their uncertainty inaccurately. Even more so, in DL, model outputs tend not to be well-calibrated, meaning that their uncertainty score is not a good indicator of the model’s performance [30, 31]. Other papers go further by showing how even the relative ranking of the uncertainty scores cannot be trusted [32, 33]. It suggests that classifiers are not the best judge of their trustworthiness [27]. For these reasons, different research avenues have been explored to perform uncertainty quantification for AI in the last few years. Some of these approaches are specific to some model architectures, such as MC Dropout with neural networks [34], while others involve using unique models designed to estimate their uncertainty, such as prior networks [35]. Some of these techniques model aleatoric uncertainty, others epistemic, and a few even both. Some frameworks, such as Bayesian Neural Networks, provides a robust mathematical approach for uncertainty estimation, but in practice are far too computationally intensive for real-world problems [36]. As a result, there is no explicit agreement amongst the scientific community as to which method works best and how to evaluate them. Below we will present a brief overview of the literature in this domain, with a focus on classification problems.
2.2.4 Approaches for Uncertainty Quantification in Artificial Intelligence Bayesian neural networks approaches to estimate uncertainty have gained popularity in the last few years to estimate uncertainty, such as the quite popular method known as MC Dropout [34, 5, 37]. These approaches do not change the structure of the network and return a distribution over the outputs. Other approaches design their own model architecture to provide uncertainty estimates [36, 35, 38, 39], while other authors used the level of agreement of the classifier with a secondary model [27]. The techniques mentioned above tend to provide uncertainty estimates which will not preserve the initial ranking of the model’s outputs. By that, we mean that the ranking of the model’s outputs, such as soft-max probabilities, will not follow the ranking of the uncertainty estimates. Model calibration is a specific area of
research where the focus is not on changing the ranking, but on calibrating the output, so that it becomes representative of the true correctness likelihood. Different approaches were explored throughout the years, such as histogram binning, Platt scaling, and temperature scaling [40, 41, 28, 42, 31, 30]. Finally, uncertainty quantification is also related to the field of classification with a reject option, where the model can decide not to classify a data point if it costs less than misclassifying it [43, 44, 45].
2.2.5 Dataset Shift and Out-Of-Distribution Detection
Dataset shift and OOD detection are two related concepts that uncertainty quantification approaches typically aim to address. OOD detection typically refers to the broader theme of identifying test data points that are far from the training distribution, which can cause the AI system to have unpredictable behaviors. It is difficult to assess the performance of different approaches in tackling this problem, as we cannot know the distribution of outliers. Assumptions around the nature of these OOD need to be made, which may provide over-optimistic conclusions on the viability of different approaches. Shafaei et al. [46] present an evaluation scheme to address this problem. Amodei et al. [47] identify dataset shift as being one of the five most important problems for AI safety. Dataset shift typically happens in the more specific case where a deployed AI model is exposed to a dataset with a distribution shift from the one used at training time. Some authors include it as a special case of OOD. Dataset shift usually results in a drop in the model’s performance, which may be even more dangerous if the model wrongly assumes the same performance and still provides high confidence estimates. Ovadia et al. [48] state in a recent paper how dataset shift can be due to different factors, such as sample bias and non-stationarity, and presents a rigorous benchmark to compare the performance of different uncertainty methods for dataset shift detection.
2.2.6 Gap in Literature: Artificial Intelligence Systems
As seen above, uncertainty quantification is a challenging task in ML, for which there is no clear consensus on the best approaches and evaluation methods. However, what makes it even more complex in real-world applications is that models are often not working in isolation and can be part of a system of models. Models can interact with one another, sometimes sequentially or even in more complex workflows. Approaches mentioned in the literature cannot be used directly for such use cases.
CHAPTER 3 SUMMARY OF THE WORK
3.1 Our Approach
In this section, we present the Full-Stack Uncertainty Model (FSU), our approach to predict system failure, and describe how we apply it to our two use cases. The approach’s objective is to focus the user’s attention when the system is at risk, where an action can be performed to avoid failure. As such, our approach aims at improving the system’s performance.
3.1.1 The Full-Stack Uncertainty Model
Our approach consists of using a ML classifier to predict whether a failure may occur, based on features describing the state of the system at different stages. The model trains on historical data, where x represents an instance of the system in action and y is a binary variable denoting whether the system met the desired purpose at that instance, as shown in Figure 3.1. The classifier hence learns how different states of the system can be indicative of failures. The different features typically represent the uncertainty that can occur at any stage of the system and cause the whole system to fail. As part of the second project, we named this model the FSU, but we use this terminology to describe our approach in both projects in this section and in the Discussion. The FSU produces an uncertainty estimate quantifying the likelihood of the system failing at a given moment. In uncertain situations, it can trigger the intervention of a HITL that can rectify the output of the system. Consequently, we consider that the FSU and the HITL become part of the system and increase its overall resiliency. Considering the user’s actions as part of the system’s behavior is similar to the approach of analyzing machine behavior at the hybrid level, as mentioned in the Introduction [8].
3.1.2 Introduction to the Two Use Cases
In Figure 3.2 and Figure 3.3, we represent the two use cases using a similar visualization. We display the different subparts of the system, where rectangles are its elements, circles are input and output, and arrows interconnections. The color of each shape represents different types of elements. Red boxes are steps that are not deterministic, such as physical processing units in the supply chain context. Yellow boxes generally represent some learning algorithms, such as ML models, and grey boxes are heuristics. In reality, the line between each type is blurry; the Form Aligner step in Form Extractor (FE) is a heuristic with some stochasticity, and each subpart of the supply chain contains heuristics and some learning machines.
Figure 3.1 The FSU uses features from different stages of the underlying system to pro-vide an uncertainty estimate of the whole system achieving its purpose. Features typically characterize the uncertainty that may occur in each system’s elements, here represented by lightning. The uncertainty estimates, when high, can trigger the intervention of a Human-in-the-loop (HITL) which can rectify the system to avoid the failure.
In both figures, we identify the primary sources of uncertainty with a lightning in a triangle. In red is represented aleatoric uncertainty and in purple, epistemic uncertainty. The dashed rectangle identifies the boundaries of the system that we set for each FSU model. As it is difficult to draw the systems’ boundaries and to explore a system at the right level of granularity, these representations are not necessarily complete and display only components which were useful for the discussion. More details on the use cases and the FSU are provided in sections 4 and 5.
3.2 Adjacent Topics
There are other fields of research that were not included in the Literature Review but are nonetheless linked to the work presented here, albeit tangentially. Below, we draw parallels between our proposed approach and some of these fields.
3.2.1 Expert Systems
Expert systems leverage experts’ knowledge to solve complex problems. They are typically divided in a knowledge component and an inference engine. The former contains knowledge accumulated by experts on the problem at hand. The system then uses this information to infer on new situations, typically with if-then rules. They can be used to diagnose, control or monitor a system. Our approach can be seen as an expert system, where the experts’
Figure 3.2 Full-Stack Uncertainty Model System for failures prediction in the supply chain. Notes. In supply chains, uncertainty can be present in the demand and supply, in operations - such as machine failures and truck delays, in interactions amongst the different supply chain segments (network risks) or by external events such as political policies or natural disasters. Uncertainty can also come from epistemic and aleatoric uncertainty in the different models, or even in the system design.
knowledge is present in the features engineered to monitor failures. However, our approach goes further as it also allows to learn directly from the data and not just through expert knowledge.
3.2.2 Reliability Engineering
In engineering systems, usually composed of a mixture of hardware and software components, the task of predicting a system’s failure is called reliability engineering. Reliability, also referred to as dependability or availability (when reliability is estimated for a specific period of time), is usually defined as being the inverse of the probability of failure. Reliability modelling tests how a system will react in the face of uncertainties and risk, before implementation. As reliability engineering is usually performed on hardware systems, an exception being software reliability, a system’s failure is usually due to physical failure in one of the components, which usually cause the whole system to fail. It is hence more specific than our approach.
Figure 3.3 Full-Stack Uncertainty Model System for failures prediction in Form Extractor, an Artificial Intelligence system.
Notes. In FE, each model has epistemic and aleatoric uncertainty (the latter is not represented). The system’s input, such as the forms and the templates, can also be noisy. Form Aligner is a stochastic heuristic; it does not always produce the same outcome.
3.2.3 Predictive Maintenance
Predictive maintenance concerns the evaluation of equipment condition to determine when maintenance should be executed in order to avoid future failures. It is used for physical ma-chines and equipment in factories, transportation and similar fields. Similarly, our approach can be useful for detecting when systems should undergo tuning or adjustments. In our use cases, maintenance can mean retraining one ML model to adapt to a shift in the distribution of the data.
3.2.4 Meta-Models
A meta-model, or surrogate model, is typically a simplification of a model, abstracting some of its properties while representing relations between the inputs and outputs of the system. The approach of the FSU can be seen as a surrogate model, learning how the input of an underlying system relates to its output being correct or incorrect.
3.2.5 Meta-Learning
In ML, meta-learning is a field where models are trained on meta-data from other ML mod-els. The objective is to produce a system that learns to learn and can adapt to changing environments and conditions. This is important in ML as models are built with different assumptions, such as the data distribution, which cause them to not perform well in new conditions. Meta-learning resembles our second use case, where our FSU model uses meta-data from the underlying ML models to learn when they are not well-suited to perform in the face of uncertainty.
CHAPTER 4 ARTICLE 1: A MACHINE-LEARNING-BASED SYSTEM FOR PREDICTING SERVICE LEVEL FAILURES IN SUPPLY CHAINS
4.1 Authors
Gabrielle Gauthier Melancon, Polytechnique Montreal, JDA Software [email protected]
Philippe Grangier, JDA Software [email protected]
Eric Prescott-Gagnon, JDA Software [email protected] Emmanuel Sabourin, JDA Software [email protected]
Louis-Martin Rousseau, Polytechnique Montreal [email protected]
4.2 Journal
Submitted to INFORMS Journal on Applied Analytics (IJAA). See 4.14 for details.
4.3 Abstract
Despite advanced supply chain planning and execution systems, manufacturers and distribu-tors tend to observe service levels below their targets due to different sources of uncertainty and risks. These risks, such as drastic changes in demand, machine failures, or systems not properly configured, can lead to planning or execution issues in the supply chain. It is too expensive to have planners continually track all situations at a granular level to ensure that no deviations or configuration problems occur. We present a machine learning system that predicts service level failures a few weeks in advance and alerts the planners. The system includes a user interface that explains the alerts and helps to identify failures fixes. We conducted this research in co-operation with Michelin.
Keywords: Supply chain management; manufacturing; machine learning; human-computer interface; explainable AI
4.4 Introduction
Supply chain planning typically comprises multiple optimization systems that differ in scope and planning horizon, from strategic sales and operations planning to near-real-time trans-portation systems. Despite advanced planning and execution systems, manufacturers and distributors tend to observe service levels below their targets due to different sources of un-certainty throughout the supply chain. SCRM is the field dedicated to identifying these risks and mitigating them.
Jüttner et al. [20] classify sources of uncertainty in supply chains between environmental, organizational, and network risks. Environmental risks refer to the impact of the environ-ment on the supply chain, such as natural disasters and political factors. Organizational risks include uncertainty within the supply chain, such as delays in transport or production problems. Lastly, network risks refer to issues due to poor interactions between the subparts of the supply chain. Indeed, as supply chain planning requires the collaboration of different teams and systems that need to be tightly integrated, issues in systems configurations may be undetected and lead to sub-optimal plans. The authors underscore that network risks are a very impactful but often neglected source of risks. As part of SCRM, risk mitigation is an area of research that focuses on building a robust plan that can account for different sources and magnitude of uncertainty. Yet, it can be too costly to plan for the worst outcomes, and it is impossible to model uncertainty perfectly. Consequently, service level failures can occur in supply chains.
Recent advances in ML and the growing availability of data have initiated a steady stream of research combining ML and supply chains [49]. In this paper, we present a system that uses ML to raise alerts when the supply chain conditions may lead to service level failures. The alerts need to anticipate issues in time for the planners to take corrective actions but not so early that the next plan naturally accounts for them. The system focuses the attention of the planners on alerts that are actionable (it is possible to avoid the failure), exclusive (other systems did not detect the issues), and significant (failures concern important items for which performing the corrective action is worthwhile). The system also aims to explain alerts by identifying their underlying causes, so users gain confidence in the results and get the necessary context for potential fixes. We developed the system in co-operation with Michelin, an international tire manufacturer, which provided the business use case and the data.
In the remainder of this paper, we first present Related Work, followed by the section Michelin
problem. In the Methodology section, we outline how we modeled the problem and made predictions using ML. In the User Interaction with the Model section, we present the workflow and UI that we developed to make the system’s predictions useful and explainable. This is followed by the Results section. Eventually, we give some perspectives on our work and the remaining challenge for ML to have a deep impact on supply chain management in
Perspectives. The Appendix contains more details on the model and the data.
4.5 Related Work
Nguyen et al. [49] recently published a survey of big-data analytics for supply chains that clas-sifies the studies by supply chain functions, including demand management, manufacturing,
warehousing, and general supply chain management when the study encompasses multiple
functions of the supply chain together. In the survey, papers falling in the latter category are either descriptive or prescriptive approaches on topics such as managing sustainability [50] or natural disaster risk management [51], but the authors do not report any predictive approaches. They highlight the increase usage of ML for specific areas of supply chain man-agement, such as demand forecasting and machine maintenance. Our approach, which would fall in the predictive applications for the general supply chain category, thus clearly stands out in the current domain’s stream of research. Additionally, to our knowledge, no software vendors were offering a disruption prediction tool ingesting data from several supply chain components simultaneously, at the time of this study.
In the SCRM literature, most papers focus on the identification of risks, such as Heckmann et al. [17], Kumar et al. [12] or on their mitigation, such as Schmitt [52], Paul et al. [53]. Still, a few papers combine both. Simchi-Levi et al. [54] propose methods to identify and mitigate risks in the automotive supply chain context at a tactical decision level. Garvey et al. [24] propose a Bayesian network framework to model risk propagation, tested on simulated data. In contrast, our approach predicts failures on a short term horizon on real live data.
For more information on supply chain planning, the reader is referred to Stadtler and Kilger [13], and to Khojasteh [18] for SCRM specifically.
4.6 Michelin Context
Michelin is an international manufacturer that produces and sells tires for a vast range of vehicles, from cars and motorcycles to tractors and aircraft. Michelin produces roughly 200M tires per year and has a commercial presence in 170 countries, reaching 13.7% of the global tire market in 2014. For the car tires segment, Michelin distinguishes two channels: one
for orders placed well in advance (typically large quantities, for car manufacturers or large retailers) and one for orders placed only a few days ahead (typically for local mechanics), called store-and-sell.
4.6.1 Service Level Failure
In this study, we focused on the store-and-sell channel for car tires in Europe. For this channel, Michelin has a catalog of products, each with a given target delivery window. For example, a 48h delivery window means that a local garage can place an order and expect delivery within 48h. For the respective Michelin’s DC, this translates into a deadline by which the items need to be available for delivery. Inability to meet this deadline is considered a supply chain failure for Michelin. Michelin tracks the performance of its supply chain with Key Performance Indicators (KPIs) aggregating orders’ service level over different scopes, such as products group, regions, periods. In this study, we will focus on service levels aggregated by item and DC at a weekly frequency, and consider a service level failure as being situations where this aggregation is below Michelin’s target.
4.6.2 Challenges and Opportunity
In an ideal world, Michelin’s planners would continuously monitor the supply chain data and adjust its parameters when they detect situations or patterns that could lead to service level failures. However, they are usually unable to monitor the data at a granular level because of the high volume of data and the complexity of supply chains. To illustrate, for the store-and-sell channel in Europe only, Michelin has around 4k different types of items, which are produced in 10 plants and stored in 15 DCs. Additionally, the planners’ responsibilities are typically siloed between the different supply chain segments. As such, the ownership of the service level’s performance is shared, increasing the complexity in identifying issues and mitigating them. For these reasons, planners adopt a proactive approach for the most important items only, and resort to a corrective approach, adjusting the parameters only once the service level has fallen significantly below the target, for the vast majority of their products. This approach is reasonable because it would be too costly to monitor all items. Yet, having a system that would predict situations at risk that require planners’ attention would help in improving the supply chain performance. Moreover, such a system could detect problems that would be missed by human planners.