Université de Montréal
An examination of the effects of 4E-T-mediated re-localization of eIF4E on eIF4E function
par Mona Wu
Institut de recherche en immunologie et en cancérologie Faculté de Médecine
Thèse présentée à la Faculté de Médecine en vue de l’obtention du grade de M.Sc.
August, 2010
Université de Montréal Faculté de Médicine
Cette thèse intitulée :
An examination of the effects of 4E-T-mediated re-localization of eIF4E on eIF4E function
présentée par : Mona Wu
a été évaluée par un jury composé des personnes suivantes :
Jean-Claude Labbé, président-rapporteur Katherine Borden, directeur de recherche Daniel Zenklusen, examinateur externe
Résumé
Le facteur d'initiation de la traduction chez les eukaryotes eIF4E (4E) est un puissant oncogène en raison de sa capacité à faciliter l'export et/ou la traduction de certains transcripts, dont beaucoup sont eux-mêmes des oncogènes. 4E intéragit avec un grand nombre de protéines régulatrices dont la protéine 4E-T (pour 4E-Transporter). La capacité de 4E-T à modifier la localisation subcellulaire de 4E pourrait offrir un mécanisme permettant de modifier le potentiel oncogène d'une cellule. La surexpression de 4E-T dans des cellules d'ostéosarcome conduit à l’augmentation du nombre et de la taille des P-bodies, dans lesquels 4E colocalisent avec 4E-T mais pas avec la version tronquée 4E-T/Y30A. Cependant, les différentes expériences menées, permettant d’analyser les taux de transcription, la quantité de protéine, les profiles polysomiques ainsi que la distribution nucléo-cytoplasmique, montrent que la surexpression de 4E-T n'a pas d'effet sur la fonction de 4E. L'observation d’un enrichissement cytoplasmique et d’une charge réduite de ribosomes sur les transcripts codant les protéines cycline D1 et ODC (profile polysomique) dans la lignée 4E-T suggère un role de 4E-T dans la séquestration cytoplasmique de certains transcrips par un mécanisme qui reste encore à déterminer.
Abstract
The eukaryotic translation initation factor eIF4E (4E) is a potent oncogene due to its ability to facilitate export and/or translation of certain transcripts, many of which are, themselves, oncogenes. 4E has many protein-binding partners including the 4E transporter protein (4E-T). The ability to alter the subcellular localization of 4E via 4E-T could offer a mechanism by which to alter the oncogenic potential of a cell. Overexpression of 4E-T in
osteosarcoma cells leads to formation of larger and more numerous P-bodies that can effectively colocalize with 4E than either a vector control (E) or a less efficient 4E-binding version of 4E-T (Y30A). However, the overexpression of 4E-T did not affect the 4E’s function as determined by examining global levels of transcription, polysome profile, cytoplasmic/nuclear distribution, or protein levels of most of the transcripts tested. The observation that there was cytoplasmic enrichment and reduced loading of ribosomes on cyclin D1 and ODC transcripts (polysome profile) in the 4ET line suggests a possible 4ET-mediated cytoplasmic sequestration of certain transcripts by an as yet to be determined mechanism.
Table of contents
Chapter 1. General Introduction... 12!
Transcript generation and movement in the eukaryotic cell ... 12!
eIF4E ... 20!
Molecular basis for 4E mediated transformation ... 20!
Modes of Regulation of 4E ... 22!
Controlling the expression of 4E mRNA ... 22!
Control of 4E through interactions with partner proteins ... 22!
Controlling 4E activity by modulating its subcellular distribution... 27!
4E-T... 29!
P-bodies and Stress Granules ... 36!
Chapter 2. Creation of 4E-T overexpression cell lines ... 43!
Introduction ... 43!
Materials and Methods... 43!
Results ... 47!
Discussion ... 48!
Chapter 3. Overexpression of 4E-T causes the formation of processing bodies ... 55!
Introduction ... 55!
Materials and Methods... 56!
Results ... 56!
Discussion ... 58!
Chapter 4. 4E-T overexpression relocalizes a proportion of 4E in U2Os cells. ... 66!
Introduction ... 66!
Materials and Methods... 66!
Results ... 67!
Discussion ... 68!
Chapter 5. Impact of 4E-T overexpression on 4E-SE-containing transcripts and the protein products of 4E-sensitive transcripts. ... 72!
Introduction ... 72!
Materials and Methods... 72!
Results ... 76!
Discussion ... 77!
Chapter 6. 4E-T overexpression effect on polysome profile. ... 91!
Introduction ... 91!
Materials and Methods... 92!
Discussion ... 95!
Chapter 7. General discussion and Conclusion... 103!
Future directions... 106!
Supplemental data ... 111!
siRNA depletion of 4ET inhibits P-body formation in FaDu cells... 111!
Introduction ... 111!
Materials and Methods... 111!
Results ... 112!
List of tables
Table 1.1. Classes of eIF4E... 24!
Table 1.2. Transcripts that contain a 4E-SE and/or are 4E-sensitive... 25!
Table 1.3. 4E binding partners. ... 26!
Table 1.4. 4ET characteristics... 33!
Table 1.5. Protein components of SGs... 38!
Table 1.6. Protein components of P-bodies. ... 39!
Table 2.1. Antibody concentrations used for indirect immunofluorescence. ... 51!
Table 2.2. Flow cytometry data from BD FACSAria sorted pMSCV-infected U2Os cells. ... 52!
Table 5.1. Western blot targets. ... 75!
Table 5.2. Primers and targets for RT-qPCR ... 75!
List of figures
Figure 1.1 The central dogma of molecular biology showing some rate processes which
affect cellular RNA and protein levels... 18!
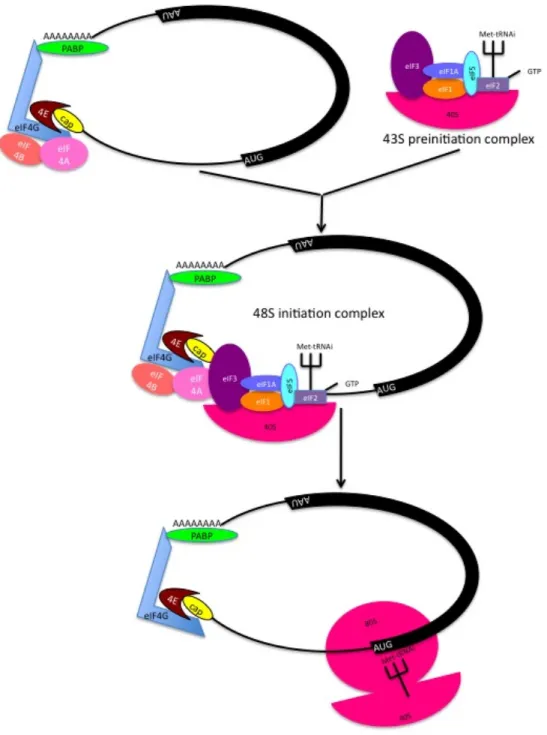
Figure 1.2. Preininitiation and translation initiation complex... 19!
Figure 1.3. Cartoon of the 4E-T protein... 32!
Figure 1.4. Amino acid sequence alignment for 4ET across species... 34!
Figure 1.5. Tissue distribution of 4ET mRNA in humans. ... 35!
Figure 1.6. Schematic overview of experimental strategy for construction of overexpression cell lines ... 42!
Figure 2.1. 4ET is overexpressed in Y30A and 4ET cell lines as compared to the E control. ... 52!
Figure 3.2.Western blot of Dcp1a. ... 62!
Figure 3.3. Micrographs of Y30A cell line showing disappearance of P-bodies with increasing emetine treatment... 63!
Figure 3.4. Micrographs of 4ET cell line showing disappearance of P-bodies with increasing emetine treatment... 64!
Figure 3.5. Micrographs of E cell line untreated, and treated with emetine for 1 hour, 1.5 hours, and 2 hours. ... 65!
Figure 4.1. Overexpression of 4E-T relocalizes endogenous 4E. ... 70!
Figure 4.2. 4E-T overexpression does not drastically alter the protein level or mRNA level of 4E. ... 71!
Figure 5.1. Fractionation controls.. ... 86!
Figure 5.2. RT-qPCR results for 4E-SE transcripts ... 87!
Figure 5.3. RT-qPCR results for 4E-sensitive and 4E-SE containing 4E-sensitive transcripts.. ... 88!
Figure 5.4. Western blot results for products of 4E-sensitive and 4E-SE containing transcripts. ... 89!
Figure 6.2. Superposition of polysome traces for 4ET and E. ... 99! Figure 6.3. Tubulin data. ... 100! Figure 6.4. Raw Ct data for inputs of 4E-SE containing transcripts... 100! Figure 6.5. Raw Ct data for inputs of sensitive transcripts and SE containing
4E-sensitive transcripts. ... 100! Figure 6.6. Transcript profiles for 4E-SE containing transcripts. ... 101! Figure 6.7. Transcript profiles for 4E-sensitive and 4E-SE containing 4E-sensitive transcripts. ... 102! Figure 7.1. Models of potential interaction of 4ET and mRNA in P-bodies. ... 109! Figure S.1. FaDu cells transfected with si4ET do not have P-bodies. ... 113!
Acknowledgements
I thank Katherine Borden for giving me this project. I thank all members of the Borden lab (past and present) as well as members of the IRIC community who have helped me with my studies.
Chapter 1. General Introduction
This study explores the effect of overexpression of eukaryotic translation initiation factor transporter EIF4ENIF1 (referred to as 4E-T in this work) on its relationship with the eukaryotic translation initiation factor eIF4E (4E). A review of the literature concerning RNA export and translation as well as the current knowledge to date about 4E and 4E-T follows.
Transcript generation and movement in the eukaryotic cell
The central dogma of molecular biology in its most general form states that DNA is
transcribed to messenger RNA (mRNA) and mRNA is translated to protein (F. Crick, 1970; F. H. Crick, 1958) (Figure 1.1). If we assume that proteins are the active species in a cell and that the variety and abundance of proteins within a cell is important in determining health versus disease status, then the pool of RNA available to be translated to protein becomes of prime importance. The pool of RNA within a cell is regulated by rates of transcription, mRNA nuclear export, and mRNA sequestration (or in mathematical terms, where k= rate; RNA pool = kTranscription- kmRNAnuclear export – kmRNAdegradation - kmRNAsequestration) (Figure 1.1). Crudely, protein abundance within a cell can be expressed as kTranslation – kProteindegradation (Figure 1.1).
Transcription rate is influenced by promoter strength and presence of regulatory elements for the gene in question. DNA is initially transcribed in the nucleus by RNA polymerase II to precursor mRNA. Shortly after transcription initiation, a 7-methyl guanosine
dinucleotide cap structure (m7
GpppN, where N is any nucleotide) is added to the 5’ end of the RNA. Introns are contranscriptionally removed from the precursor mRNA, RNA editing occurs, and the cleavage and polyadenylation of the 3’ end take place. A variety of RNA-binding proteins interact with the precursor mRNA during these processes and afford a level RNA quality control (known as RNA surveillance) within the nucleus (reviewed by Moraes, 2010). While undergoing proper processing, the mRNA also needs to fold into a favorable tertiary structure—folding is thought to occur via the kinetic energy
conformation-based model (Schroeder, Grossberger, Pichler, & Waldsich, 2002). If there are errors in the nascent mRNAs and/or their tertiary structure, they may be subject to degradation via 3’to 5’ exosome complexes either in the nucleus or the cytoplasm.
Export of mRNA from the nucleus to the cytoplasm is controlled in a process known as gatekeeping (reviewed by Dimaano & Ullman, 2004; Saguez, Olesen, & Jensen, 2005; Vinciguerra & Stutz, 2004). Gatekeeping occurs at the nuclear pore and works in at least two ways: 1) it restricts export of transcripts that are incompletely matured; and 2) it promotes export of mRNAs that are associated with the appropriate proteins. Mammalian RNA export through nuclear pores can be facilitated by association with various RNA-binding proteins depending on the type of RNA (as reviewed by Kohler & Hurt, 2007). tRNA export is mediated by Exp-t protein, while miRNA export is mediated by Exp-5. The assembly of CBC, PHAX and CRM1 aids snRNA export. rRNA export involves the proteins Mex67, Mtr2, Arx1, Nmd3, and CRM1. tRNA, miRNA, snRNA, and rRNA
export all require Ran GTPases. mRNA export involves CBC, ALY/Yra1, TAP/Nex67, and p15/Mtr2. The translation initiation factor eIF4E (4E) can also facilitate the export of certain mRNAs, which possess a specific secondary structure in their 3’ untranslated region (UTR). A more detailed discussion about 4E’s export function follows in the eIF4E section of this introductory chapter.
Aberrant transcripts must be removed in order to prevent translation of abnormal proteins (reviewed in Isken & Maquat, 2007). In mammals, when an mRNA possesses a premature termination codon (PTC), nonsense-mediated decay (NMD) can occur. Classical NMD requires a splicing event downstream from a PTC while fail-safe NMD requires a splicing event upstream of a PTC. If the transcript lacks a termination codon, then non-stop decay can occur. If the transcript causes translation elongation to stall, then and non-go decay can occur.
Normal transcript can be removed via binding of microRNAs (miRNAs). miRNAs are small, endogenous, non-coding ~22 nucleotide RNAs that regulate gene expression of approximately 60% of genes in the genome by interfering with translation or stability of target transcripts (reviewed in Jackson & Linsley, 2010). They bind through partial complementarity, mostly involving an 8-nucleotide seed sequence to 3’ UTR of target mRNAs. As the miRNAs do not require perfect complementarity for target recognition, a single miRNA may regulate multiple mRNAs.
Normal mRNA turnover helps the cell achieve its biochemical equilibrium. Integration of physiological signals determines when a transcript is to be degraded. Rate of degradation of a specific transcript is controlled by cis-acting elements in the mRNA and trans-acting factors that bind these cis elements. In this way, the specific RNA-binding proteins that interact with a given mRNA will affect the mRNA’s stability (and consequently
abundance) in the cytoplasm. Examples of cis elements include the AU-nucleotide rich elements (AREs) found in the 3’ UTRs of mRNAs (reviewed in Kedersha & Anderson, 2002). HuR and tristetrapolin protein (TTP) are examples of trans factors that bind to AREs. HuR is a member of a superfamily of elav-related proteins that can bind AREs. HuR is predominantly nuclear, but shuttles between the nucleus and the cytoplasm. When HuR is bound to an ARE, it stabilizes the mRNA. In contrast, TTP is a predominantly cytoplasmic ARE binding protein that targets certain mRNAs (e.g. tumour necrosis factor-!, granulocyte-macrophage colony-stimulating factor, and interleukin-3) for degradation. Interestingly, both HuR and TTP are found in both stress granules and processing bodies (P-bodies)—to be discussed in the P-bodies and Stress Granules section of this introductory chapter.
Appropriate cytoplasmic localization of certain mRNAs for proper function represents another type of pre-translational mRNA quality control (Gray & Wickens, 1998; Isken & Maquat, 2007). Transcript localization is important for the spatial regulation of genes
involved in protein secretion, synaptic plasticity, cell motility, and embryonic axis formation (reviewed in Holt & Bullock, 2009; Mohr & Richter, 2001). Selection of mRNA destined for localization appears to be determined by binding of trans factors binding to cis-elements in the 3’ UTR (Mohr & Richter, 2001). These ribonucleoprotein (RNP) complexes are linked to cytoskeletal elements (microfilaments or microtubules) along which the RNPs travel. Molecular anchors are required to fix transcripts at their final subcellular destinations. While in transit, the transcripts are translationally silenced. Holt and Bullock (2009) suggest that transcript localization offers certain advantages over targeting protein product: 1) increased efficiency afforded by producing multiple protein molecules from a single mRNA molecule; 2) prevention of ectopic protein activation during translocation; 3) facilitating assembly of macromolecular protein complexes; and 4) decentralizing control of gene expression by permitting local control of translation on demand in response to a signal.
The rate of ribosome loading onto the transcript is important in determining the overall protein abundance in a cell. Eukaryotic translation involves initiation, elongation and termination. Translation initiation mostly occurs via 4E in a cap-dependent manner (Sonenberg, 1988). A schematic drawing of the elements involved in cap-dependent translation initiation is depicted in Figure 1.2. Certain transcripts that possess complex 5’ UTRs appear to be more reliant on 4E for translation initiation—so-called 4E-sensitive transcripts (discussed in more detail in the 4E section).
Other translation initiation factors can either display increased or decreased expression and/or phosphorylation status changes in certain cancers (reviewed in Silvera, Formenti, & Schneider, 2010). Uncoupling of translation regulation from inhibition by cellular stresses such as hypoxia and nutrient deprivation is often seen in human cancers (reviewed in Silvera, et al., 2010). Alterations in translation regulation can also be associated with specific types of cancer and/or different stages of disease or transformation.
Cap-independent translation initiation can occur via internal ribosome entry sites (IRESs) (reviewed in Gray & Wickens, 1998; van der Velden & Thomas, 1999). Other transcripts such as those encoding for certain ribosomal proteins and translation elongation factors make use of 5’ terminal oligopyrimidine (5’TOP) sequence for translation initiation (van der Velden & Thomas, 1999).
Protein degradation is influenced by posttranslational modifications such as ubiquitiniation and sumoylation. However, the focus of this M.Sc. work explores the observed effects of 4ET overexpression on kmRNAnuclear export, kmRNAsequestration, and kTranslation for 4E target RNAs.
Figure 1.1 The central dogma of molecular biology showing some rate processes, which affect cellular RNA and protein levels. (adapted from (de Sousa Abreu, Penalva, Marcotte, & Vogel, 2009)
Figure 1.2. Preininitiation and translation initiation complex. eIF2-GTP-tRNA = ternary complex. eIF4A + eIF4E + eIF4G = eIF4F. PABP = polyA binding protein. 40S + 80S = ribosome.
eIF4E
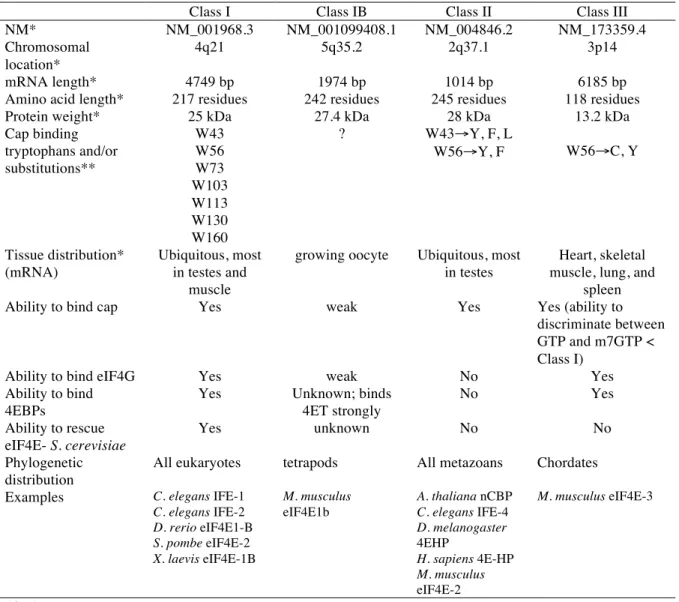
The eukaryotic translation initiation factor eIF4E (4E) regulates gene expression post-transcriptionally at the levels of mRNA translation and mRNA export (Culjkovic et al., 2008; Culjkovic, Topisirovic, Skrabanek, Ruiz-Gutierrez, & Borden, 2005; Sonenberg & Gingras, 1998). It has recently been reported that there are 3 classes of 4E (Joshi, Cameron, & Jagus, 2004; Rhoads, 2009) a comparison of the 4E members is presented in Table 1.1). 4E (human eIF4E-1) overexpression leads to oncogenic transformation in cell culture (Graff et al., 1995; Lazaris-Karatzas & Sonenberg, 1992) and tumour enlargement and increased metastases in xenograft mouse models (Ruggero et al., 2004). Interestingly, a newly identified member eIF4E1b shows oocyte specificity and strong binding to the 4E transporter protein 4ET (Evsikov & Marin de Evsikova, 2009; Standart & Minshall, 2008; Villaescusa et al., 2006). Unlike the other classes of 4E, eIF4E1b acts a a translational repressor of dormant maternal mRNAs (Evsikov & Marin de Evsikova, 2009).
Molecular basis for 4E mediated transformation
The oncogenic potential of 4E arises from its biochemical functions: mRNA export, translation initiation, and potentially mRNA stability. In the nucleus, 4E exports certain transcripts. An approximately 50-nucleotide sequence denoted the 4E sensitivity element (4E-SE) is found in the 3’ UTR of transcripts whose export is effected by 4E (Culjkovic, et al., 2005). In both the nucleus and the cytoplasm, 4E associates with the 5’ end of mRNAs
via the cap structure (Sonenberg, 1988). In the cytoplasm, 4E, along with eIF4A and eIF4G, forms the 5'-cap binding protein complex and promotes cap-dependent translation initiation (Rhoads, 1988; Rozen et al., 1990)(Figure 1.2). Translation efficiency differs between mRNAs depending on the complexity of the secondary structure in their 5' UTRs. 4E overexpression increases translational efficiency of mRNAs with structured 5’ UTRs. These transcripts are considered 4E sensitive (4E-sensitive transcripts or 4E-STs). Examples of 4E-SE containing transcripts and 4E-STs are presented in Table 1.2.
Recent studies describe 4E as a focal point in an "RNA regulon" that governs cell proliferation and survival (Culjkovic, Topisirovic, & Borden, 2007). A regulon is an organizational unit that synchronizes the expression of specific genes post-transcriptionally that are involved in a common pathway (Keene & Lager, 2005). 4E coordinately promotes both the export of mRNA and translation of several genes involved in cell cycle progression and survival. The coordination occurs via co-factors binding elements in the 3' and 5' UTRs. Families of 4E-STs with similar secondary structures will be coordinately regulated.
4E is a clinically relevant oncogene which is elevated in 30% of cancers including breast cancer, colon cancer, head and neck squamous cell carcinoma, and several types of leukemia and lymphoma (Culjkovic & Borden, 2009; Graff & Zimmer, 2003). 4E is a diagnostic marker for metastases, increased tumour invasion and is correlated with poor
prognosis. Targeting 4E in leukemia patients led to clinical benefit (reviewed in (Assouline et al., 2009; Graff & Zimmer, 2003).
Modes of Regulation of 4E
4E can be regulated at the level of its transcription, at the level of its subcellular localization, and at the level of its interaction with other proteins.
Controlling the expression of 4E mRNA
In some human 4E-related cancer cases, the elevated level is due to gene amplification of 4E (Sorrells, Meschonat, Black, & Li, 1999). In other cases, increased stability of the 4E transcript leads to its observed increased level (e.g. stabilization by the protein HuR (Topisirovic, Siddiqui, & Borden, 2009)).
Control of 4E through interactions with partner proteins
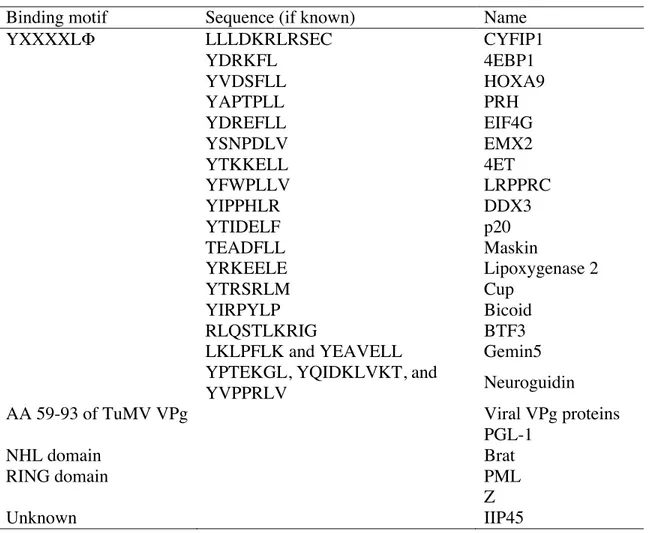
4E activity can be modulated by the presence or absence of 4E binding proteins. Proteins that interact with 4E fall into three broad categories (refer to Table 1.3): 1) proteins containing a conserved eIF4E-binding site (YXXXXL", where X is any residue and " is a hydrophobic residue (Mader, Lee, Pause, & Sonenberg, 1995)) to interact directly with the dorsal surface of 4E; 2) proteins containing a RING domain (such as promyelocytic leukemia protein (PML) (Volpon, Osborne, Capul, de la Torre, & Borden, 2010)); and 3)
proteins that do not contain YXXXXL" or a RING domain (such as invasion inhibitory protein 45 (IIp45) (Borden lab, unpublished)).
Table 1.1. Classes of eIF4E. (adapted from (Evsikov & Marin de Evsikova, 2009; Joshi, et al., 2004; Rhoads, 2009)
Class I Class IB Class II Class III
NM* NM_001968.3 NM_001099408.1 NM_004846.2 NM_173359.4
Chromosomal location*
4q21 5q35.2 2q37.1 3p14
mRNA length* 4749 bp 1974 bp 1014 bp 6185 bp
Amino acid length* 217 residues 242 residues 245 residues 118 residues
Protein weight* 25 kDa 27.4 kDa 28 kDa 13.2 kDa
Cap binding tryptophans and/or substitutions** W43 W56 W73 W103 W113 W130 W160 ? W43#Y, F, L W56#Y, F W56#C, Y Tissue distribution* (mRNA) Ubiquitous, most in testes and muscle
growing oocyte Ubiquitous, most in testes
Heart, skeletal muscle, lung, and
spleen
Ability to bind cap Yes weak Yes Yes (ability to
discriminate between GTP and m7GTP < Class I)
Ability to bind eIF4G Yes weak No Yes
Ability to bind 4EBPs
Yes Unknown; binds
4ET strongly No Yes Ability to rescue eIF4E- S. cerevisiae Yes unknown No No Phylogenetic distribution
All eukaryotes tetrapods All metazoans Chordates
Examples C. elegans IFE-1
C. elegans IFE-2 D. rerio eIF4E1-B S. pombe eIF4E-2 X. laevis eIF4E-1B M. musculus eIF4E1b A. thaliana nCBP C. elegans IFE-4 D. melanogaster 4EHP H. sapiens 4E-HP M. musculus eIF4E-2 M. musculus eIF4E-3 *in humans
Table 1.2. Transcripts that contain a 4E-SE and/or are 4E-sensitive. (adapted from (Culjkovic, Topisirovic, Skrabanek, Ruiz-Gutierrez, & Borden, 2006)
mRNA containing 4E-SE 4E-sensitive transcript 4E-sensitive transcript containing 4E-SE
Cyclin D1 VEGF ODC-1
Cyclin E1 Cyclin B1 Cyclin A2 Pim-1 Mdm2 cMyc Nbs1 Fbox1 CGGbp1 P54nrb/NONO.1 Selenoprotein S
Table 1.3. 4E binding partners. (adapted from (Rhoads, 2009).
Binding motif Sequence (if known) Name
YXXXXL" LLLDKRLRSEC CYFIP1
YDRKFL 4EBP1 YVDSFLL HOXA9 YAPTPLL PRH YDREFLL EIF4G YSNPDLV EMX2 YTKKELL 4ET YFWPLLV LRPPRC YIPPHLR DDX3 YTIDELF p20 TEADFLL Maskin YRKEELE Lipoxygenase 2 YTRSRLM Cup YIRPYLP Bicoid RLQSTLKRIG BTF3
LKLPFLK and YEAVELL Gemin5
YPTEKGL, YQIDKLVKT, and
YVPPRLV Neuroguidin
AA 59-93 of TuMV VPg Viral VPg proteins
PGL-1
NHL domain Brat
RING domain PML
Z
Homeoproteins that contain the conserved 4E-binding motif are tissue-specific factors that modulate 4E activity. PML and Z RING proteins interact with eIF4E via their RING domains leading to a 100X reduction in affinity of 4E for the m7
G cap (Cohen et al., 2001; Kentsis et al., 2001; Volpon, et al., 2010).
The best-characterized regulator of 4E is 4E-binding protein 1 (BP1). BP1 uses its YXXXXL" site to bind 4E and prevent its access to eIF4G and the rest of the translation machinery. Phosphorylation of BP1 reduces its interaction with eIF4E that leads to
increased translation activity of 4E. BP1 and phospho-BP1 levels are modulated in human cancers including M4 AMLs. BP1 levels can be highly elevated in AML (Borden lab, unpublished) and breast cancers (Armengol et al., 2007) which is thought to reflect a change in translational status resulting from a change in local environment from high oxygen to anoxic.
Controlling 4E activity by modulating its subcellular distribution
As stated above, 4E is found both in the nucleus and in the cytoplasm. In the cytoplasm, 4E is found not only with actively translated transcripts, but also in processing bodies (P-bodies) (Andrei et al., 2005). P-bodies may act as a temporary storage depot for RNAs but may also be the site of RNA degradation. It is thought that the presence of 4E with RNAs in P-bodies is associated with a sequestration of such mRNAs.
Re-distribution of 4E can occur by multiple methods. Transduction of I$B-SR leads to re-organization of 4E by reducing the amount of 4E in the nucleus and increasing its amount in the cytoplasm as well as re-organization of remaining eIF4E nuclear bodies into
structures that are morphologically indistinguishable from normal cells (Topisirovic, Guzman et al., 2003). I$B-SR transduction also leads to reduced 4E dependent mRNA export. Treatment with the m7
G cap analogue, m7
GpppG leads to disruption of 4E nuclear bodies and re-distribution of 4E in the cytoplasm (Cohen, et al., 2001; Dostie, Lejbkowicz, & Sonenberg, 2000). A chemical analogue of the m7
G cap, ribavirin, also leads to an increased fraction of 4E in the cytoplasm and reduced amount of 4E-dependent mRNA export (Assouline, et al., 2009; Kentsis et al., 2005; Tan, Culjkovic, Amri, & Borden, 2008). Some AML patient specimens can have mislocalized 4E where it is found
primarily in the nucleus (Assouline, et al., 2009; Topisirovic, Culjkovic et al., 2003). Upon ribavirin treatment, these patients display a large fraction of 4E in the cytoplasm which is correlated with a positive response (Assouline, et al., 2009).
There are several endogenous proteins that can modulate the localization of 4E. These proteins include PRH, LRP and 4E-T (Ferraiuolo et al., 2005; Topisirovic, Guzman, et al., 2003; Topisirovic et al., 2009). 4E-T uses its conserved 4E-binding site to interact directly with the dorsal surface of 4E. Overexpression of 4E-T leads to relocalization of the
majority of nuclear 4E to the cytoplasm, where a subset is founding processing bodies (P-bodies). The molecular mechanism for this re-distribution is as yet unknown.
4E-T
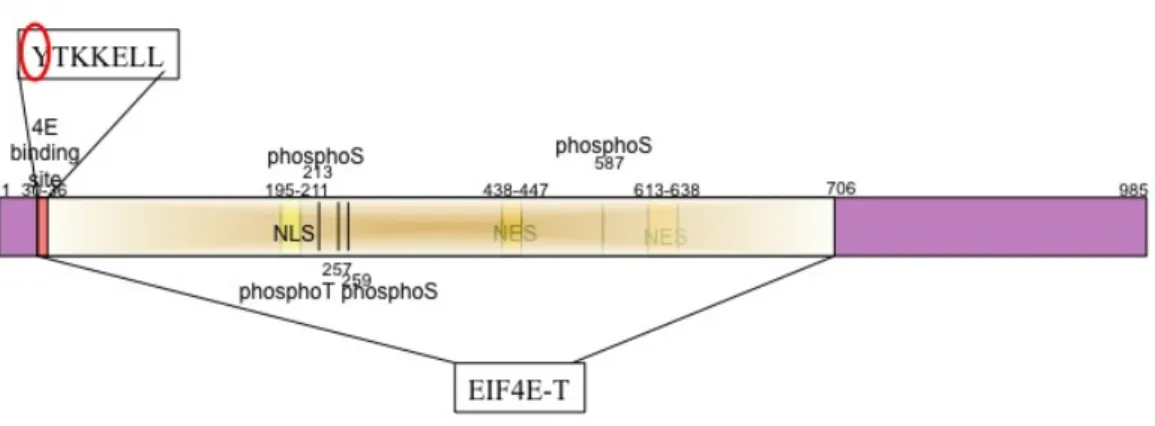
Dostie et al (2000) first described the 4E transporter protein 4E-T as a nucleocytoplasmic shuttling protein that contains a 4E-binding site, one bipartite nuclear localization signal and two leucine-rich nuclear export signals (see Figure 1.3). A number of transcripts for 4ET have been reported (summarized in Table 1.4). 4ET amino acid sequence is highly conserved across chordate species as is its 4E binding motif (boxed region) (Figure 1.4), which suggests that 4ET function and ability to bind 4E is evolutionarily conserved (and therefore of some functional significance). No 4ET orthologue has been identified in yeast. 4E forms a complex with the importin !" heterodimer only in the presence of 4E-T. Dostie et al (2000) suggest that 4E-T mediates the nuclear import of 4E via the importin !" pathway by a piggyback mechanism.
At steady state, 4E-T is predominantly cytoplasmic and appears to be concentrated in P-bodies. Ferraiuolo et al (2005) demonstrated that 4E-T colocalizes with mRNA decapping factors in bona fide P-bodies. 4E-T controls mRNA half-life, because its depletion from cells using short interfering RNA increases mRNA stability. The 4E-T binding partner, 4E, also localized to P-bodies when 4E-T was overexpressed. Ferraiuolo et al (2005) suggest that 4E-T interaction with 4E is a priming event in inducing messenger ribonucleoprotein rearrangement and transition from translation to decay.
4E-T appears to be involved in hypoxia-induced mRNA translation inhibition (Koritzinsky et al., 2006). Hypoxia inhibits mRNA translation initiation biphasically via two distinct pathways: the first phase occurs rapidly, reaching a maximum at 1–2 h and is due to phosphorylation of eIF2!; continued hypoxic exposure activates a second,
eIF2!-independent pathway that maintains repression of translation. This phase is characterized by disruption of eIF4F and sequestration of 4E by its inhibitors 4E-BP1 and 4E-T.
Tissue distribution of 4ET mRNA from microarray studies is summarized in Figure 1.5 from data found at www.biogps.gnf.org. The dataset is an atlas of tissue expression (GeneAtlas) on an Affymetrix U133A array, using the gcrma algorithm to process the data. The Y-axis represents normalized, background-subtracted, and summarized (probes to probeset) intensity of the probeset. Highest expression of 4ET transcript appears to be in the testis, dendritic cells, retina, brain, and various blood cell lineages. No 4ET knockout mouse exists, but several knockout cell lines are available (MGI and International Mouse Knockout Consortium). In mice, P-bodies are also found in oocytes but they disappear upon oocyte growth while subcortical ribonucleoportein particle domains (SCRDs) form ((Flemr, Ma, Schultz, & Svoboda, 2010; Swetloff et al., 2009). If 4ET expression is similar to that of another P-body protein GW182, then it is variably but widely expressed in species (Eystathioy et al., 2002).
4ET shows different levels of phosphorylation in the cell cycle (Pyronnet & Sonenberg, 2001). 4ET becomes more phosphorylated and shows decreased binding to 4E in mitosis.
Figure 1.3. Cartoon of the 4E-T protein.
4E-T is shown with the N-terminus on the left and C-terminus on the right. Numbers denote amino acid positions. Putative phosphorylated residues are shown. The EIF4E-T domain is highlighted (domain defined by NCBI). NLS denotes nuclear localization signal. NES denotes nuclear export signal. The 4E-binding site is situated at amino acid positions 30-36. Y at position 30 when mutated to A partially abrogates 4E-binding.
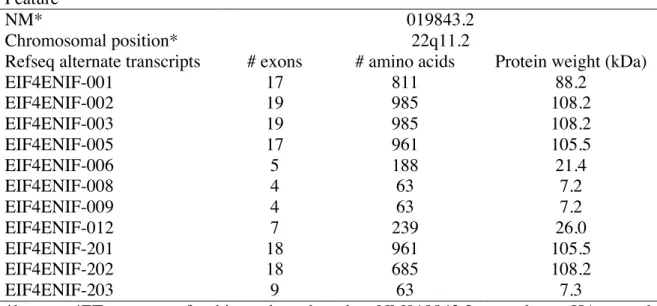
Table 1.4. 4ET characteristics. Feature
NM* 019843.2
Chromosomal position* 22q11.2
Refseq alternate transcripts # exons # amino acids Protein weight (kDa)
EIF4ENIF-001 17 811 88.2 EIF4ENIF-002 19 985 108.2 EIF4ENIF-003 19 985 108.2 EIF4ENIF-005 17 961 105.5 EIF4ENIF-006 5 188 21.4 EIF4ENIF-008 4 63 7.2 EIF4ENIF-009 4 63 7.2 EIF4ENIF-012 7 239 26.0 EIF4ENIF-201 18 961 105.5 EIF4ENIF-202 18 685 108.2 EIF4ENIF-203 9 63 7.3
*human; 4ET constructs for this work are based on NM019843.2 to produce a HA-tagged protein of approximately 140 kDa.
Figure 1.4. Amino acid sequence alignment for 4ET across species. Homo sapiens = humans, Mus musculus = mouse, Rattus norvegicus = rat, Pan troglodytes = chimpanzee,
Canis familiaris = dog, Bos taurus = cow, Gallus gallus= chicken, Danio rerio = zebrafish
P-bodies and Stress Granules
As a consequence of stress-induced translational silencing, polysomes disassemble and the circular polyadenylated mRNA protein complexes (mRNPs) can either form stress granules (SGs) or processing bodies (P-bodies, also known as GW182 or GW bodies or Dcp1
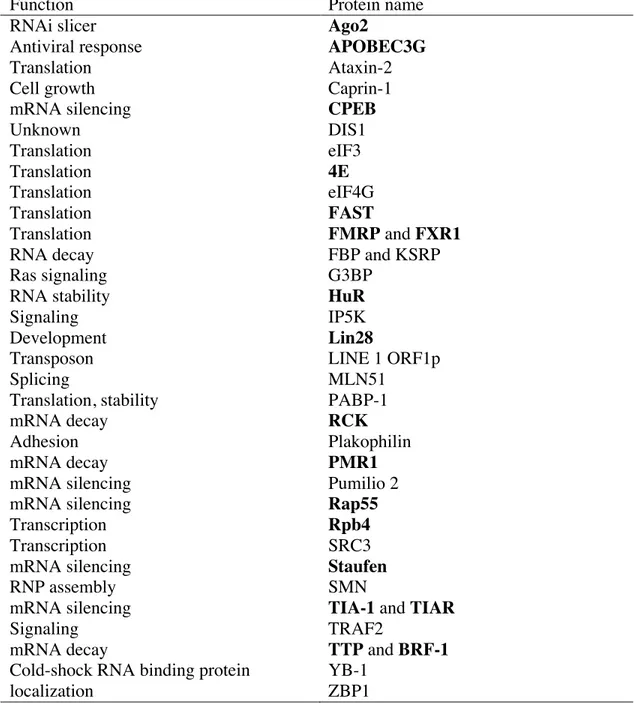
bodies) (reviewed in (Anderson & Kedersha, 2009; Kedersha & Anderson, 2007). Both P-bodies and SGs share certain proteins (boldfaced type genes in Tables 1.5 and 1.6). In metazoans, both SGs and P-bodies contain miRNA silencing elements (Leung & Sharp, 2006).
SGs and P-bodies differ in several ways: 1) only P-bodies are present in actively growing cells; 2) SG but not P-body assembly requires stress-induced phosphorylation of eIF2! (Kedersha et al., 2005); 3) SGs contain translational proteins such as eIF3, eIF4A, eIF4G, polyA-binding protein 1 (PABP-1), and small ribosomal subunits; 4) P-bodies contain mRNA decay proteins (refer to Table 1.6).
Multiple proteins are found within SGs and P-bodies (Tables 1.5 and 1.6 respectively). SGs can be roughly classified into three groups: stalled translation complexes; proteins
involved in translational silencing or mRNA stability; proteins which regulate splicing, RNA editing and RNA localization. P-body components can also grouped into three classes: RNA-binding proteins and translational repressors; proteins involved in nonsense-mediated decay (NMD); and proteins affecting viral function.
The components of P-bodies and SGs are continually exchanging with the cytoplasm (Andrei, et al., 2005; Gilks et al., 2004; Kedersha, et al., 2005; Z. Yang et al., 2004). SGs and P-bodies are also mobile cytoplasmic structures, which transiently interact with one another (Kedersha, et al., 2005). Kedersha observed that SGs were relatively immobile but fluid in shape whereas P-bodies were fixed in shape but very mobile with intermittent interaction with SGs. The interaction between SGs and P-bodies allows for the possible transfer of mRNPs.
In yeast, P-bodies increase in size but decrease in number with increasing cell density (Teixeira, Sheth, Valencia-Sanchez, Brengues, & Parker, 2005). P-body mRNAs in yeast can leave and re-enter the polyribosome pool (Brengues, Teixeira, & Parker, 2005). In HeLa cells, P-bodies display cell cycle related changes: they assemble in G1, are small in early S phase and become larger during late S and G2 phases, and disassemble prior to mitosis (Z. Yang, et al., 2004). Yang et al. (2004) also found that P-bodies are also larger, brighter, and more numerous in proliferating cells.
Table 1.5. Protein components of SGs. (adapted from (Kedersha & Anderson, 2007)(genes in boldfaced type are also present in P-bodies)
Function Protein name
RNAi slicer Ago2
Antiviral response APOBEC3G
Translation Ataxin-2
Cell growth Caprin-1
mRNA silencing CPEB
Unknown DIS1 Translation eIF3 Translation 4E Translation eIF4G Translation FAST Translation FMRP and FXR1
RNA decay FBP and KSRP
Ras signaling G3BP
RNA stability HuR
Signaling IP5K
Development Lin28
Transposon LINE 1 ORF1p
Splicing MLN51
Translation, stability PABP-1
mRNA decay RCK
Adhesion Plakophilin
mRNA decay PMR1
mRNA silencing Pumilio 2
mRNA silencing Rap55
Transcription Rpb4
Transcription SRC3
mRNA silencing Staufen
RNP assembly SMN
mRNA silencing TIA-1 and TIAR
Signaling TRAF2
mRNA decay TTP and BRF-1
Cold-shock RNA binding protein YB-1
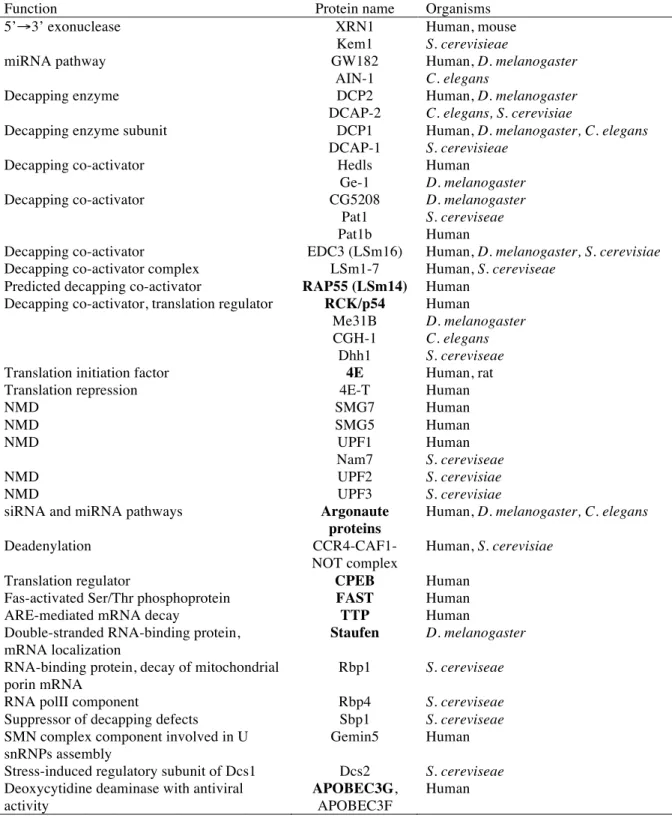
Table 1.6. Protein components of P-bodies. (adapted from (Eulalio, Behm-Ansmant, & Izaurralde, 2007). (genes in boldfaced type are also present in SGs)
Function Protein name Organisms
5’#3’ exonuclease XRN1 Kem1 Human, mouse S. cerevisieae miRNA pathway GW182 AIN-1 Human, D. melanogaster C. elegans Decapping enzyme DCP2 DCAP-2 Human, D. melanogaster C. elegans, S. cerevisiae
Decapping enzyme subunit DCP1
DCAP-1
Human, D. melanogaster, C. elegans
S. cerevisieae
Decapping co-activator Hedls
Ge-1 Human D. melanogaster Decapping co-activator CG5208 Pat1 Pat1b D. melanogaster S. cereviseae Human
Decapping co-activator EDC3 (LSm16) Human, D. melanogaster, S. cerevisiae
Decapping co-activator complex LSm1-7 Human, S. cereviseae
Predicted decapping co-activator RAP55 (LSm14) Human
Decapping co-activator, translation regulator RCK/p54
Me31B CGH-1 Dhh1 Human D. melanogaster C. elegans S. cereviseae
Translation initiation factor 4E Human, rat
Translation repression 4E-T Human
NMD SMG7 Human NMD SMG5 Human NMD UPF1 Nam7 Human S. cereviseae NMD UPF2 S. cerevisiae NMD UPF3 S. cerevisiae
siRNA and miRNA pathways Argonaute
proteins
Human, D. melanogaster, C. elegans
Deadenylation
CCR4-CAF1-NOT complex
Human, S. cerevisiae
Translation regulator CPEB Human
Fas-activated Ser/Thr phosphoprotein FAST Human
ARE-mediated mRNA decay TTP Human
Double-stranded RNA-binding protein, mRNA localization
Staufen D. melanogaster
RNA-binding protein, decay of mitochondrial porin mRNA
Rbp1 S. cereviseae
RNA polII component Rbp4 S. cereviseae
Suppressor of decapping defects Sbp1 S. cereviseae
SMN complex component involved in U snRNPs assembly
Gemin5 Human
Stress-induced regulatory subunit of Dcs1 Dcs2 S. cereviseae
Deoxycytidine deaminase with antiviral activity
APOBEC3G,
APOBEC3F
Rationale and Relevance:
4E has been validated as a cancer target in myeloid leukemia by our lab in collaboration with several hospitals (Assouline, et al., 2009). The ability to reduce the oncogenic effects of 4E is a potential avenue for cancer therapy. Therefore an understanding of how to manipulate 4E’s subcellular localization via 4E-T could be of therapeutic benefit to leukemia.
Hypothesis:
4E-T simultaneously modulates the activities of 4E in the nucleus (mRNA export), in the cytosol (translation), and in P-bodies (mRNA stability/sequestration) thereby reprogramming the proteome of the cell.
Aims:
i) Determine the effects of 4E-T on 4E-mediated mRNA export, translation activity, and sequestration in P-bodies;
Scientific approach and expected outcomes:
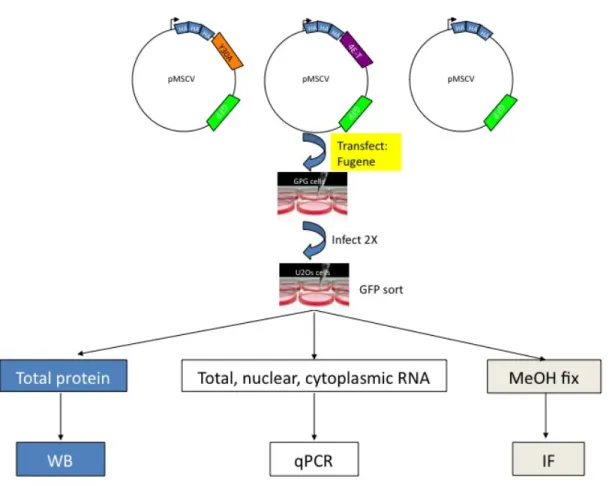
The approach taken was to establish stable U2Os cell lines overexpressing 4E-T and a less efficient-4E interacting form of 4E-T (Y30A mutant) as well as a vector control and perform various analyses using these cell lines (see Figure 1.3).
Changes in 4E activity and localization as a function of 4E-T levels were monitored by Western blot, RT-qPCR, and indirect immunofluorescence microscopy. The ability of 4E-T to modulate the 4E-mediated nuclear export of 4E-SE containing transcripts was assessed using subcellular fractionation and RT-qPCR. Translational efficiency of these 4E-SE transcripts was examined by polysomal analysis and RT-qPCR.
This proposal will investigate the effects of 4E-T mediated relocalization of 4E and whether its biochemical and biological functions are related to its physiological activities in oncogenic transformation. Elucidating the mechanisms involved in 4E control will contribute to our understanding of 4E-mediated oncogenesis. This information may eventually facilitate the development of novel therapaeutic approaches for malignancies with disregulated 4E activity.
Figure 1.6. Schematic overview of experimental strategy for construction of overexpression cell lines.
WB = Western blot, qPCR = reverse transcription quantitative PCR, MeOH= methanol, IF = indirect immunofluorescence.
Chapter 2. Creation of 4E-T overexpression cell lines
Introduction
In order to test the hypothesis that the manipulation of 4E-T protein levels could alter the subcellular localization and potentially the function of 4E, it was imperative to construct a cell line that reliably overexpressed 4E-T.
After several attempts at transient overexpression and clonal selection strategies, I proceeded with a murine stem cell virus (MSCV) retroviral expression strategy to establish overexpressing cell lines. The strategy for construction of the overexpression cell lines is shown in Figure 1.4. The cell lines overexpressed either: 1) wild type version of 4ET (4ET); 2) a reduced 4E-binding version of 4ET (Y30A); or an empty vector control (E). 4ET and Y30A were triple HA-tagged at their N-terminus. All constructs contained a GFP cassette to allow for GFP-sorting post integration to select for transduced cells.
Materials and Methods
Constructing the 4ET overexpression cell line
293 GPG cells (gift from the Roux lab) were used to generate amphotropic retroviruses to infect human osteosarcoma cell line U2Os (ATCC # HTB-96) using the constructs
pMSCVY30A, pMSCV4ET, and pMSCVE (plasmids described in Dostie et al., 2000; gift from Sonenberg lab, McGill). Briefly, 293 GPG cells grown in DMEM + 10% FBS + Penicillin/Streptomycin (all from Gibco) were transfected with 4 µg of construct using FuGENE 6 (Roche Applied Science) as per manufacturer’s protocol. The next day, 293 GPG cells were washed 2 X 3ml PBS and then grown overnight in 8 ml DMEM + 10% FBS + penicillin/streptomycin. Supernatant was collected 24 hrs and 48 hours post transfection and filtered (45 µm filter) to infect U2Os cells in the presence of polybrene (Sigma #H-9268; 4 µg/ml final concentration). Infected U2Os cells were allowed to grow to confluence and then split 1:3. As all constructs contained a GFP cassette, GFP positive cells were collected by FACS (IRIC Flow Cytometry Platform using the BD FACSAria Cell Sorter) to establish the overexpression cell lines.
Total protein lysate collection
Cells were grown to approximately 90% confluence and collected by trypsinization and washed 2X with PBS (pH 7.2; centrifuged 2000 X g 5 minutes, 4 o
C). Cell pellets were lysed in RIPA buffer + KKM (peptstain A (1 mg/ml), aprotinin (2 mg/ml), leupeptin (1 mg/ml), phenanthroline (1mg/ml), and benzamidine (1.6 mg/ml)) and sonicated (Sonic Dismembrator Model 100 (Fisher Scientific) power 3; 1 pulse). Lysed cells were centrifuged (12000 rpm, 4o
C, 20 minutes) and supernatant quantified by bicinchoninic acid (BCA) assay (Thermo Scientific) using the absorbance at 562 nm (Ultrospec 2100 pro UV/visible spectrophotometer, GE Healthcare).
Western blot
12% SDS resolving PAGE gels and 4% stacking gels were used. Gel running conditions were 92 V for 17 minutes and then 192 V for 57 minutes. 20-80 µg of protein lysate were loaded per sample (equal amounts for each gel). Gels were electroblotted (Biorad) to PVDF membrane (Thermo Scientific) overnight at 4o
C in 1X Transfer buffer at a constant current of 200 mA. Membranes were blocked in 5% milk TBST at room temperature for 1 hour. Membranes were incubated with primary antibody (1:500 4ET (Abnova H00056478-B01); 1:500 HA (mouse, Santa Cruz F-7 SC-7392) ; 1:5000 Actin (Sigma A54411)) overnight at 4 oC with rotation. Membranes were washed (3X TBST, 1X TBS,
10 minutes at room temperature with agitation), incubated with secondary antibody (1:5000 ECL-anti-mouse IgG HRP-linked (GE Healthcare)) for 1 hour at room temperature, and washed again (as described previously). ECL reagent (SuperSignal West Pico, Thermo Scientific) was prepared as per manufacturer’s specifications and applied to membranes. Membranes were exposed to X-ray film (AGFA Radiomat B plus full blue, Agfa) and developed in Kodak X-OMAT 2000A processor (Kodak).
RNA collection
Cells were grown to approximately 90% confluence, washed 2X with PBS and lysed with TRIzol (Invitrogen). RNA was collected as per manufacturer’s specifications and resuspended in DEPC dH2O.
RT-PCR and qPCR
RNA was quantified (Nanodrop 2000c; Thermo Scientific). RNA was DNAse treated (Turbo DNAse kit AM 2339, Ambion) and 100 ng of DNased RNA was used to construct cDNA (random hexamers, MMLV; Invitrogen) using manufacturer’s protocol.
Quantitative PCR (EXPRESS SYBR GreenER qPCR Supermix universal, Invitrogen) was conducted on ABI StepOne Plus real time PCR System (Applied Biosystems). Primers for 4E-T are (forward 5’AGACCTTGAGTGCCGTAACCAACA3’; reverse
5’ATGGCTTTCAAGGTTTCGGCTGAC3’). Primers for actin are (forward 5’ GCATGGAGTCCTGTGGCATCCACG3’; reverse 5’
GGTGTAACGCAACTAAGTCATAG3’). Relative expression of mRNA is given as log2
of 2-%%Ct values.
Indirect Immunofluoresence
Cells were grown on acid cleaned glass coverslips (Fisher Scientific). Coverslips were washed 3X PBS (pH 7.2); quenched (50 mM ammonium chloride in PBS) 10 minutes at room temperature, air dried, fixed in 100% methanol (-20oC, 10 minutes), then blocked
(10% FBS, 0.1% Tween) for 30-60 minutes at room temperature. Coverslips were incubated with primary antibody in blocking buffer at 4o
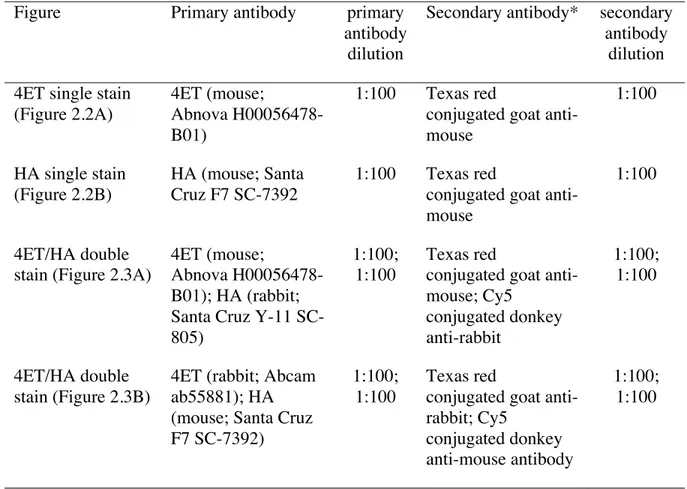
C overnight. Conditions for single and double staining are presented in Table 2.1. Coverslips were washed (3X 5 minutes PBS, room temperature), incubated with secondary antibody at room temperature in the dark for 60 minutes (Table 2.1); washed (3X 5 minutes PBS room temperature, in the dark),
air-dried, and mounted with DAPI (Vectorshield mounting medium for fluorescence with DAPI, Vector Laboratories). Fluorescence micrographs from several fields were observed at 100X optical magnification with 2X digital zoom on a laser scanning confocal microscope (100X objective and numerical aperture 1.4; Zeiss LSM510, IRIC Bio-imaging Platform). The blue channel was converted to green using the LSM510 software version 3.2 (Carl Zeiss, Inc).
Results
Establishment of overexpression cell lines
Post-infection, GFP-positive U2Os cells were obtained for the establishment of each of the overexpression cell lines (55.4% GFP-positive pMSCVY30A cells, 88.6% GFP-positive pMSCV4ET cells; and 99.6% GFP-positive pMSCVE cells, Table 2.2).
GFP-positive cells were tested for their ability to overexpress HA (by Western blot) and 4E-T (by Western blot and RT-qPCR). Both Y30A and 4ET cell lines overexpress HA and 4E-T protein as compared to the vector (E) control (Figure 2.1A). The overexpression of mRNA for 4ET is observed by RT-qPCR for 4E-T in Y30A and 4ET as compared to E (Figure 2.1B). There are some smaller protein products (both HA and 4ET) seen in the Western blot in Y30A and 4ET as compared to E.
Phenotype of overexpression cell lines
Both the Y30A and 4ET cell lines displayed HA-positive cytoplasmic puncta (Figure 2.2A) and 4E-T positive cytoplasmic puncta (Figure 2.2B).
The overexpressed 4E-T protein seen in the 4E-T overexpression and Y30A overexpression cell lines also expresses HA (Figure 2.3) and colocalizes in cytoplasmic puncta. The E cell line does not show overexpression of 4E-T nor does it show colocalization of 4E-T and HA signal (compare E line to Y30A and 4E-T in Figure 2.3).
Discussion
The presence of GFP-positive U2Os cells post infection suggest that the retroviral strategy to create overexpression cell lines using the pMSCV constructs was successful. The characterization of the GFP-positive cells suggests that Y30A and 4ET overexpress mRNA for 4E-T (Figure 2.1B) that is translated into HA-tagged versions of 4E-T (Figure 2.1A and 2.2) that manifest themselves as cytoplasmic foci (Figure 2.3). Quantification of the level of protein overexpression would require reanalysis of Western blots with densitometry software. The observation of cytoplasmic 4E-T positive foci is consistent with previously reported 4E-T overexpression cell systems (Dostie, Ferraiuolo, Pause, Adam, & Sonenberg, 2000; Ferraiuolo, et al., 2005; Rong et al., 2008; Borden lab, unpublished).
The observation that the level of 4ET overexpression is higher in the 4ET line as compared to the Y30A cell line (in this derivation of the overexpression cell lines and previous derivations of overexpression cell lines using different overexpression vectors) is curious especially given that the construct design (e.g. vector backbone and promoter) were identical. It is possible that the cells do not tolerate the Y30A variant of 4ET as well as wild type version of 4ET and so “adapts” to reduce the level of Y30A to “tolerable” levels. The total level of 4ET transcript appears to be 22X higher and 8X higher for 4ET and Y30A respectively as compared to E (Figure 2.1B). Therefore, the introduced Y30A could be “silenced” at the level of transcriptional initiation or at the level of mRNA stability. In the case of silencing at the level of transcriptional initiation, it could be that Y30A is either integrating into heterochromatic region of the genome more often than the 4ET construct or that the site of its integration is more prone to epigenetic silencing (e.g. DNA methylation). It is also possible that the transcript of Y30A is more rapidly degraded than the 4ET transcript. Polysome analysis of 4ET transcript in the 4ET, Y30A, and E lines would establish whether or not the transcripts were behaving differently with respect to loading of ribosomes.
The lower protein bands seen in the Western blots for 4ET and HA in the Y30A and 4ET cell lines that are not observed in the E line are not likely to be products of alternative transcripts (Table 1.4) as the introduced construct is based on 4ET cDNA. The smaller protein 4ET/HA positive protein products of 4ET and Y30A are probably protein
degradation products (Figure 2.1A). Collection of lysates in the presence of a proteasome inhibitor would resolve whether these smaller products are degradation products.
The presence of some HA-signal that does not colocalize with 4E-T in both Y30A and 4ET is unexpected (Figure 2.2A). Since there is HA signal in the nucleus in these cell lines, I suggest that this HA-staining is artefactual and due to the HA antibody used in the double stain cross reacting non-specifically with a nuclear protein since the other panel of 4ET/HA double staining displayed only 4ET/HA positive cytoplasmic puncta (contrast Figure 2.2B with Figure 2.2A).
Given that HA-tagged 4E-T is overexpressed in Y30A and 4ET at the mRNA and protein level and is represented by cytoplasmic puncta (Figures 2.2-2.3), the data strongly suggest that I have established a robust 4E-T overexpression cell lines.
Table 2.1. Antibody concentrations used for indirect immunofluorescence.
Figure Primary antibody primary
antibody dilution
Secondary antibody* secondary antibody
dilution 4ET single stain
(Figure 2.2A)
4ET (mouse;
Abnova H00056478-B01)
1:100 Texas red
conjugated goat anti-mouse 1:100 HA single stain (Figure 2.2B) HA (mouse; Santa Cruz F7 SC-7392 1:100 Texas red
conjugated goat anti-mouse
1:100
4ET/HA double stain (Figure 2.3A)
4ET (mouse;
Abnova H00056478-B01); HA (rabbit; Santa Cruz Y-11 SC-805)
1:100; 1:100
Texas red
conjugated goat anti-mouse; Cy5 conjugated donkey anti-rabbit 1:100; 1:100 4ET/HA double stain (Figure 2.3B)
4ET (rabbit; Abcam ab55881); HA (mouse; Santa Cruz F7 SC-7392)
1:100; 1:100
Texas red
conjugated goat anti-rabbit; Cy5
conjugated donkey anti-mouse antibody
1:100; 1:100
Table 2.2. Flow cytometry data from BD FACSAria sorted pMSCV-infected U2Os cells. Sample Percentage GFP positive Number of cells sorted
U2Os pMSCVY30A 55.4% 1 506 450
U2Os pMSCV4ET 86.6% 1 442 280
U2Os pMSCVE 99.6% 1 126 263
Figure 2.1. 4ET is overexpressed in Y30A and 4ET cell lines as compared to the E control. A) Western blot against 4E-T and HA, tubulin (Tub) shown as a loading control. B) RT-qPCR for 4E-T mRNA normalized by actin and relative to E control.
Figure 2.2 Indirect immunofluorescence in the cell lines.
A) HA signal (red) is observed as cytoplasmic puncta in Y30A and 4ET but not E; B) 4ET signal (red) is observed as a cytoplasmic puncta in Y30A and 4ET and as more diffuse staining throughout the cell in E. DAPI (cyan) marks DNA in nuclei, PC (phase contrast).
Figure 2.3. Micrographs demonstrating that overexpressed 4E-T is also HA-tagged. A) 4ET FL mouse antibody and rabbit HA; B) Abcam 4ET rabbit antibody and mouse HA.
Chapter 3. Overexpression of 4E-T causes the formation
of processing bodies
Introduction
4E-T is a component of cytoplasmic foci known as processing bodies (P-bodies) (Ferraiuolo, et al., 2005). P-bodies are ribonucleotide complexes composed of several proteins (refer to Table 1.6) whose function within cells was discussed in Chapter 1.
Given that overexpression of 4E-T results in cytoplasmic puncta, it is important to determine whether these entities are P-bodies. Decapping protein 1 a (Dcp1a) is a well-established component of P-bodies which are not found in SGs (Cougot, Babajko, & Seraphin, 2004; Kedersha, et al., 2005). Therefore, co-localization of 4E-T and Dcp1a in the cytoplasmic puncta in the 4ET cell line (by immunofluorescence) would support the notion that 4E-T overexpression induces the formation of (large) P-bodies.
Another method to test the formation of P-bodies in the 4ET overexpression cell line is to demonstrate their disappearance (by immunofluorescence) upon treatment with a P-body dispersion drug. Emetine is a drug that can disassemble both P-bodies and stress granules (reviewed in (Kedersha & Anderson, 2007).
Materials and Methods
4E-T overexpression cell lines
U2Os cells overexpressing 4E-T and the mutant non-4E-binding form of 4E-T as well vector control were described in Chapter 2.
Emetine treatment
20 µg/ml emetine (Sigma) was applied to cells grown on coverslips for 1 hour, 1.5 hours, and 2 hours (37 o
C) prior to fixation and immunofluorescence staining. Untreated controls of all cell lines was also collected.
Indirect Immunofluorescence
The indirect immunofluorescence procedure was as described in Chapter 2. Rabbit anti-Dcp1a serum was used to identify anti-Dcp1a-positive entities (gift from Andersen lab; 1:100 dilution).
Results
The Y30A and 4E-T overexpression lines both demonstrate the ability of 4E-T to
colocalize Dcp1a in the cytoplasm (Figure 3.1) suggesting that it does not have to bind 4E in order to be part of P-bodies. Since Dcp1a is a marker for P-bodies, it is surmized that the 4E-T-positivie/Dcp1a-positive cytoplasmic puncta seen in Y30A and 4E-T are P-bodies. The vector control (E) does not show large Dcp1a positive cytoplasmic puncta (contrast E with Y30A and 4E-T in Figure 3.1). By Western blot, there does not seem to be a gross increase in the level of Dcp1a protein in Y30A and 4ET as compared to E (Figure 3.2).
Emetine treatment causes the disappearance of P-bodies
The Y30A cell line displayed more diffuse 4ET and Dcp1a staining with emetine treatment starting at 1 hour with almost complete disappearance of 4ET/Dcp1a positive cytoplasmic bodies by 2 hours of emetine treatment as compared to the untreated control (Figure 3.3).
The 4ET cell line showed 4ET bodies that resisted dispersal with emetine treatment. However, these bodies appeared to become smaller and surrounded by more diffuse 4ET staining with increasing incubation time with emetine as compared to the untreated control (Figure 3.4). The Dcp1a staining was completely colocalized with 4ET staining in the untreated control and was observed as cytoplasmic puncta surrounded by more diffuse Dcp1a staining with increasing incubation time with emetine (Figure 3.4). After 2 hours of emetine treatment the Dcp1a signal was no longer colocalized with 4ET signal (contrast bottom panel of Figure 3.4 with top panel of Figure 3.4).
Discussion
Given that both the Y30A and 4ET cell lines were able to produce cytoplasmic puncta that were positive for 4ET and Dcp1a (Figures 3.1, 3.3 and 3.4) which were not observed in the vector control line E, the data suggest that overexpression of 4ET (whether the wild type form or less effectively-4E binding form) do induce the formation of P-bodies. These data are consistent with data presented by Ferraiuolo et al., 2005 who suggest that localization of 4ET to P-bodies does not require interaction with 4E. The dissolution of 4ET bodies with increasing incubation times with emetine in the Y30A cell line also supports the notion that P-bodies were present in this cell line. The overexpression of 4ET does not appear to affect the protein levels of Dcp1a as seen by Western blot (Figure 3.2).
The persistence of 4ET bodies in the 4ET cell line may be a function of the level of 4ET overexpression in this cell line as compared to either Y30A or E (see Chapter 2 Figure 2.1). However, the dissociation of Dcp1a from 4ET at 2 hours of emetine treatment and the more diffuse 4ET staining around the 4ET puncta present with emetine treatment suggest that the P-body dissassembly drug was able to partially dissociate P-bodies seen in the 4ET line.
A similar study of overexpression of another P-body protein (Pat1b) by Ozgur et al. (2010) suggest an alternate explanation for resistance to diassembly in the presence of another translation elongation inhibitor (cyclohexamide). When Pat1b protein was overexpressed, the induced P-bodies resisted disassembly in the presence of cyclohexamide (even after 6
hours of treatment) which they interpreted as meaning that Pat1b plays a role in stabilizing P-bodies ((Ozgur, Chekulaeva, & Stoecklin, 2010). Therefore, 4ET could also be
important for the stability of P-bodies. When 4ET was depleted in a cell line with
endogenously high levels of 4E and P-bodies (FaDu cell line), P-bodies disappeared which also suggests that 4ET is important for stability of P-bodies (Supplemental Figure S.1).
Small 4ET/Dcp1a positive bodies are seen in the untreated E line. In the presence of emetine, E shows only diffuse staining of both 4ET and Dcp1a (Figure 3.5).
As emetine is a drug that blocks protein synthesis in eukaryotic cells by binding to the 40S subunit of the ribosome (Jimenez, Carrasco, & Vazquez, 1977), it is unlikely to itself directly cause the degradation of Dcp1a or 4ET protein. However, in order to demonstrate that emetine treatment was affecting only the localization of Dcp1a and 4ET, one would have to repeat the experiment and perform Western blot analysis for Dcp1a and 4ET. Given that Ferraiuolo et al., 2005 demonstrated that Dcp1a or 4ET protein levels were unchanged in Hela cells when subjected to 0, 30 and 60 minutes of cyclohexamide, it is expected that emetine treatment will have similar effects.
Together, the data strongly suggest that overexpression of both the mutant and wild type forms of 4ET induce the formation of P-bodies but that those P-bodies formed in the 4ET cell line are more resistant to disassembly with emetine treatment. It is suggested that the
inability to completely dissassemble P-bodies in the 4ET cell line could be overcome with either increased incubation time and/or increased concentration with emetine.
Treating Y30A, 4ET, and E cell lines with another P-body disassembly drug such as cyclohexamide (1- 2 hour treatment with 20-50 ug/ml as suggested in (Kedersha & Anderson, 2007); and as observed in yeast in (Brengues, et al., 2005) might also be performed to lend further credence to the notion that the cytoplasmic 4ET/Dcp1a positive bodies seen in Y30A and 4ET are indeed P-bodies.
As P-bodies contain a large number of protein components (refer to Table 1.6 in Chapter 1), it is also possible (albeit exhaustive) to test for the colocalization of other P-body components with 4ET by immunofluorescence.
The presence of P-bodies changes with the cell cycle. Therefore, increasing the size and/or number and/or half-life of P-bodies could have an effect on the cell cycle. In fact, a recent study showed that overexpression of a splice variant of the tumor supressor gene TFL (transformed follicular lymphoma, P58TFL
) resulted in the formation of P-bodies and an inhibition of G1 to S phase progression (Minagawa et al., 2009). Cell synchronization experiments (e.g. double thymidine block) combined with BrDU analysis to address cell-cycle associated changes in 4ET and/or P-bodies could be of benefit to address these issues.
I suspect that cell cycle has not drastically been altered in Y30A and 4ET as compared to E as all cell lines did not display growth defects (Wu unpublished observation).
Figure 3.1. Micrographs showing subcellular localization of 4E-T and Dcp1a.
Figure 3.3. Micrographs of Y30A cell line showing disappearance of P-bodies with increasing emetine treatment.
Figure 3.4. Micrographs of 4ET cell line showing disappearance of P-bodies with increasing emetine treatment.
Figure 3.5. Micrographs of E cell line untreated, and treated with emetine for 1 hour, 1.5 hours, and 2 hours.
Chapter 4. 4E-T overexpression relocalizes a proportion
of 4E in U2Os cells.
Introduction
Having established cell lines that overexpress 4E-T (wild type overexpression line will heretofore be referred to as 4ET or 4ET line and the mutant overexpression line will be referred to as Y30A or Y30A line) and induce the formation of P-bodies (see Chapters 2 and 3), it is important to investigate the impact of these changes on the cellular levels (mRNA and protein) and subcellular localization of 4E. If the overexpression of 4E-T is able to relocalize a proportion of 4E to P-bodies, then it has the potential of altering the function of 4E.
Materials and Methods
4E-T overexpression cell lines
U2Os cells overexpressing 4E-T and the mutant non-4E-binding form of 4E-T as well vector control were described in Chapter 1.
Indirect Immunofluorescence
The indirect immunofluorescence procedure was as described in Chapter 2. In order to demonstrate co-localization of 4E-T with 4E, a rabbit 4E-T antibody was used (1:100 dilution; Abcam ab55881)
Western blot
Western blot was conducted as described in Chapter 2.
RNA collection
RNA collection was as described in Chapter 2.
RT-PCR and qPCR
RT-PCR and qPCR were performed as described in Chapter 2. 4E forward primer 5’ CTGTGCCTTATTGGAGAAT 3’ and reverse primer 5’
GGAGGAAGTCCTAACCTTT3’.
Results
4E-T overexpression can relocalize endogenous 4E
Overexpression of the wild type form of 4E-T (4ET) as well as the mutant form of 4E-T (Y30A) can relocalize 4E to the cytoplasm. (Figure 4.1A). In the vector control (E), 4E is
observed to have less cytoplasmic staining as compared to either 4ET or Y30A (Figure 4.1A). The 4E-T-positive foci in the 4ET overexpression cell line more effectively colocalize 4E than Y30A (Figure 4.1B).
Overexpression of 4E-T does not alter the protein level or mRNA level of 4E
The protein level of 4E does not appreciably differ between Y30A and 4ET and E (Figure 4.2A). By RT-qPCR, 4E mRNA levels are very slightly reduced in 4ET and slightly elevated in Y30A relative to E (Figure 4.2B). However, these slight variations in 4E mRNA had no impact on 4E protein level.
Discussion
Although overexpression of both the mutant and wild type forms of 4E-T are able to relocalize 4E as compared to the vector control (E) (compare 4E staining of E to Y30A and 4ET in Figure 4.1A), the overlap in indirect immunoflourescence signals is more complete in 4ET as compared to Y30A (compare circled regions highlighted in Figure 4.1B). The mutation in Y30A has been demonstrated to inhibit 4E binding by immunoprecipitation (Dostie et al., 2000). However, as the Y30A cell line was able to relocalize some 4E as compared to E (Figure 4.1A and 4.1B), it is possible that the single amino acid mutation may not be sufficient to completely abrogate the 4E-T-4E interaction. Since the consensus
sequence for 4E binding partners is YXXXXL", perhaps a 4E-T mutant containing a Y to A as well as L to A would be a better mutant.
It is also possible that 4ET has different affinities for the different classes of 4E family members (refer to Table 1.1 in Chapter 1). As our 4E antibody is unlikely to be able to distinguish between the different classes of 4E, it impossible to determine the specificity of Y30A or 4ET for the various classes of 4E either by Western blot or by immunofluorescence at this time.
It would appear that the mRNA levels and protein abundance of 4E is not significantly different between Y30A and 4ET as compared to E (see Figure 4.2). If anything, the mRNA level of 4E is slightly reduced in 4ET and slightly elevated in Y30A as compared to E while the protein levels (by visual inspection) would appear to approximately the same in all cell lines. To more accurately describe the protein levels of 4E in the cell lines, one would need to use densitometry and quantification software.
Together, these data suggest that the 4ET line is more effective at producing P-bodies that relocalize a proportion of 4E as compare to Y30A without greatly affecting the total level of 4E mRNA or protein levels.
Figure 4.1. Overexpression of 4E-T relocalizes endogenous 4E. A) Both Y30A and 4ET (red) can relocalize 4E (green) more than E. B) 4ET forms more distinct 4E-positive cytoplasmic foci than Y30A. Pink circles are shown around representative 4E-T foci for 4ET and Y30A
Figure 4.2. 4E-T overexpression does not drastically alter the protein level or mRNA level of 4E. A) Western blot of 4E in Y30A, 4ET, and E; actin shown as a loading control; B) RT-qPCR data for 4E (delta delta Ct as a function of cell line) for Y30A, 4ET, and E.