ECOLE DE TECHNOLOGIE SUPÉRIEURE UNIVERSITÉ DU QUÉBEC
MANUSCRIPT-BASED THESIS PRESENTED TO
ÉCOLE DE TECHNOLOGIE SUPÉRIEURE
IN PARTIAL FULFILLMENT OF THE REQUIREMENTS FOR THE DEGREE OF DOCTOR OF PHILOSOPHY
BY
Hashem MORTAZAVI
AN IMPEDANCE BASED METHOD FOR DISTRIBUTION SYSTEM MONITORING
MONTREAL, 1TH APRIL 2016 © Copyright Hashem Mortazavi All right reserved
© Copyright
Reproduction, saving or sharing of the content of this document, in whole or in part, is prohibited. A reader who wishes to print this document or save it on any medium must first obtain the author’s permission.
BOARD OF EXAMINERS
THIS THESIS HAS BEEN EVALUATED BY THE FOLLOWING BOARD OF EXAMINERS
Prof. Maarouf Saad, Thesis Supervisor
Department of Electrical Engineering at Ecole de technologie supérieure Dr. Hasan Mehrjerdi, Thesis Co-Supervisor
Qatar University, Doha, Qatar.
Prof. Guy Gauthier, President of the Board of Examiners
Department of Automated Manufacturing Engineering at Ecole de technologie supérieure Prof. Pierre Jean Lagace, Member of the jury
Department of electrical engineering at Ecole de technologie supérieure Prof. Dalal Asber, Member of the jury
Research Institute of Hydro-Quebec (IREQ) Dr. Vahid Jalili Marandi, External Evaluator OPAL-RT TECHNOLOGIES
THIS THESIS WAS PRENSENTED AND DEFENDED
IN THE PRESENCE OF A BOARD OF EXAMINERS AND THE PUBLIC 11TH FEBRUARY, 2016
ACKNOWLEDGMENTS
First of all, I praise God, the almighty, merciful and passionate, for providing me this opportunity and granting me the capability to proceed successfully. The following document summarizes years worth of effort, frustration and achievement. However, there are several people whom I am indebted for their contribution in the research, study and dissertation of this thesis.
I sincerely thank my directors at École de Technologie Supérieure, Professor Maarouf Saad and Dr Hasan Mehrjerdi at Qatar University for their assistance, guidance, continuous support, understanding, attention to detail and involvement in every step throughout the process.
I also would like to thank the jury members who evaluated my thesis and for their constructive suggestions and helpful advice. I would like to thank to Mr. Serge Lefebvre and Mrs. Asber Dalal at Hydro-Québec research institute (IREQ), whose grateful support, inspiring ideas and insightful discussions helped me for completion of my PhD program. In addition, I acknowledge the financial support from Hydro-Québec research institute (IREQ). I am very much thankful my family, especially to my wife Naeiemh Nobakhat, my son Hosein for their love, understanding, prayers and continuing support to complete this research work.
Additionally, I dedicate the dissertation to my parents, my late father Mohammad Ali Mortazavi and my mom Tahere Alavi. From an early age they instilled in me a desire to learn and made sacrifices so I would have access to a high quality education.
Finally, I would like dedicate the dissertation to the memory of my grand fathers Seyed Mahmoud Alavai and Seyed Hashem Mortazavi and the stories of their sacrifices and hard work for their socities have helped make me the person I am today.
UNE MÉTHODE BASÉE SUR L'IMPÉDANCE POUR LA SURVEILLANCE DES SYSTÈMES DE DISTRIBUTION
Hashem MORTAZAVI
RÉSUMÉ
Le but principal de cette thèse est de proposer une nouvelle méthode de surveillance des systèmes de distribution traditionnels en tenant compte de l'intégration des sources d'énergie renouvelables. Les réseaux de distribution traditionnels sont principalement composés de dispositifs d'alimentation radiaux et ils sont conçus pour un flux de puissance unidirectionnel. En conséquence, la réglementation opérationnelle et les systèmes de protection et de contrôle sont souvent basés sur l'hypothèse d'un système de distribution radial.
La forte pénétration des sources d'énergie renouvelables aura un impact clair sur l'opération des systèmes de distribution. L'opération des réseaux électriques fait face à de nouveaux défis créés par les sources d'énergie renouvelables qui sont différents des défis traditionnels. L'intermittence des sources d'énergie renouvelables, la protection des systèmes électriques, la stabilité, la sécurité, la répartition économique et l'optimisation du flux de puissance sont des problèmes critiques issus de la pénétration d'un système électrique par des sources d'énergie renouvelables.
En outre, la production de la source d'énergie renouvelable peut excéder la consommation durant le jour, ce qui inverse le flux d'énergie durant certaines périodes. Un fort taux de pénétration de sources renouvelables décentralisées crée une situation de flux électrique multidirectionnel dans le réseau de distribution, qui était à l'origine conçu pour un flux unidirectionnel seulement. En conséquence de cette inversion de flux électrique, le voltage des dispositifs d'alimentation radiaux augmente.
L'importance d'un système de surveillance en ligne pour les principaux dispositifs d'alimentation dans les systèmes de distribution sera démontrée dans cette thèse. Il sera aussi montré que l'impédance mesurée sur le dispositif d'alimentation recèle un grand potentiel pour la surveillance en ligne des dispositifs d'alimentation.
L'apport principal de cette thèse est d'établir de modèle mathématique à l'état stable pour définir la zone de surveillance dans le plan R-X. Il sera montré que l'impédance apparente a un bon potentiel pour surveiller le facteur de puissance du distributeur, le flux de courant inversé, le flux de courant actif et le flux de courant réactif. En outre, il sera démontré qu'une courbe de puissance complexe peut être transférée au plan R-X pour surveiller la composante de puissance réactive imposée par la réglementation des services publics liée à l'intégration des sources d'énergie renouvelables.
Mots-clés : Calcul d'impédance, flux de puissance, sources d'énergie renouvelables, système
AN IMPEDANCE BASED METHOD FOR DISTRIBUTION SYSTEM MONITORING
Hashem MORTAZAVI <ABSTRACT>
The main goal of this thesis is to propose a new monitoring technique for traditional distribution system with integration of renewable energy source. The traditional distribution network is primarily composed of radial feeders, designed for unidirectional power flow. Therefore, many operation regulation, protection and control system, in distribution network, are based on the radial distribution systems assumption.
The high penetration of the renewable energy sources, will clearly impact the distribution systems operation. Unlike other ways of electricity generation renewable energies initiate some challenges for grid operation. Intermittency of renewable energies sources, power system protection, stability, security, economic dispatch, optimal power flow are critical issues initiated by renewable energies penetration to power systems.
In addition, the renewable energy source output may exceed the consumed power during the day. Therefore, the direction of the power flow can be reversed during some periods. The high penetration of decentralized renewable sources will create a multidirectional power flow condition in the distribution grid, which was originally designed for unidirectional power flow only. Following of this reverse power flow, the distribution feeder voltage rises.
In this thesis the necessity of online monitoring system for important feeders in distribution system will be shown. It will be shown that the apparent impedance measured on the feeder has great capabilities for on line monitoring of distribution feeder.
The thesis establishes the steady-state mathematical model for defining the monitoring zone in R-X plane as the main contribution. It will be shown that the apparent impedance has a good potential for monitoring of feeder power factor, reverse and forward active and reactive power flow. In addition, it will be shown that complex power curve can be transferred to R-X plane to monitor the reactive power requirement regulation issued by utilities for RES integration.
Keywords: Distribution System, Impedance Calculation, Monitoring, Power Flow,
TABLE OF CONTENTS
Page
INTRODUCTION ...1
CHAPITRE 1 LITERATURE REVIEW ...7
1.1 RES integration impacts on power flow and Voltage control ...7
1.2 Proposed method in the literature for detection of power flow variation and voltage control at high penetration of RES and DG ...11
1.3 Literature review in distribution system monitoring ...16
1.4 Distribution system monitoring necessity ...18
1.5 Conclusions of literature review and refining the problematic ...19
CHAPTER 2 A Monitoring Technique for Reversed Power Flow Detection with PV Penetration Level………...………21
2.1 Introduction ...22
2.2 Measured Impedance Theory and Its Application on Reverse Power Flow ...24
2.2.1 Theory of impedance method ... 24
2.2.2 Apparent impedance relationship with power flow direction ... 28
2.2.3 Impedance measurement ... 30
2.3 Case Study ...31
2.4 Simulation Result and Discussion ...33
2.4.1 Impact of PV penetration Level on measured impedance ... 33
2.4.2 Impedance variation due to normal load deviation ... 38
2.4.3 Analyzing the impact of unbalanced distribution system on the measured impedance ... 39
2.4.4 Impact of load power factor variation ... 42
2.4.5 Impact of non-unit power factor operation of PV inverter ... 43
2.4.6 Investigating the measured impedance trends during fault ... 45
2.4.7 Analyzing the capability of proposed method for fast transients ... 47
2.5 A practical application of impedance method ...49
2.6 Conclusion ...55
CHAPTER 3 An Impedance Based Method For Distribution System Monitoring….….57 3.1 Introduction ...58
3.2 Distribution system monitoring necessity ...60
3.3 Measured impedance trajectory and power flow ...62
3.3.1 Impedance measurement ... 62
3.3.2 Mapping between P-Q and Z plane ... 63
3.3.3 Special Cases ... 66
3.3.3.1 Minimum forward reactive power flow limitation ... 67
3.3.3.3 Fixed power factor ... 69
3.4 Case Study ...70
3.5 Simulation Result and Discussion ...71
3.5.1 Reverse power flow detection ... 71
3.5.2 Monitoring the feeder PF ... 76
3.6 Practical implementation of monitoring method ...79
3.7 Conclusion ...84
CHAPTER 4 A Modified Load Encroachment Technique for Power Factor …..……… 87
4.1 Introduction ...88
4.2 Impedance relay Theory and Its relationship with Load Encroachment Technique ....91
4.2.1 Impedance measurement ... 91
4.2.2 Current infeed due to DG integration ... 92
4.2.3 Distance relay Load Encroachment scheme ... 95
4.2.4 Relationship between R-X plane and P-Q plane ... 97
4.3 Load Encroachment Monitoring Technique ...98
4.3.1 Analyzing the power factor variation reasons ... 99
4.3.2 Fixed power factor line mapping from P-Q plane to R-X plane ... 100
4.3.3 Modified Load Encroachment Monitoring Technique ... 101
4.4 Case Study ...102
4.5 Simulation Results and Discussion ...104
4.5.1 Impedance and power factor trend due to normal load deviation ... 104
4.5.2 The feeder PF monitoring with RES integration ... 107
4.6 Conclusion ...113
CONCLUSION…. ...115
LIST OF BIBLIOGRAPHICAL ...127
LIST OF FIGURES
Page
Figure 1.1 Voltage profile at presence of PV ...8
Figure 1.2 One line diagram for an illustration of the voltage drop in a distribution system ...9
Figure 1.3 Simple two node radial distribution system ...10
Figure 1.4 Voltage profile at different feeders at presence of PV ...12
Figure 1.5 Schematic of a simplified solar- HPHW system ...14
Figure 2.1 Simple system schematic, the impedance measuring unit ...25
Figure 2.2 Mapping of Power Flow Direction on R-X Diagram ...30
Figure 2.3 Schematic of the IEEE 13 Node Test Feeder ...32
Figure 2.4 Active power flows through feeder 650-632 and Bus 632 ...33
Figure 2.5 Measured R and X vs penetration level at bus 632-phase B ...34
Figure 2.6 Measured R and X vs Penetration Level at bus 680 ...35
Figure 2.7 Measured impedance at Bus 632, 671 and 680 for PV installed at ...37
Figure 2.8 The normalized load patterns of residential loads ...38
Figure 2.9 Three-Phases measured impedance at Bus 632 for ...39
Figure 2.10 Three-Phases measured impedance at Bus 632 ...40
Figure 2.11 Unbalanced voltage effects on 3-Phases ...41
Figure 2.12 Measured impedance at Bus 632, 671 and 680 for PV installed at Bus ...42
Figure 2.13 Measured impedance at bus 632- Phase A, ...43
Figure 2.14 Measured impedance at bus 632-phase A for ...44
Figure 2.15 Measured impedance at bus 632 for 3phase to ground fault at bus. ...46
Figure 2.17 The Voltage and active power variation at bus 632 ...48
Figure 2.18 Cloud transients impact on measured R at bus 632 ...50
Figure 2.19 Cloud transients impact on measured X at bus 632 ...51
Figure 2.20 Cloud transients impact on measured impedance at Bus 632 ...51
Figure 2.21 IEEE 34 Node Test Feeder. Nine 200 kW PV unit installed at yellow buses. The location and direction of four impedance measuring units are shown by red arrow ...52
Figure 2.22 Cloud transients impact on measured impedance (for phase A) ...53
Figure 2.23 Alarm issued for reversed active power at different buses (Phase A) ...54
Figure 2.24 Alarm issued for reversed active and reactive power ...55
Figure 3.1 Simple two source system power flow ...63
Figure 3.2 Measured impedance trajectories for active and ...65
Figure 3.3 Defined minimum active andreactive power ...67
Figure 3.4 Measured impedance trajectories for active and ...69
Figure 3.5 Schematic of the IEEE 8500 Node Test Feeder ...72
Figure 3.6 All feeder active and reactive power based on the distance from ...73
Figure 3.7 Measured impedance at Bus 632 for ...75
Figure 3.8 IEEE 8500 node test feeder power flow direction for PL=100%. ...76
Figure 3.9 IEEE 8500 node test feeder power factor variation. The blue spectrum feeder shows the lagging (capacitive) pf>1 and the red spectrum shows the leading (inductive) pf<1. The PV units’ location are shown by Orange stars ...78
Figure 3.10 Alarm issued for detecting over excited and under excited ...79
Figure 3.11 Reactive power capability requirement for AESO ...80
Figure 3.12 AESO reactive requirement curve mapped to R-X plane. The hatched area shows the mapped area correspond to dynamic range operation while P≤ 1pu ...81
XV
Figure 3.14 The output of three phase impedance measuring unit plot ...84
Figure 4.1 Simple distribution feeder with a DG and fault located ...93
Figure 4.2 Load-encroachment characteristic ...96
Figure 4.3 The modified load encroachment scheme ...101
Figure 4.4 Schematic of the IEEE 8500 Node Test Feeder. ...103
Figure 4.5 The normalized load patterns of residential loads ...104
Figure 4.6 All feeder active and reactive power based on the distance from substation (snapshot of t=24 h) ...105
Figure 4.7 Phase-A measured impedance at four ...106
Figure 4.8 Phase-A measured PF at four measuring point ...107
Figure 4.9 IEEE 8500 node test feeder power factor snapshot. The blue spectrum feeder shows the lagging (capacitive) pf>1 and the red spectrum shows the leading ...108
Figure 4.10 The normalized sun irradiation patterns on the PV units ...109
Figure 4.11 The measured impedance variations due to the effect of ...110
Figure 4.12 The PF variation due to the effect of sun irradiation patterns on the PV units ...111
Figure 4.13 Alarm issued for PF beyond of the pre-defined limit, ...112
LIST OF ABREVIATIONS
AESO Alberta Electric System Operator
APC Active Power Curtailment
CP Custom Power Devices
DG Distributed Generation
DSIF Demand And Supply Interface DSTATCOM Distribution-STATCOM
DSO Distribution System Operator
EIA U.S. Energy Information Administration
GHG Green House Gas
IEA International Energy Agency HPWH Heat Pump Water Heaters
LDC Line Drop Compensation
kWp Killowatt peak
MV Medium Voltage
OECD The Organization For Economic Co-Operation And Development
PF Power Factor
PL Penetration Level
PCC Point Of Common Coupling
POI Point Of Interconnection
PV Photo Voltaic
RES Renewable Energy Source
SVC Static Var Compensator
INTRODUCTION
Electricity is the easiest source of energy that is used in modern society. More population, fast rate of economic growth and urbanization increase the electricity consumption. High security of supplying electricity is vital for every country in the new world, then increasing and diversifying energy sources are the main goal of governments. After the oil shocks of the 1970s, most of OECD (Organization for Economic Co-operation and Development) started focusing in developing alternative sources of energy. Atomic energy, bio alcohol, biodiesel, biofuel, biogas, biomass, wind, solar, geothermal are some of those alternative sources of energy. Global world weather warming and climate change are the main reasons of popularity of low-carbon technology. Low-carbon economic or Decarbonized Economy refers to an economy that has a minimal output of Green House Gas (GHG) emissions into the environment biosphere.
As renewable energies considered as low–carbon solution for electricity generation, they become popular in last decade. Sunlight, wind, rain, tides, waves and geothermal heat, are the most important sources of renewable energy. Therefore, most countries have an outlook for integrating new source of electricity generation to their electric grid. Unlike other ways of electricity generation renewable energies initiate some challenges for grid operation. Integration of intermittent RES, like solar and wind into a radial and unidirectional power flow distribution system, implies incorporating new monitoring devices that are sensitive to rapid changes of RES generation and power flow direction.
In this thesis, an impedance based technique is proposed as a monitoring tool in distribution systems. The performance of impedance seen at number of buses as a monitoring technique is analyzed in presence of RES devices. In this chapter, the motivation for this work along with the related objectives and challenges are described. The contributions of this workin the field of Electrical Engineering are listed. Finally, the organization of thesis is presented.
Motivation and Challenges
The traditional distribution network is primarily composed of radial feeders, designed for unidirectional power flow. Therefore, many operation regulation, protection and control system, in distribution network, are based on the radial distribution systems assumption.
The high penetration of the RESs & DGs, will clearly impact the distribution systems operation. Unlike other ways of electricity generation renewable energies initiate some challenges for grid operation. Intermittency of RE sources, power system protection, stability, security, economic dispatch, optimal power flow and etc. are critical issues initiated by RE penetration to power system.
In addition, the RES output may exceed the consumed power during the day. Therefore the direction of the power flow may be reversed during some periods of time. The high penetration of decentralized renewable sources will create a multidirectional power flow condition in the distribution grid, which was originally designed for unidirectional power flow. The distribution feeder voltage rises in consequence of reserve power flow Analyzing the impact of high penetration of RES in distribution system power flow and proposing a power flow monitoring technique is the main subject of this thesis.
Thesis Objective
It has been shown that RES connection to distribution grid may change the power flow direction and increase the voltage at the connection point; therefore, the theory that voltage is always lower with increasing distance from the substation is no longer valid in distribution system with RES integration. This voltage fluctuation along the feeder brings new challenges to the operation regulations of distribution grids. The main premise of this thesis is that; direction and magnitude of power flow are the main factors in distribution system operation, protection and voltage regulation in presence of RES. Therefore, if we can find a parameter
3
that be sensitive to active and reactive power flow variation then we can propose a power flow monitoring technique for distribution system with high RES penetration. The general research objective of this work are as follows:
• Proposing a power flow monitoring technique for distribution system with the RES integration.
The specific research objectives of this work are as follows:
• Reviewing the forward and reverse power flow side effects in distribution system operation;
• Finding an index sensitive to power flow variation ;
• Defining the monitoring zone for power factor, active and reactive power flow monitoring.
We put a constraint in our research objective as follow:
• Applicability of the proposed method for the traditional distribution system and smart grid.
Thesis Contributions
The major contributions of this thesis are listed below:
A Monitoring Technique for Reversed Power Flow Detection with High PV Penetration Level
A monitoring application based on the calculated apparent impedance is proposed for reversed power flow detection. It is shown that the apparent impedance has considerable capability to be used as a monitoring technique for reverse power flow detection at any condition. The proposed mathematics show that any point (r, x) on the R-X coordinates plane is in one-to-one correspondence with a point (p, q) in the P-Q coordinates plane. The main contribution of the work is based on calculated impedance that has high capability for detecting different states of distribution system in presence of various RES penetration
levels. The results indicate that any proposed monitoring technique shall have the capability of monitoring for balanced and unbalanced system (Mortazavi et al., 2015b).
An Impedance Based Method for Distribution System Monitoring
The steady-state mathematical model for defining the monitoring zone in R-X plane is established as one of the main contributions of this thesis. It will be shown that the apparent impedance has a good potential for monitoring of feeder power factor, reverse and forward active and reactive power flow.
An Impedance Based Method for Wind Farm Reactive Power Requirement Monitoring
In order to reliable operation of power system, the generating units must comply with certain reactive power requirement depending on the network they are connected. Although many of existing interconnection regulations have been based on traditional generating units’ capabilities, the increasing rate of RES integration forces the power system regulators to consider variable type of generation in their standards and practical procedures. Therefore, it will be shown that complex power curve can be transferred to R-X plane to monitor the reactive power requirement regulation issued by utilities for RES integration.
Application of Distance Relay for Distribution System Monitoring
Based on the interconnection standard, by RES integration to distribution system, utilities need to install distance relay as the main feeder protection device. It will be shown that the so called distance relay as a protection device has the capability to monitor the RES integration to the feeder. The results indicate that a one-phase distance relay not only reacts to fault in its defined zone, but also can monitor the feeder for different PV penetration level and load variation (H. Mortazavi, 2015.).
A Modified Load Encroachment Technique for Power Factor Monitoring
A new application of distance relay load encroachment technique is proposed for power factor monitoring. During the heavy load conditions, the load encroachment of impedance into the distance relay protection zones is a well-known reason for distance relay mal-operation. Therefore, all the modern digital distance relays are equipped with the load
5
encroachment scheme which prevents the mal-operation of relay during the heavy load conditions. This thesis proposes the idea of using the load encroachment scheme of distance relay for monitoring purpose in presence of RES integration.
Thesis Organization
In the present research, application of an impedance based monitoring technique for distribution system monitoring is studied. In Chapter 1 a literature review of the impact of RES integration on the feeder power flow and the necessity of the feeder monitoring are presented. A monitoring technique for reversed power flow detection with high PV penetration level are presented in Chapter 2. Chapter 3 discusses the idea of an impedance based method for distribution system monitoring. In Chapter 4, application of distance relay for distribution system monitoring is presented and the modified load encroachment idea is introduced. Finally, a conclusion of the thesis is provided.
CHAPITRE 1 LITERATURE REVIEW
The traditional distribution network is primarily composed of radial feeders, designed for unidirectional power flow. Therefore, many operation regulation, protection and control system, in distribution network, are based on the radial distribution systems assumption. The high integration of the RES, will clearly impact the distribution systems operation.
In this chapter, the impacts of RES integration to the distribution system operation are explained. Then, the necessity of distribution system monitoring is explained.
1.1 RES integration impacts on power flow and voltage control
This section focuses on the main impacts of RES integration on distribution system power flow and the feeder voltage control. Traditional distribution system was designed radially with unidirectional power flow. The voltage drop is one of the main concerns of traditional distribution system design.
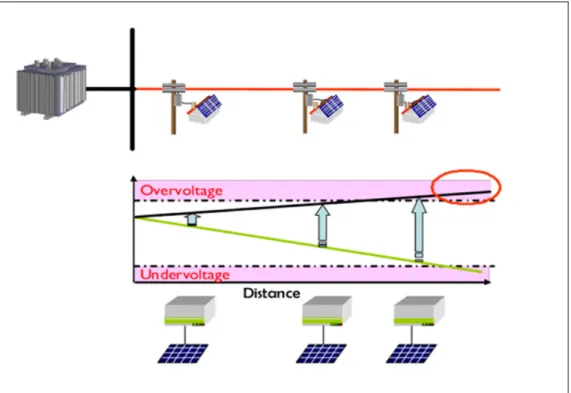
Meanwhile as the voltage decreases from the substation to the end of the feeder, the probability of over-voltage occurrence is relatively small. Increased integration of DGs and RES in last decade has changed this phenomenon and the probability of over-voltage occurrence especially at the end of radial feeder increases. Consequently the voltage rise; due to the increased penetration of DGS and RES, became the main limiting factor for their integration (Appen et al., 2013; Aziz et al., 2013; Demirok et al., 2011; Ehara, 2009; Turitsyn et al., 2010; Verhoeven, 1998; Viawan, 2008). Figure 1.1 shows the effect of injected power by PV on voltage profile of a feeder. The green line shows feeder voltage profile without PV. By adding the PV effect on voltage profile (black line) the voltage at end of feeder may exceed the over-voltage limit.
Figure 1.1 Voltage profile at presence of PV Adapted from Ehara (2009)
The main reasons of feeder voltage profile violation are the variation of both magnitude and direction of power flow.
A basic overview on voltage drop in a simple power system is shown in a single line diagram in Figure 1.2. In radial distribution systems, the voltage-drop effect is distinguished. Here the voltage simply decreases as moving from the substation (the power source, in effect) out toward the end of a distribution feeder. This variation in voltage is known as the line drop. The line drop is described by Ohm’s law, V =IZ, where I is the current flowing through the line, Z is the line’s impedance, and V is the voltage difference between the two ends. Ohm’s law also shows us that the line drop depends on the connected load, since a greater power demand implies a greater current.
While the line impedance stays the same, the voltage drop varies in proportion to the load. In practice, the voltage drops in distribution systems are quite significant, especially for long
9
feeders. Recognizing that it is physically impossible to maintain a perfectly flat profile, operational guidelines in the United States generally prescribe a tolerance of ±5% of the nominal voltage. This range applies throughout transmission and distribution systems, down to the customer level. For example, a customer nominally receiving 120 V should expect to measure anywhere between 114 and 126 V at their service drop.
For any feeder of figure 1.2, the current as a function of the line complex apparent power = + and the load voltage will be
= −∗ (1.1)
Figure 1.2 One line diagram for an illustration of the voltage drop in a distribution system The voltage drop on the feeder i is given by
∆ = − = ( + ) ∗ −∗ (1.2)
∆ = ∗ +∗ ∗ + ∗ ∗ −∗ ∗ (1.3)
For a small power flow, the voltage angle between and in (1.2) is small, so the imaginary part of (1.3) can be neglected, therefore; the voltage drop can be approximated by
∆ = ∗ +∗ ∗ (1.4) From Equations (1.3) - (1.4), it can be seen that the load current always causes a voltage drop and the voltage profile in conventional radial distribution systems (without integration of DG and RES) is decreasing towards the end. This voltage drop and voltage profile is the basis for voltage regulation in power systems. The transformer secondary voltage can be adjusted by changing the voltage ratio of the transformer, meanwhile the voltage drop on the feeder can be reduced by compensating the reactive power demand using shunt capacitors; which will be explained hereafter.
A simple two node radial distribution system is shown in Figure 1.3. If we conclude the RES or DG power production to formula (1. 4) and calculate the voltage drop along the feeder we will reach to formula (1.5).
Figure 1.3 Simple two node radial distribution system
∆ = − = (− + ) + (± + ) (1.5)
From this formula it is clear that different active and reactive power production of DG may produce a change in the power flow. By reversing the power flow direction there is a negative voltage drop along the feeder which is the main cause of over-voltage at the end of feeder in presence of any type of power generation.
11
1.2 Proposed method in the literature for detection of power flow variation and voltage control at high penetration of RES and DG
Verhoeven et al. in (Verhoeven, 1998), is one of the first authors who addressed the problems of PV penetration to power system, in 1998. In (Verhoeven, 1998), different problems initiated by PV integration are discussed such as harmonic, multiple inverters, overvoltage, protection and etc. The report emphasized on reverse power flow problem and in consequence voltage rise due to high penetration of PV. The report proposed two methods as solutions. The first recommended technique in (Verhoeven, 1998) is operation of PV system at the leading power factor. By operation at leading power factor of PV inverter, the feeder voltage raise will be regulated without decreasing the active power output of PV. The report (Verhoeven, 1998), mentioned that the effectiveness of leading factor operation of inverter is restricted by X/R ratio of feeder. If the reactance of feeder is very low in comparison of feeder resistance, feeder voltage regulation needs a huge amount of reactive power. When the feeder voltage rise cannot be compensated by leading power factor, the second recommended method is decreasing the active power output of system.
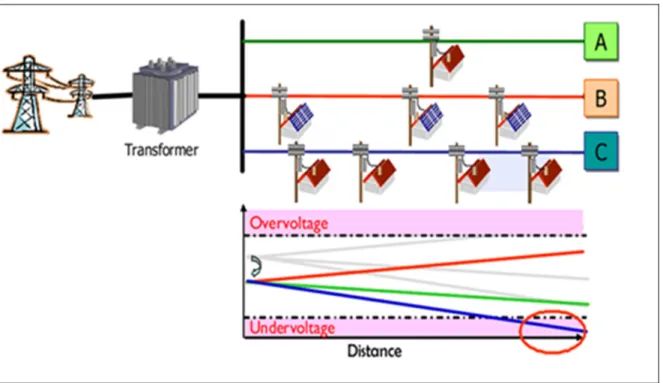
Based on the newest report published by Task 10 of “Photovoltaic Power Systems Program” of International Energy Agency (IEA) (Ehara, 2009), the over-voltage and under-voltage are the biggest barriers to high PV penetration in the distribution system. Figure 1.1 shows the problem of parallel line voltage regulation by MV transformer tap changer. In (Ehara, 2009) it was proposed that, it is possible to regulate the feeder voltage, and keep it in boundaries by decreasing the sending-end voltage controlled by MV transformer tap changer. The main problem of this method is when there are parallel lines with different PV penetration level.
As it can be seen from Figure 1.4 by decreasing the tap step of tap-changer, the feeder with no PV or any other source of DG will suffer the under-voltage at the end of the feeder. Based on the (Ogimoto et al., 2013) in Japan, they designed a power conditioner system for PV that will decrease the active power output of PV to control the voltage. The main disadvantage of
this system is lower PV system efficiency. Furthermore in a distribution line, among all users, the PV systems which located at the end of the line tend to be more restricted with higher priority.
Figure 1.4 Voltage profile at different feeders at presence of PV Adapted from Ehara (2009)
Active power curtailment (APC) is another popular option for voltage regulation in presence of RES. Although most of electric utilities and countries did not have any PV integration standard, Germany and Japan published their minimum requirement for this purpose (Appen et al., 2013; Ogimoto et al., 2013). In Japan the PV owner must curtail generation when the balance limit of demand – supply exceeded (Ogimoto et al., 2013).
In Germany the owner of small PV system (less than 30 Killowatt peak (kWp)) must decrease the generation output by 70 percent or install a remote control system operated by distribution system operator (DSO). For bigger system, installation of remote control system is mandatory (Appen et al., 2013).
13
Paper (Tonkoski, Lopes et El-Fouly, 2011b) proposed a droop based APC to prevent over-voltage at distribution LV feeders. Voltage droop control by virtual impedance method is presented in (De Brabandere et al., 2004). In this method the system voltage is measured then output power of PV system controlled based on this value. Because of the intermittency characteristic of RES and daily load variation, the possibility of voltage violation on LV feeders increases. Therefore if the DSO wants to regulate the voltage by the active power curtailment technique, the total power generation of PV system, the total energy delivered to network over one year and the total efficiency of PV system will be decreases. Therefore considering the annual sales of PV power, the financial output of RES become less and less.
According to (Ehara, 2009; Verhoeven, 1998), the reverse power flow is the main cause of voltage rise in distribution feeders. Therefore, some papers for voltage control of feeder focus on controlling the reverse power flow as a main solution. For this purpose, different methods such as demand side management (Asari et Kobayashi, 2012; Hatta, Uemura et Kobayashi, 2010; Inoue et Iwafune, 2010), SVC (Daratha, Das et Sharma, 2013), STATCOM (Aziz et al., 2013), DSTATCOM (Chen et al., 2013; Kun et al., 2012; Lin et al., 2012), storage system (Nykamp et al., 2013; Schoenung et Hassenzahl, 2003) , Electric Vehicle (Byung-Kwan et al., 2013; Kim, Kirtley et Norford, 2013; Tuffner et al., 2012) and SMES (Byung-Kwan et al., 2013) were proposed in recent papers.
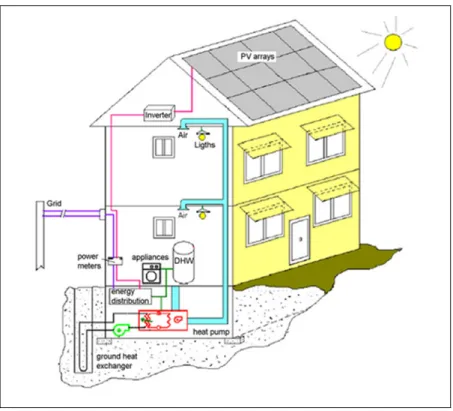
If the total or most of RES or PV output can be consumed at the point of production, there will be less voltage violation on feeders. This theory is basis of customer load management. Based on this method the customer load will be managed cooperatively in accordance of RES output. Heat pump water heaters (HPWHs) are one of the instruments that are used for consumer load management (Asari et Kobayashi, 2012; Hatta, Uemura et Kobayashi, 2010; Inoue et Iwafune, 2010).
A heat pump (HP) is a machine that uses the mechanical principal of a refrigeration cycle to transfer heat from a source to other (Hepbasli et Kalinci, 2009). The HP can be used for air conditioning (cooling in summer and heating in winter). Figure 1.5 shows the schematic of a
simplified solar- HPHW system. As it can be seen the solar power produces the electricity needed for heat transfer.
Figure 1.5 Schematic of a simplified solar- HPHW system Adapted from Hepbasli et Kalinci (2009)
Authors in (Asari et Kobayashi, 2012; Hatta, Uemura et Kobayashi, 2010; Inoue et Iwafune, 2010) proposed using HPWHs for reducing the reverse power flow and consequently decreasing the voltage deviation due to PV production.
The simulation results of (Inoue et Iwafune, 2010), showed that daylight operation of HPWH can decrease the reverse power flow considering the hot water demand of consumer. Hatta et al. (Hatta, Uemura et Kobayashi, 2010) showed HPWH can reduce the size of storage system and the SVC for controlling the feeder voltage. (Asari et Kobayashi, 2012) proposed a distribution line management which minimizes the PV output to feeders by increasing the power demand of consumer. They defined a demand and supply interface (DSIF), which
15
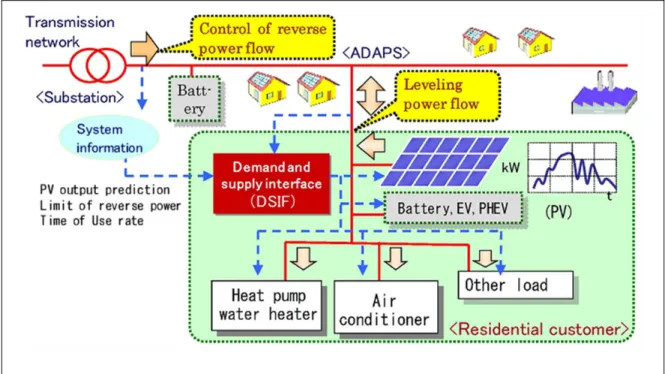
plans the operation of HPWH, battery storage and PV output. Figure 1.6 shows the schematic diagram of DSIF for controlling reverse power flow of PV generation system.
Figure 1.6 Schematic diagram of controlling reverse power flow of PV generation system Adapted from Asari and Kobayashi (2012)
(Wei-Fu, Shyh-Jier et Chin, 2001) proposed a hybrid photovoltaic and battery energy storage system as demand side management technique. The recent report published by U.S. Department of Energy (Tuffner et al., 2012), proposed utilizing Electric Vehicle in distribution system in order to control the reverse power flow, maintain voltage in its boundaries and to assist higher penetration level of PV generation to distribution system.
Based on IEEE 1547 standard (Basso et DeBlasio, 2004), distributed generation do not currently allow for voltage regulation (they must operate at unity power factor). In spite of that standard, there are a lot of recent papers and reports which propose using reactive capability of inverter based DGs for regulating the voltage at the point of common coupling (PCC) (David Smyth; Farivar et al., 2012; Liu et Bebic, 2008; Tonkoski, Lopes et El-Fouly, 2011b; Turitsyn et al., 2010; Ueda et al., 2008).
Liu et al. in report published by NREL (Liu et Bebic, 2008), investigate the role of PV inverters capabilities in feeder voltage regulation which is beyond the IEEE 1547 requirements. They analyzed different PV penetration levels effect on voltage regulation in distribution system. Their results showed that at a medium PV penetration level (10%), inverter voltage support can help reduce the size of the voltage support capacitors by nearly 40% and at high PV penetration levels (30%–50%), PV inverters might entirely displace voltage support capacitors.
For mitigating of the rapid and fast voltage fluctuation due to high penetration of PV and resulting reverse power flow; (Farivar et al., 2012) proposes using the fast time cycle of inverter for reactive power flow control in comparison of traditional slow timescale Volt/Var control. They solved a radial optimal power flow which minimizes line losses with constraints on voltage magnitudes. (Liu et Bebic, 2008) showed that if we choose the size of inverter 110% of its nominal power, its reactive capability increases near 46%. Considering all the good aspect; in addition of contrasting with DG integration standard (IEEE 1547), the bigger size of inverter and more complex control system are the main disadvantages of using inverter capability for voltage regulation at high penetration of PV.
To sum up, it was shown that the feeder power flow changes not only by the time and feeder loads variation but also by RES integration. In addition, it was shown that the feeder power flow variation has a substantial impact on the feeder voltage control and operation. In the next section the currnet proposed monitoring system in the literature will be pressented. Moreover, the reasons and neccissity of the monitoring devices for distribution feeders will be discussed.
1.3 Literature review in distribution system monitoring
Widespread real-time monitoring of distribution system, because of the high number of feeders and lack of the communication system was impossible for a long time. By decreasing the price of communication system, full deployment of smart meters seems applicable for
17
implementing the smart grid in distribution system level. Monitoring of a distribution system due to its time varying and unbalanced loading, through smart meters and monitors is one of the basis of smart grid (Tcheou et al., 2014). Different monitoring system approaches and devices have been proposed to assess different conditions of distribution systems. Power quality monitoring system has been used for a long time not only for analyzing power quality issues but also for load modeling (Visconti et al., 2014). (Qiang et al., 2012) proposed a voltage monitoring for micro grid application, to analyze the power quality and reliability indices. Using state estimation technique is one of the most popular solutions proposed in the literature for distribution system monitoring. The authors in (Bernieri, Liguori et Losi, 1995) proposed using the on-line system modelling capability of artificial neural network (ANN) for distribution system state estimation. The application of branch current state estimation method has been proposed in (Baran et Kelley, 1995),(Baran, 2012) for real time monitoring and control of a distribution feeder. Authors in (Ferdowsi et al., 2014) proposed an ANN based monitoring system for better voltage magnitudes estimation of distribution feeder in presence of distributed generation (DG). (Powalko et al., 2009) proposed to use phasor measurement units (PMU) for improved distribution system state estimation.
The renewable energy sources network integration affects the traditional Volt-VAR control, power factor correction and voltage regulation (Bollen et Hassan, 2011). The impacts of high PV penetration on distribution system protection and operation were analyzed in (Baran et al., 2012). Unidirectional power flow was the first design criteria for distribution system planning for decades. Under this assumption the voltage profile is maximum at the feeder head and decreases proportional with loads to the end of the feeder (Kersting, 2012). Depending on the size and location of variable generation and the load size, the power flows may reverse in the feeder [2]. Therefore, the current distributions system vulnerability increases by RES generation. The high RES penetration increases the necessity of deployment of monitoring devices for different purposes.
1.4 Distribution system monitoring necessity
As it was stated in the introduction, contrary to transmission systems, due to high number of feeders and elements, distribution systems suffers lack of sufficient monitoring devices. In this section some challenges which raise the necessity of deployment of monitoring units in distribution network will be presented briefly.
• Distribution systems have been designed for radial and unidirectional power flow. In this design the active and reactive power are transferred from the transmission system to consumers. Therefore, many protection and voltage regulation strategies in distribution networks are based on radial nature. For example, voltage regulators are designed with the flow of power from the higher voltage to the lower voltage. Integration of the RES to distribution systems, however, shows that based on the size and the installation location, the power flow may reverse (Jahangiri et Aliprantis, 2013). For high penetration of RES, traditional unidirectional distribution system will change to bidirectional system which needs a revision of regulation;
• The minimum voltage drop which must be kept within the standard limits was the main concern of distribution system planners for a long time. On the other hand, the feeder overvoltage was not a concern for distribution system design. With RES integration the over-voltage possibilities become one of the main design concerns (Bollen et Hassan, 2011);
• From a practical standpoint the real distribution system has non-uniform load distribution, distributed load location and different wire sizes. The designer considers increased wire size for contingency-support branches during special situations (Short, 2014). Distributed RES integration with intermittent characteristic increases the vulnerability of small wire size feeder to overload conditions;
19
• In addition, in a unidirectional power flow design philosophy, the designer considers feeder load balancing through opening and closing switches at different locations, as an economical solution regarding the load growth over the time. Due to changing the switch patterns, the distribution network configuration is a dynamic variable (Willis, 2010). The RES generation will increase dynamic characteristic which justifies the capital cost needed to deploy new monitoring techniques;
• Moreover, Volt-VAR control, power factor correction and voltage regulation are important elements for increasing the distribution system efficiency in operation. Reactive power flow on a feeder decreases its active power flow capacity and increases both the voltage drop and loss. In a unidirectional distribution network, even feeders with in-range power factor correction at the substation have portions that are not well corrected (particularly at the feeder's end, where the power factor is much lower) (Short, 2014). The capacitor size needed to correct power factor during peak VAR conditions (during summer due to the high reactive loads of air conditioning system) may seriously over-compensate during off-peak conditions. A survey made by (Willis, 2010) indicated that slightly more than one-third of all switched capacitor banks were not switching properly due to mechanical failure, vandalism or weather conditions.
1.5 Conclusions of literature review and refining the problematic
Based on the equipment failures data and statistics, electric distribution systems, due to high number of feeders have the highest rate of customer supply unavailability (supply interruption) in power systems. In this section, it was argued that the modern distributions system vulnerability increases not only because of infrastructure aging, but also, because of RES generation. It increases the necessity of deployment of monitoring devices for different purposes. Widespread real-time monitoring of distribution system, because of the high
number of feeders and lack of the communication system was impossible for a long time. By decreasing the price of communication system, full deployment of smart meters seems applicable for implementing the smart grid in distribution system level. Monitoring of distribution system due to its time varying and unbalanced loading, through smart meters and monitors is one of the basis of smart grid. In the next chapter it will be shown that the apparent impedance measured on the feeder has great capabilities for on-line monitoring of distribution feeders
CHAPITRE 2
A Monitoring Technique for Reversed Power Flow Detection with High PV
Penetration Level
Hashem Mortazavi1, Hasan Mehrjerdi2, Maarouf Saad1, Serge Lefebvre3, Dalal Asber3 and Laurent Lenoir3
1Department of Electrical and Computer Engineering, Ecole de technologie supérieure, 1100 Notre-Dame West, Montréal, Quebec, Canada H3C 1K3
2Qatar University, Doha, Qatar
3The Research Institute of Hydro-Quebec (IREQ), Power Systems and Mathematics, Varennes, Quebec, Canada
This section has been published in IEEE Transactions on Smart Grid, vol.6, pp.2221-2232, 2015.
Abstract
The integration of renewable energy resources (RESs) in power systems poses many research challenges. Research shows that the RES output may exceed the consumed power during the day. Consequently, the direction of the power flow on distribution lines can be reversed during some periods. As the voltage regulator is normally designed for unidirectional power flow, this may cause voltage violations on the distribution feeder. Therefore, most utilities try to set a penetration level limit for safe operation. On the other hand, time varying and unbalanced loading are the main characteristics of distribution systems. Moreover, installation of intermittent and non dispatchable PV (photovoltaic) devices increases the control problems of distribution system. This thesis presents an impedance based monitoring method for detection of distribution system current behaviour. It will be shown that by utilizing this monitoring technique not only the small variation of PV penetration level can be easily detected but also some fast transients such as the effect of cloud movement on PV system can be monitored.
This monitoring technique employs only local measurements of bus voltages and line current to measure the apparent impedance seen at the installation point. The practical application of measured impedance as a monitoring technique shows its effectiveness for distribution system monitoring in presence of various PV penetration level.
2.1 Introduction
Deregulation of power system, smart grid, electric vehicle and renewable energy integration pose a lot of challenges to power systems operation. Although a lot of monitoring and protection devices are installed in transmission system due to its complexity, traditional distribution systems suffer lack of monitoring systems due to its high number of feeders and load points.
Distribution systems have been designed for radial and unidirectional power flows. In this design the active and reactive power are transferred from the transmission system to the consumer. Therefore, many protection and regulation strategies in distribution network are based on this radial nature. For example, voltage regulators are designed with the flow of power from the higher voltage to the lower voltage. Integration of the RES in distribution systems however shows that, based on the size and the installation location, the power flow may reverse (Jahangiri et Aliprantis, 2013). For high penetration of RES, traditional unidirectional distribution system will change to a bidirectional system which needs a revision of regulation.
According to (Yang et al., 2012) the reverse power flow is the main cause of voltage rise in distribution feeders. Customer load control is one solution for decreasing reverse power. Reference (Asari et Kobayashi, 2012) proposes that controlling heat pump water heaters (HPWH) at customer side will minimize reverse power flow and voltage violation resulting from high penetration of PV. (Baran et al., 2012) analyzes high PV penetration impacts on distribution system protection and operation. Using flexible AC transmission system (FACTS) and custom power (CP) devices (SVC (Daratha, Das et Sharma, 2013), STATCOM
23
(Aziz et al., 2013), DSTATCOM (Chen et al., 2013), SMES (Byung-Kwan et al., 2013)), utilizing electric vehicle (Goli et Shireen, 2014), storage system (Marra et al., 2014),(von Appen et al., 2014),(Taheri, Akhrif et Okou, 2013) and active power curtailment technique recommended in (Ogimoto et al., 2013),(Appen et al., 2013),(Tonkoski, Lopes et El-Fouly, 2011a) are the most attractive techniques to mitigate those expected voltage violations.
Monitoring distribution system through smart meters and monitors is one of the basis of smart grid (Tcheou et al., 2014). Different monitoring system approaches and devices have been proposed to assess different system conditions. Power quality monitoring systems have been used for a long time not only for analyzing power quality problems but also for load modeling (Visconti et al., 2014). (Qiang et al., 2012) proposes voltage monitoring of micro grid at number of buses to analyze the power quality and reliability indexes.
Using local data measurement for protection, control and monitoring purpose is an attractive alternate solution to the electric utilities, due to lower installation costs and simplicity of operation. On-line impedance measurement based on local data has been proposed for different applications. The most important application of impedance measurement is in distance relay protection (Shateri et Jamali, 2010). (Vu et al., 1999) proposes using local measured apparent impedance for voltage stability margin estimation. (Cespedes et Jian, 2014) proposes using online grid impedance measurement for adaptive control of grid connected inverters.
Integration of intermittent RES, like solar and wind into a radial and unidirectional power flow distribution system, implies incorporating new monitoring devices that are sensitive to rapid changes of RES generation and power flow direction. In this research, an impedance measuring technique is proposed as a monitoring tool in distribution systems. The performance of impedance seen at number of buses as a monitoring technique is analyzed in presence of RES devices. Due to unbalance loading of distribution system, it will be shown that any proposed monitoring technique shall have the capability for separate three phases
monitoring. The speed and stability of proposed monitoring technique is tested by simulation of important generation fluctuation of connected PV system due to clouds movement.
This chapter is organized as follows: in Section 2.2 the basic theory of impedance method for monitoring of distribution feeder with RES will be established. Section 2.3 describes the IEEE 13 node test feeder used as a case study for simulation. Section 2.4 presents the simulation results of testing the proposed method for unit and non-unit power factor operation of PV inverter, fault conditions, load power factor variation and cloud movement.The practical capability of method is validated by analyzing the impact of cloud transients on IEEE 34 node test system. Finally the conclusion is presented in Section 2.6.
2.2 Measured Impedance Theory and Its Application on Reverse Power Flow Detection
2.2.1 Theory of impedance method
Distance relay, typically, is the first choice for transmission line protection. In recent years, it was also proposed as a protection device in distribution system (Shateri et Jamali, 2010),(Chilvers, Jenkins et Crossley, 2005). Distance relays use voltage and current as inputs and calculate the apparent impedance seen at the relay location. This value is a complex number which shows the apparent impedance seen by V/I calculation. A quadrilateral characteristic-distance relay is proposed in (Chilvers, Jenkins et Crossley, 2005) to distinguish the distribution feeder faults in presence of forward and reverse power flow due to DG integration. (Uthitsunthorn et Kulworawanichpong, 2010) proposes using distance relays for distribution feeder protection with renewable power plants to reduce protection coordination complexity due to impedance based setting of distance protection. Although this relay is geared at fast and accurate detection of faults in power system, it was shown that this method has a very good capability to measure and analyze the load conditions (Roberts, Guzman et Schweitzer III, 1993).
25
When the amount of active and reactive power injected or absorbed varies at distribution system nodes, the node voltage and line current will change. To clarify the effect of load variation and RES integration on apparent impedance seen at any distribution system node, let consider the simple system shown in Figure 2.1.
Figure 2.1 Simple system schematic, the impedance measuring unit connected to sending-end of line connected to bus i
Consider that PLi and QLi are the total active and reactive power (line power and losses) flowing down from node i, Pi and Qi are the active and reactive power of load connected to node i, and Rsi+jXsi is the complex line impedance. Voltage drop (∆Vi) along the feeder
between nodes i and i+1; ∀ i=1,…,n, is defined as:
∆ = − = × (2.1)
= −∗ (2.2)
∆ = × +∗ × + [ × −∗ × ] (2.4) As shown in (2.4), the voltage drop along the feeder has real and imaginary parts. If the voltage of bus i+1 is considered as reference point, that = | |∠0 (this voltage is along the positive real axis), then from (2.1) and (2.4) the voltage at node i is obtained by (2.5).
= + × +∗ × + × × −∗ × (2.5)
If the and are defined as (2.6) and (2.7), the voltage at node i can be rewritten as (2.8).
= + × +∗ × (2.6)
= × −∗ × (2.7)
= + (2.8)
To calculate apparent impedance seen from node i:
= = −+
∗ (2.9)
= ∗× +
27
= ∗
+ (2.11)
= ( + ) × ( + ) (2.12)
= [( − ) + ( + )] (2.13)
For node i, let and be the active and reactive power of load, and be the active and reactive losses of the line and , denote the active and reactive generation of RES at node i, respectively. If there is no RES connected to that node it is assumed that =0, = 0. Therefore, we can define the transmitted power through each line of the distribution network as follow:
= + ( )+ ( ) (2.14)
= + ( )+ ( ) (2.15)
= ± (2.16)
= ± (2.17)
Then by substituting (2.14)-(2.17) in (2.13), it can also be expressed as:
= ( , , , , , ) (2.18)
From equation (2.18) it can be seen that the apparent impedance seen from node i is a function of line impedance, transmitted active and reactive power of line and the injected or
absorbed power at the node i and rest of the network. Therefore, the impedance seen at bus i can be used as a monitoring tool for analyzing the actual system situation.
2.2.2 Apparent impedance relationship with power flow direction
As it was stated earlier, voltage and current are two inputs of the method. The calculated positive sequence of voltage and currents are used for positive sequence impedance calculation. In this section, the relationship between the calculated impedance, magnitude and direction of active and reactive power flow through the line will be established.
Consider two consecutive buses i and i+1 in Figure 2.1, Zi is the apparent impedance seen on the i side of the line between those two consecutive buses; PLi and QLi are the active and reactive powers of the line flowing from side i to i+1, respectively; |Vi| is the amplitude of
the voltage at bus i.
Therefore the relationships between the measured R and X and the power transmitted through the lines are given below:
= ( )∗ = ( + )∗ (2.19) = = + ( + )∗ (2.20) = + + × | | (2.21)
29 = + × | | (2.22) = + × | | (2.23)
As it can be seen from (2.22) and (2.23), the position of measured apparent impedance in R-X plane depends on the value and direction of active and reactive power. The apparent impedance measured at bus i has reverse relationship with power. The larger the power transferred through the line, the smaller measured R and X.
The sign of Ri in (2.22) and Xi in (2.23) are only related to the sign (direction) of PLi and QLi, respectively. Then according to (2.14) and (2.15):
| | > ( )+ < 0 (2.24)
| | ≥ ( )+ < 0 (2.25)
Equations (2.24) and (2.25) show the conditions that the RES generation exceeds the consumption and the final location of the impedance seen at bus i on R-X plane will be at third quarter. For forward Q and reversed P the impedance location will be at the second part of R-X plane.
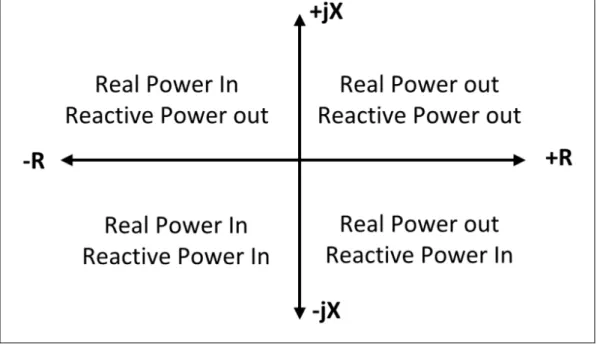
Based on the direction of active and reactive power flow the R-X diagram can be divided into four parts, Figure 2.2 shows the mapping of power flow direction on R-X diagram. Based on this figure, the impedance located on R axis represented a unity power factor and for X axis the power factor is zero. For the directions of active and reactive power are from node i to
Figure 2.2 Mapping of Power Flow Direction on R-X Diagram Adapted from Mason (1956)
2.2.3 Impedance measurement
Distance relay is the best tools for impedance measurement in power system. Because the positive sequence component is the only common sequence component in all the types of faults, the measured impedance at distance protection relays are always based on the phase positive sequence impedance. Moreover, the apparent impedance measured by a distance relay will depend on the current and voltage transformers connections too.
The measured impedance is calculated by three one-phase measuring units. The simplest ground distance functions use only a single phase current and a single phase voltage. Consider that is the phase A to ground voltage and IA is the current flows through the phase A conductor, the apparent impedance seen for phase A is given by (Hase, 2007):
31
The impedance calculated using (2.26) is the positive sequence impedance seen of the line for all system operation condition except fault conditions. Phase-ground distance relay usually employes a zero sequence current compensator for actual system impedance measurement during the fault conditions. Based on (Shateri et Jamali, 2009), all the phase-ground faults detection units measure the same impedance value for the non-fault conditions.
2.3 Case Study
The IEEE 13 Node Test Feeder (Figure 2. 3) is a very small but relatively highly loaded 4.16 kV feeders. This provides a good test for the most common features of distribution analysis software (Kersting, 2012). As this model has unbalanced spot and distributed load, overhead lines and cables, shunt capacitors and a voltage regulator consisting of three single-phase units, it is a good case for testing the impedance method capabilities. The simulations have been performed by OpenDSS (Dugan, 2012) software and Matlab (Guide, 1998). The OpenDSS COM server interfaced with the Matlab program is used for simulation.
Wind, photovoltaic, and biomass are the best choices for RES integration to power system. For large scale power production at transmission level the biomass system and wind turbine are the most obvious solutions. On the other hand, small-scale PV system is more attractive solution for residential installation. For RES integration to distribution system simulation, the PV system is chosen.
This research used the built-in PV system model provided in OpenDSS. Among two options for modeling high penetration of small-scale rooftop PV or large centralized PV, the second one was chosen for the simulation of impedance based monitoring system. Hence to produce various scenarios for simulations, the lumped three phases balanced PV model was added at three different locations, one close to substation source Bus 632, one near the feeder midpoint Bus 671 and one at the end of feeder at Bus 680. For showing the effect of PV location on the proposed monitoring technique at each simulation only one location was used for PV installation.
Figure 2.3 Schematic of the IEEE 13 Node Test Feeder
For simulation of different penetration level (PL), Hoke et al (Hoke et al., 2013) showed that the 15% limit for PL as a rule of thumb for most of feeders is very conservative. They showed that in two-thirds of simulated cases, the maximum PL is greater than 90%. In this research, to analyze the full capability of the monitoring technique, the PV output was increased from zero to 1.15 pu of model total load (P=3800 KW) with step size of 0.01 (115 different penetration levels). At each step, a power flow was done by OpenDSS and all voltages, currents, active and reactive power of feeder were saved. In this chapter, except the under-voltage and over-voltage limits, other limiting factors such as feeders current rating, the substation transformer capacity, power quality issues were neglected. The simulation has been performed for both unit and non-unit power factor PV operation. As the original model of IEEE 13 node test feeder does not have a load at bus 680 a 360kW and 270 kVAr load connected to this bus for simulation. A 3-phases 60 kVAr capacitor installed at Bus 680 for voltage regulation.
33
2.4 Simulation Result and Discussion
2.4.1 Impact of PV penetration Level on measured impedance
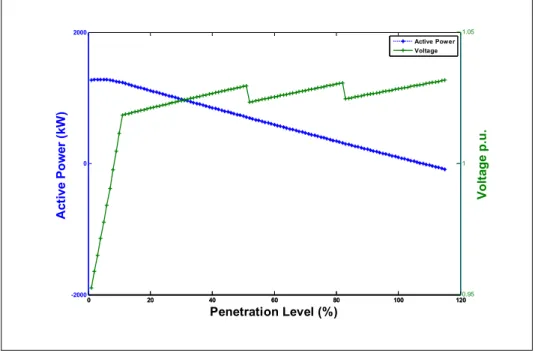
To show the impact of PV penetration level (PL) the lumped model of PV is connected to bus 680. Figure 2.4 shows the active power flows through feeder 650-632 and bus 632 voltage profile. As it can be seen, by increasing PL the active power flow from the source to grid decreases and the voltage increases. It is obvious that by increasing the PL the voltage increases, so the tap changer located between bus 650 and bus 632 operates two times to keep the voltage within the standard boundaries.
Figure 2.4 Active power flows through feeder 650-632 and Bus 632 voltage profile with active tap changer and PV is connected to bus 680
0 20 40 60 80 100 120 -2000 0 2000 Penetration Level (%) A cti ve P o w er (k W) 0 20 40 60 80 100 1200.95 1 1.05 Vo lt ag e p .u . Active Power Voltage
Figure 2.5 Measured R and X vs penetration level at bus 632-phase B with active tap changer
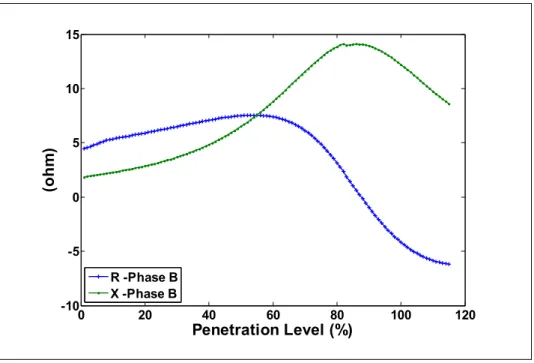
Figure 2.5 shows the measured R and X for different PLs at bus 632. As it can be seen by increasing PL, the R and X increase till PL=0.58 but after this point although X increases the R decreases. At PL=88% the R becomes zero and after this point the R goes negative corresponding the reversed active power. The reason for the decreasing R is related to the relationship between the measured R and total P and Q flows along the line. Based on equation (2.22) by decreasing the P -due to the increased PV penetration level- the measured R will decrease too.
As it can be seen from Figures 2.4 and 2.5, at the time of tap changing the measured impedance shows a little change. This illustrates that the proposed method is sensitive to small variations of voltage in the system.
Unlike at bus 632, the measured impedance at bus 680 has a different trend. As it can be seen from Figure 2.6 the measured R and X increases by increasing PV penetration level, but, when the active power direction is reversed, the value of R decreases and becomes negative.
0 20 40 60 80 100 120 -10 -5 0 5 10 15 Penetration Level (%) (ohm ) R -Phase B X -Phase B
35
This shows that we have reverse active power while the reactive power direction does not change (because the PV only operates at unity power factor). These graphs support the basic theory of proposed method described in part 2.1.2.
Figure 2.6 Measured R and X vs Penetration Level at bus 680
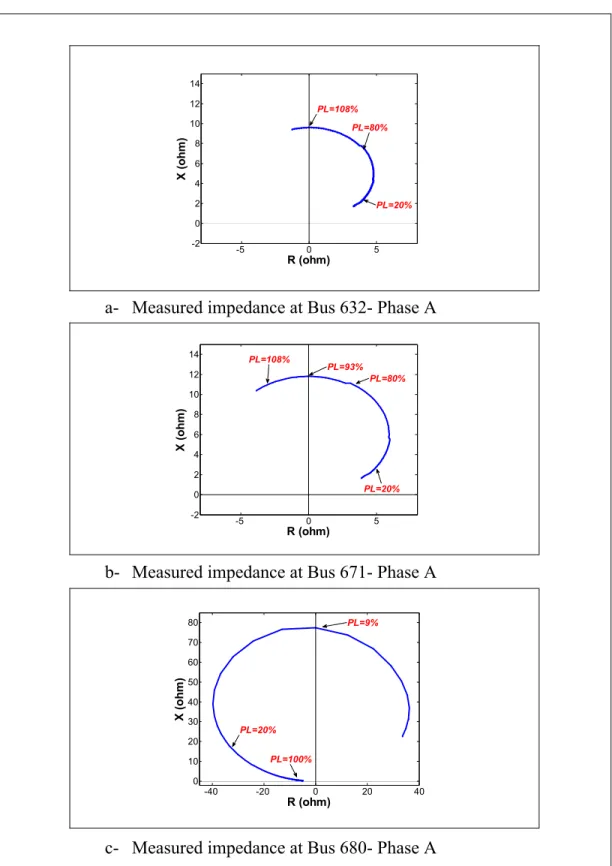
Figure 2.7 shows the measured impedance plotted on R-X plane three buses for PV connected at bus 680 and PL variation between 0 to 115% of nominal load.
Figure 2.7 shows the measured impedance loci of different measurement units. Figure 2.7-a shows that by increasing PL of PV system the reversed active power occurs at PL=108% at bus 632. Meanwhile at bus 671 (Figure 2.7-b) this occurs at PL=93%. In addition for bus 680 (Figure 2.7-c) the reversed active power starts at PL=9%.
Figure 2.7 shows that, depending on measurement unit location and PV equipment location, the value and trend of measured impedance has a unique and detectable characteristic. Based on Eq. (2.20), for any type of energized feeder with the voltage and current data available,
0 20 40 60 80 100 120 -50 0 50 100 Penetration Level (%) (ohm ) R -Phase B X -Phase B
the proposed monitoring technique can be used. As stated earlier, the apparent impedance measured at any bus has a direct relationship with PL and reverse with transferred power. The larger the power transferred through the line (equal to low PL), the smaller measured R and X and vice versa. For example at bus 632, for PL varying from 20% (equal to high load) to 80% (equal to light load), the impedance locations varies from point (5.904, 2.955) to (3.16, 13.85) on R-X plane.
37
a- Measured impedance at Bus 632- Phase A
b- Measured impedance at Bus 671- Phase A
c- Measured impedance at Bus 680- Phase A
Figure 2.7 Measured impedance at Bus 632, 671 and 680 for PV installed at bus 680 and penetration level varies from zero to 115%
-5 0 5 -2 0 2 4 6 8 10 12 14 R (ohm) X (ohm ) PL=20% PL=80% PL=108% -5 0 5 -2 0 2 4 6 8 10 12 14 R (ohm) X (ohm ) PL=80% PL=93% PL=108% PL=20% -40 -20 0 20 40 0 10 20 30 40 50 60 70 80 R (ohm) X (ohm ) PL=100% PL=20% PL=9%
2.4.2 Impedance variation due to normal load deviation
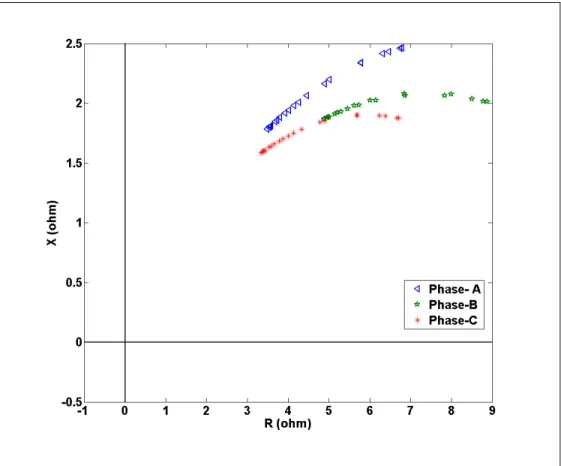
Continuous load variation is the intrinsic characteristic of distribution system. In the previous section, it was shown that the apparent impedance seen by measuring devices has a distinctive changes due to different PV penetration levels. Figure 2.8 illustrate the typical normalized load patterns applied to the test feeder.
Figure 2.8 The normalized load patterns of residential loads
Figure 2.9 shows the measured impedance trajectories for daily load variation. It is found that the small variation of load shows its impact on the measured impedance. For Example, the measured impedance for phase A changes from 6.785+j2.463 ohm at the lightest load condition (58% of nominal load) to 3.484+j1.782 ohm for the maximum daily load. The difference between the measured impedances are due to the unbalanced loading of distribution system.