Protecting Directors and Officers from Liability Arising from Aggressive Earnings Management
27
0
0
Texte intégral
(2) CIRANO Le CIRANO est un organisme sans but lucratif constitué en vertu de la Loi des compagnies du Québec. Le financement de son infrastructure et de ses activités de recherche provient des cotisations de ses organisations-membres, d’une subvention d’infrastructure du Ministère du Développement économique et régional et de la Recherche, de même que des subventions et mandats obtenus par ses équipes de recherche. CIRANO is a private non-profit organization incorporated under the Québec Companies Act. Its infrastructure and research activities are funded through fees paid by member organizations, an infrastructure grant from the Ministère du Développement économique et régional et de la Recherche, and grants and research mandates obtained by its research teams. Les partenaires du CIRANO Partenaire majeur Ministère du Développement économique, de l’Innovation et de l’Exportation Partenaires corporatifs Banque de développement du Canada Banque du Canada Banque Laurentienne du Canada Banque Nationale du Canada Banque Royale du Canada Banque Scotia Bell Canada BMO Groupe financier Caisse de dépôt et placement du Québec DMR Fédération des caisses Desjardins du Québec Gaz de France Gaz Métro Hydro-Québec Industrie Canada Investissements PSP Ministère des Finances du Québec Power Corporation du Canada Raymond Chabot Grant Thornton Rio Tinto State Street Global Advisors Transat A.T. Ville de Montréal Partenaires universitaires École Polytechnique de Montréal HEC Montréal McGill University Université Concordia Université de Montréal Université de Sherbrooke Université du Québec Université du Québec à Montréal Université Laval Le CIRANO collabore avec de nombreux centres et chaires de recherche universitaires dont on peut consulter la liste sur son site web. Les cahiers de la série scientifique (CS) visent à rendre accessibles des résultats de recherche effectuée au CIRANO afin de susciter échanges et commentaires. Ces cahiers sont écrits dans le style des publications scientifiques. Les idées et les opinions émises sont sous l’unique responsabilité des auteurs et ne représentent pas nécessairement les positions du CIRANO ou de ses partenaires. This paper presents research carried out at CIRANO and aims at encouraging discussion and comment. The observations and viewpoints expressed are the sole responsibility of the authors. They do not necessarily represent positions of CIRANO or its partners.. ISSN 1198-8177. Partenaire financier.
(3) Protecting Directors and Officers from Liability Arising from Aggressive Earnings Management* M. Martin Boyer†, Amandine Hanon ‡ Résumé / Abstract Un sujet qui demeure d’actualité quand on pense à la gouvernance des entreprises est le niveau de protection auquel les dirigeants devraient avoir droit en cas de poursuite par les actionnaires. Pour atteindre ce but, nous examinons s’il y a un lien entre la gestion agressive des courus discrétionnaires et la demande d’assurance de la responsabilité civile des administrateurs et dirigeants d’entreprise (ARCAD ci-après). Nous trouvons dans la présente étude que la taille des courus ne semble avoir aucun impact sur la demande d’assurance, que ce soit le fait même d’avoir un contrat ou la limite de la police. Le fait que les courus soient positifs semble toutefois avoir un impact sur le fait que les entreprises possèdent une ARCAD ou non. Nous demeurons perplexes de voir que même si l’ARCAD protège les dirigeants contre le coût de poursuites au civile, ces mêmes dirigeants ne voient pas cela comme une invitation au laxisme dans la supervision des pratiques comptables des entreprises. Mots clés : ARCAD, pratiques comptables agressives, résultats financiers de gestion. A lingering topic in corporate governance is whether corporate directors should be protected against shareholder lawsuits and whether such protection reduces the incentives of directors to monitor appropriately the behaviour of corporate officers. To achieve this goal, we examine whether corporations whose corporate managers’ wealth is protected under a directors’ and officers’ liability insurance policy (D&O insurance hereafter) are more to report accounting results aggressively. Using discretionary accruals as our measure of accounting aggressiveness, the results in our paper suggest that the magnitude of discretionary accruals has no real impact on the demand for D&O insurance, be it on the decision to purchase insurance or on the amount of limit chosen. The positivity of discretionary accruals appears, however, to have an impact on the decision to purchase insurance. Surprisingly, although these insurance policies protect directors and officers in the event they make a “mistake” in their role as representatives of the company, directors do not seem to see this as an invitation to be a little less careful when overseeing the firm’s accounting practices. Keywords: directors’ and officers’ liability insurance policy, aggressive accounting practices, earnings management *. We would like to thank Rémi Moreau for insightful comments, as well as seminar participants at Wilfrid Laurier University and participants at the McGill-HEC 2009 Risk Management Winter Workshop. † Département de la Finance, HEC Montréal, Université de Montréal, 3000, chemin de la Côte-Ste-Catherine, Montréal, Québec, H3T2A7, [email protected]. ‡ Financial Analyst, Proctor & Gamble Canada, Toronto, Ontario..
(4) 1. INTRODUCTION AND MOTIVATION A lingering topic in corporate governance is whether corporate directors should be protected against shareholder lawsuits and whether such protection reduces the incentives of directors to monitor appropriately the behaviour of corporate officers. If directors and officers should be protected, the next question is whether firms should disclose information related to insurance contract terms (i.e., policy limit, deductible and premium) they provide to their directors and officers. Such directors’ and officers’ liability insurance (D&O insurance hereafter) provides protection against the risks of civil lawsuits arising from their activities as representative of the firm. Proponents of greater corporate transparency, such as Griffith (2005), argue that making D&O insurance coverage information publicly available is crucial to assess the corporate governance risk of managers and board members. Opponents claim, on the other hand, that making D&O insurance coverage publicly known will induce more frequent and costlier lawsuits. The argument centers on the fact that a publicly known D&O insurance policy limit will act as a beacon toward which all lawsuits will converge. Independently of whether D&O insurance contract terms are publicly known, it is clear that insurers have developed a technology that allows them to measure something that shareholders have found difficult to assess; that is, respect for the rules of good conduct by corporate officers and directors. Consequently, D&O insurance information could be used to construct a measure of the firm’s governance quality. This is inter alia what Baker and Griffith (2006) noted in their survey on insurance companies. A good D&O insurance is not only matter of policy limits, of course, but also of policy wording. More and more D&O insurance policies become sophisticated and specifically tailored for the specific needs of a policyholder. Some D&O insurance policy include, for instance, policy extensions that cover the directors’ and officers’ defense costs in the event of a derivative claims. Some clauses also permit to avoid lengthy discussions between the parties in case of a breach of fiduciary duty or of a violation of securities laws such as failing to disclose the corporation's financial exposure to subprime losses in relation of dishonestly exclusion. Finally, what to declare in the application form, which is part of the contract (ex. list of outside directorship to be declared annually) is important because any omission could lead the insurer to refuse the coverage. Although very. 1.
(5) important in the structure of the D&O insurance contract, these contract aspects are not available publicly for analysis. Our aim in this paper is to examine whether D&O liability insurance increases the aggressiveness in a firm’s financial reporting, which we shall measure as the size of the firm’s discretionary earnings accruals. Our main hypothesis is that when directors and officers are insured against the cost of expensive lawsuits, they will manage earnings more aggressively to make the firm – or themselves – look better in the eyes of the shareholders. This test will allow us to verify whether firms that offer its officers and directors liability protection use more aggressive accounting practices. Given the growing demand for accounting legislation and good governance practices, it is becoming important to know whether companies that purchase D&O insurance comply more or less with existing legislative framework than uninsured companies. In particular, do companies take out insurance to cover their anticipated accounting irregularities? Another way to phrase the question is to ask whether being covered by D&O insurance induces a more aggressive earnings management approach. Our results appear to suggest that the magnitude of discretionary accruals has no real impact, be it on the decision to purchase insurance or on the amount of limit chosen. However, the positivity of discretionary accruals appears to have an impact on the decision to purchase insurance, although it has no impact on the policy limit. Because these insurance policies protect directors and officers in the event they make a “mistake” in their role as representatives of the company, one could wonder whether such insurance protection is an invitation to directors be a little less careful when overseeing the firm’s accounting practices or an invitation to officers act more aggressively in their managing of earnings. The remainder of the paper is structured along the following lines. We first provide in Section 2 an overview of the existing literature on why company might take out liability insurance. Section 3 is devoted to presenting the data and the methodology used in this research. Finally, we present and discuss our results in Section 4 before concluding in Section 5.. 2.
(6) 2. A PRIMER ON THE D&O INSURANCE MARKET The D&O insurance1 market is subject to constant fluctuations because of the number of complaints brought against officers and directors, for instance. According to Weisdom et al. (2006), complaints against directors, officers, and companies increased by 137% since 1995, whereas judgments and sentences increased by 459%. Similarly, Zinkewicz (2006) reports a 30% increase in the number of complaints against directors and officers between 2004 and 2005 only. The 2002 report by Tillinghast-Towers/Perrin (2002) highlights that 46% of the complaints filed against directors and officers in the United States stem from a perception of accounting fraud or misappropriation of funds, with another 20% of lawsuits being associated with mergers and acquisitions. Using British and Canadian data from the early 1990s, researchers were finally able to test theories and hypotheses raised previously in the literature about the cost and benefits of D&O insurance since companies found themselves mandated to disclose information about D&O insurance. Using the D&O insurance purchasing behaviour of 222 Canadian firms, whose fiscal year ended between May 31 and December 31, 1994 (i.e., premium, policy limit and deductible), Core (1997) examined the structure of D&O insurance contracts and found that firms being faced with a greater risk of litigation and firms with a higher risk of bankruptcy were more likely to purchase D&O insurance (see O’Sullivan for a similar study using British firms). He concluded that the D&O insurance was a substitute for corporate governance. He did not, however, report direct results that could measure whether D&O insurance is at all linked to accounting data reporting quality. In a follow-up article, Core (2000) concludes that D&O insurance premiums are used by shareholders as a signal related to the probability of litigation against directors and officers. Chalmers et al. (2002) simply see the purchase of the D&O insurance as a mean of protecting directors against the risk of shareholder prosecution. By examining the link between the amount of D&O insurance and the stock returns of corporations that 1. D&O insurance policies are not the only mean of protection available to directors and officers since there. are several other contracts that ensure peace of mind to directors and officers in their day-to-day decisionmaking. For instance, according to Cao and Narayanamoorthy (2006a), Limited Liability Provisions and Corporate Indemnification Plans help decrease D&O insurance premiums by offering some type of protection to directors and officers.. 3.
(7) became public through an initial public offering, Chalmers et al. (2002) find a negative correlation between insurance coverage and the firms’ three-year abnormal stock returns. On the basis of this result, they conclude that managers behave opportunistically when purchasing D&O insurance. Boyer (2005) argued, on the other hand, that D&O insurance was not used to protect directors as much as it is used to protect the shareholders’ equity. This contrasts with Bhaghat and Brickley (1987), and Brook and Rao (1994) to name just a few. Boyer (2005) prefers to go with the opinion expressed by Gutierrez (2000), whereby the legal system can be used to facilitate the alignment of managers’ interests with those of shareholders and creditors, and ex ante allow minimization of the company’s value. Based on a Chinese sample, Zou et al. (2006) follow the hypotheses made by Boyer (2005) pointing out that D&O insurance is used to protect opportunistic shareholders as well as directors. They thus support the school of thought that the interests of majority and minority shareholders diverge. To understand the determinants used by insurers to establish D&O liability insurance premiums, Baker and Griffith (2006) innovate by conducting interviews with 21 underwriters, 3 actuaries, 6 brokers, 4 risk managers and 4 professionals specialized in D&O insurance coverage complaints. They conclude that, in the eyes of insurers, the character and the culture of the officers are the most important consideration in establishing premiums. Clearly there are many papers that studied the demand for D&O insurance, but none that looked at the reason found in Jones (1991): The strategic management of earnings. As recent costly corporate scandals stem from bad or inadequate financial data reporting the quality of strategic earnings management would most surely be a decisive element in deciding to purchase D&O insurance, thereby acting as an excellent indicator for litigation risk against directors and officers.. 3. HYPOTHESES DEVELOPMENT Before explaining the data and the methodology we will use, we first develop the hypotheses we want to test to assess the demand for D&O insurance in the context of strategic earnings management. According to the literature, officers and directors serving on boards of directors would be more inclined to buy liability insurance in response to yearly fluctuations in the company’s financial performance indicators. Thus, stock price volatility, the presence of growth options and debt, and imminent bankruptcy. 4.
(8) threats could all be arguments for contracting liability insurance to cover the litigation risks faced by corporate directors and officers.. 3.1. MAIN HYPOTHESIS: EARNINGS MANAGEMENT AS A SOURCE OF LITIGATION Given the Tillinghast Towers-Perrin reports that most D&O lawsuits are brought forth because of accounting misbehaviour, it follows that strategic earnings management choices should be associated with greater D&O litigation risks. This is true even in the case of companies that voluntarily disclose information earlier to reduce, in appearance, the risk of lawsuits (see Skinner, 1997). Indeed, Brown et al. (2005) and Cao and Narayanamoorthy (2006a) show that in the presence of a litigation risks, companies tend to communicate more information. This suggests that the behaviour of managers changes with their expectations and fears of lawsuits against the company. Although Cao and Narayanamoorthy (2006b) conclude that insurers include accounting risk in the calculation of their premium schedule, only recently have authors studied the impact of strategic earnings management on the demand for D&O insurance (see Chung and Wynn, 2008, and Boubakri et al., 2008). This is the more surprising that firms’ earnings management practices and the postponement of their financial results are important variables when it comes to determining the probability of disputes. Healy (1985) was the first to experiment with measuring tools linked to accruals (defined as accounting adjustments to cash flows authorized by accounting standards) to assess a company’s strategic earnings management. Between exploiting accruals, changing accounting policies and modifying capital structures, Jones (1991) uses discretionary accruals to confirm that officers can take advantage of accounting items in manipulating their results (see also Dechow et al., 1995, and McNichols, 2000). Peasnell et al. (2000) then noted that strategic earnings management is used to achieve specific profit objectives. It follows that a firm’s strategic earnings management should lead to a higher probability of prosecution. Ducharme et al. (2004) find that abnormal accruals were particularly high prior to share issues (see also Boubakri et al., 2008). This suggests that firms manipulate their results when issuing shares, thus making them even more vulnerable to possible prosecution. By combining these findings with those of Core (1997), one may hypothesize that D&O. 5.
(9) insurance applications come from managers that aggressively manage their firm’s earnings. Beyond this clash between the two schools of thought, one attributing liability insurance to the managerial opportunism of directors and officers, and the other demonstrating the benefit of controlling leadership through acquiring insurance, we wonder what link might exist between insurance applications (decision to purchase insurance and limits claimed once the decision is made) and strategic earnings management. Do companies having poor earnings management require more insurance coverage? Could liability insurance serve as a quality control mechanism in financial data reporting and provide shareholder protection in response to opportunistic officers and directors? Before being able to answer these questions, we need to construct an appropriate measure for aggressive earning management, accounting fraud’s little brother (Kedia and Philippon, 2007, and Powell et al., 2005).. 3.2. MEASURING EARNINGS MANAGEMENT The most important part of the empirical analysis that we present is the determination of what we mean by earnings management, and more particular by what we mean by aggressive (or abnormal) earnings management. As we presented before, we will use a definition of earnings management that is well known in the accounting literature, namely the discretionary accrual measure (see Healy, 1985, Jones, 1991, Dechow et al., 1995, and McNichols, 2000, and Peasnell et al., 2000). In accordance with the works of Jones (1991), Dechow et al. (1995), and Kothari et al. (2005) we construct the accrual measure using many different steps. The first step is to calculate a firm’s accruals for a given year:. TAi ,t =. ΔSTAi ,t − ΔSTLi ,t − ΔCashi ,t + ΔSTDi ,t − Depi ,t Ai ,t −1. In this equation, ΔSTAi,t is the variation in the firm’s short-term assets (Compustat Item 4), ΔSLTi,t is the variation in the firm’s short-term liabilities (Item 5), ΔCashi,t is the variation in the firm’s cash and short-term investment positions (Item 1), ΔSTDi,t is the variation in the firm’s short-term debt (Item 34), Depi,t is the firm’s current annual. 6.
(10) amortization and depreciation account (Item 14) and, finally, Ai,t-1 is the firm’s total assets in the previous year (Item 6).2 We then use this total accrual measure and regress it on a set of variables that have been shown, or hypothesized to have a significant impact on a firm’s total accruals in a given year. We then define the non-discretionary accruals as the predicted value of such a regression. Including the current year’s return on asset as argued by Kothari et al. (2005), the econometric model we estimate is. TAi ,t = α 0 + α1. ΔSalesi ,t PPEi ,t 1 + α2 + α3 + α 4 ROAi ,t + ε i ,t Ai ,t −1 Ai ,t −1 Ai ,t −1. In this regression, ΔSalesi,t is the variation in the firm’s sales (Compustat Item 12), PPEi,t is the firm’s gross investment in property plan and equipment (Compustat Item 7) and ROAi,t is the firm’s current return on assets (Compustat Item 18 divided by Item 6). The residual of this econometric equation gives us a measure of the firm’s discretionary accruals. This is the measure that will be of utmost interest for the purpose of the current study. To establish a more proper model of discretionary accruals, we will use a much larger sample of firms than those that we study in the current paper. We therefore use the entire sample of firms for which we have at least 6 years of data in the Compustat database during the years 1993 through 2005. We then run a regression by Dun and Bradstreet industry classification (five in our sample): Biotechnology, Pulp and paper, Industrial, Electronic, and Consumer products. Even though it would have been more proper to run a regression by two-digit SIC code, we do not have enough firms by industry to yield a powerful enough model for the purpose of this study. Using the value of the discretionary accrual measure, we then concentrate on the absolute value of these accruals (AbsAccruals) to measure how big they are, and their sign (SignAccruals) to see if negative or positive accruals are treated differently. Our expectation is that firms that have large discretionary accruals should seek more protection for their directors and officers. In terms of the sign of the accruals, we expect 2. It is important to note that there are often holes in the Canadian Compustat database. When these holes. were encountered, we tried to fill them using the predicted value form simple OLS regressions. For instance, when Item3 was missing, we ran a regression model that explains Item3 using Item1, Item2, Item4 and Item6. The predicted value of this regression then takes the place of the missing Item3 in the database.. 7.
(11) that firms that have positive accruals should be more likely to carry D&O insurance and more D&O insurance.. 3.3. MORE HYPOTHESES DEVELOPMENT Aside from the earning management variables, there are many other variables that have been hypothesized in the literature (see Core, 1997, O'Sullivan, 1997, Chalmers et al., 2002, Boyer, 2005, and Zou et al., 2006) to have an impact on the demand for D&O insurance. The variables we present have been chosen because they are associated with a higher risk of litigation. These variables’ construction is presented in Table 1. We divide the explanatory variables in two groups: Variables related to the firms’ financial and variables related to the officers and directors per se. In terms of financial variables, we include in our regressions a measure of the debt ratio (DebtRatio), a measure of the firm’s growth opportunity (GrowthRatio), a measure of the firm’s recent accounting performance (Performance), a measure of stock market risk (Volatility) and a measure of bankruptcy risk (Bankruptcy). We also include whether there were important changes in the firms’ operation by controlling for large increases in the firms’ assets (Acquiror) or large decreases (SpinOff), the firms’ size (FirmSize) and whether the firms’ common stocks are traded on a stock market in the United States (USTraded). Table 1. Calculation of the independent variables related to the firms’ financial health and their directors and officers Variable Calculation Variables related to the firms’ financial health Book value of short term debt plus book value of long term DebtRatio debt divided by book value of assets Market value of equity plus book value of debt divided by GrowthRatio book value of assets Return on assets; measured as net income (before Performance extraordinary items) divided by book value of assets Volatility Bankruptcy Acquiror SpinOff. The annualized daily standard deviation of stock returns Difference between the firm’s market value of debt and the firm’s market value of equity (Merton approach) Equal to 1 if the firm’s assets increased by 25% or more; zero otherwise Equal to 1 if the firm’s assets decreased by 25% or more; zero otherwise. FirmSize. Log of the market value of equity. USListed. Equal to 1 if the firm’s stock is traded on a U.S. stock market; zero otherwise. 8.
(12) Variables related to the officers and the directors Number of independent directors divided by the total number PropIndependent of directors Equal to 1 if no member of the audit committee is related to AuditIndependent the current management team; zero otherwise BoardSize. Number of board members Equal to 1 if the chief executive officer is also the chairman of the board; zero otherwise Log of the number of years that the current chief executive officer has been in office Log of the number of years that the current chairman of the board has been in office Equal to 1 if at least one shareholders owns more than 10% of the firm’s common stock Equal to the number of options owned by the CEO divided by the number of options plus common stocks owned by the CEO; if the CEO owns nothing, CEOAversion equals 0.5. Duality TenureCEO TenureCOB BlockHolder CEOAversion. Measurement of the independent variables that have been hypothesized in prior literature to have an impact on the firms’ litigation risk.. In terms of the variables related to the directors and officers, we control for the board’s independence. (PropIndependent),. the. auditing. committee’s. independence. (AuditIndependent), board size (BoardSize), whether the chief executive officer is also the chairman of the board (Duality), and the number of years that the CEO (TenureCEO) and the chairman (TenureCOB) have been in their respective positions. Finally, we also control for whether there are shareholders that own a large proportion of the firms’ common shares (BlockHolder) and the incentive compensation structure of the CEO (CEOAversion).. 3.4. THE SAMPLE Our sample of companies is drawn from the publicly traded companies on the Toronto Stock Exchange, Canada’s largest stock exchange. To keep our sample as homogenous as possible without reducing too much the number of observations, we only selected companies within the following economic sectors: Biotechnology and pharmaceuticals, Forest, pulp & paper products, Industrial, Electronic and hightechnology, and Consumption. The Financial, Mining and Media sectors were deliberately eliminated even though they represent a large part of the Canadian. 9.
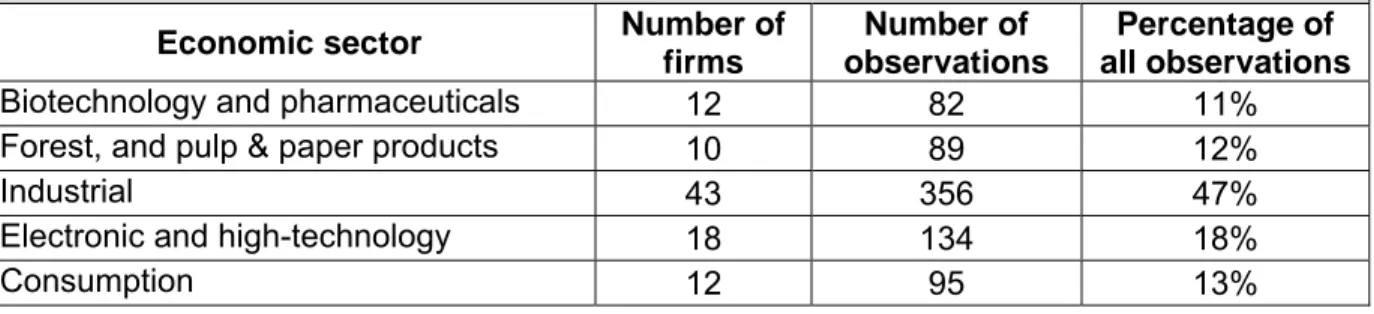
(13) economy in order to keep the sample more homogeneous. This initial sample included 230 companies during a twelve year period (1994-2005). We then deleted companies for which we were not able to collect all the information we needed to conduct our econometric tests as well as companies for which the accounting information (obtained from Compustat, Bloomberg, Reuters and Mergent OnLine) was inappropriate. Finally, to properly calculate the quality of the strategic earnings management (a variable that would identify the perverse impact of the current managers’ accounting choices) we deleted from our sample any company that had less than six consecutive years of financial data. Our final sample therefore includes 95 firms for a total of 756 observations over the years 1994 through 2005. Of course, the number of firms in the Canadian economy is much larger than 95, but because of the data restrictions we impose, such as six years of consecutive financial data, we are left to do our econometric tests on a sample of 95 firms. Whereas the financial information was available in electronic format from different sources, the information related to the composition and compensation of directors and officers, which included the structure of their directors’ and officers liability insurance contract, was collected by hand on the SEDAR web site or from the companies directly themselves. Our sample includes firms that existed prior to 1994, were born between 1994 and 2001 as well as companies that disappeared during the time period. No company born after 2002 is included in the sample since we require six years of data to construct our strategic earnings management variable. New 2002 company would thus have been deleted from our analysis anyway. Table 2 presents the structure industrial sector structure of our final sample with the number of firms and observations per sector (in Panel A) and the number observations by year (in Panel B). Table 2. Number of observations by economic sector and by year. Panel A: Number of firms and number of observations by economic sector Economic sector Biotechnology and pharmaceuticals Forest, and pulp & paper products Industrial Electronic and high-technology Consumption. Number of firms 12 10 43 18 12. Number of observations 82 89 356 134 95. Percentage of all observations 11% 12% 47% 18% 13%. 10.
(14) Total. 95. 100%. 756. Panel B: Number of observations by year Year Number of observations. 1994 1995 1996 1997 1998 1999 2000 2001 2002 2003 2004 2005 15. 39. 56. 67. 70. 78. 77. 82. 84. 74. 64. 50. As we can see, almost half of the firms in the sample are in the industrial sector of the Canadian economy. Also, on average, we have almost eight observations by firm. The average number of observations is lowest for firms in the biotechnology and in the hightechnology sectors, presumably because these sectors are more prone to entry and exit than more mature sectors such as the pulp & paper and the industrial sectors.. 3.5. ECONOMETRIC APPROACH 3.5.1. PROBIT MODEL FOR THE DECISION TO PURCHASE INSURANCE Having D&O insurance or not is dichotomous variable, which means that we must use a probit econometric approach to asses the impact of our different independent variables on the probability of having D&O insurance. Our latent model and our observation rule are thus respectively of the form. Z i* = δd i + u i. where u i ~ N(o, σ 2 ) with Z i* unobserved ⎧ = 1 if Z i* > 0 Zi ⎨ ⎩= 0 otherwis. Each error term (ui) in the latent model is assumed to be independently and identically distributed. The Probit model gives us an estimate of the parameter δ. 3.5.2. TOBIT MODEL FOR THE POLICY LIMIT On top of explaining whether a company’s officers and directors are covered under a liability insurance policy, we would also like to know how the policy limit is chosen. To do so, we will assume that the policy limit (Yi hereafter) is determined a truncated probit (or Tobit) model. Our model estimates the vector β in the regression. Of course, we assume that the error term is distributed independently and identically across observations. To correctly. 11.
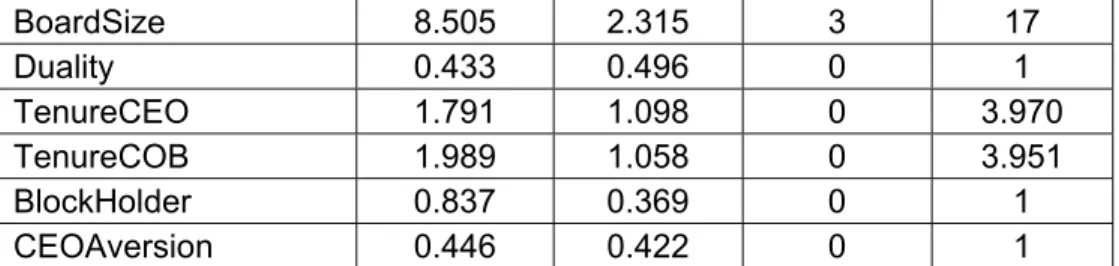
(15) estimate the policy limit, we take into account the variables that first explain the decision to purchase insurance or not. Finally, given that we are faced with a panel data set so that the same firm is found in the data many times, we must cluster the error terms to remove the bias associated with using the same company many times.. 4. PRESENTATION OF RESULTS 4.1. DESCRIPTIVE STATISTICS OF VARIABLES Table 3 shows statistics describing the companies and observations made on our sample of 756 observations. We see that 75% of the firms in our sample had some form of directors’ and officers’ liability insurance. This proportion is similar to that presented in the different TIllinghast Towers-Perrin survey on D&O insurance in Canada, but much less than the proportion of American companies that carry D&O insurance. Given our sample, we have 567 firm-years for which we observe the amount of insurance purchased and 189 for which the policy limit is not observed. Table 3. Descriptive statistics of the final sample of 756 observations Variable Mean Std. Dev. Min Dependent Variables 0.75 0.433 0 Insurance 16.85 1.041 13.82 LnLimit (n=567) Main independent variables AbsAccruals 0.229 0.187 0.001 SignAccruals 0.586 0.493 0 Variables related to the firms’ financial health DebtRatio 0.428 0.227 0.026 GrowthRatio 1.696 1.449 0.283 Performance -0.021 0.305 -6.413 Volatility 0.641 0.446 0.022 Bankruptcy 5.632 3.042 0.000 Acquiror 0.242 0.429 0 SpinOff 0.067 0.251 0 FirmSize 19.14 1.762 14.13 USListed 0.204 0.403 0 Variables related to the officers and the directors PropIndependent 0.692 0.169 0.167 AuditIndependent 0.820 0.384 0. Max 1 20.53 1.886 1 2.678 12.70 0.505 3.982 15.53 1 1 24.18 1 1 1. 12.
(16) BoardSize Duality TenureCEO TenureCOB BlockHolder CEOAversion. 8.505 0.433 1.791 1.989 0.837 0.446. 2.315 0.496 1.098 1.058 0.369 0.422. 3 0 0 0 0 0. 17 1 3.970 3.951 1 1. Legend. Except for the policy limit variable The number of observation for each variable is 756. For the policy limit, given that only 75% of firms have D&O insurance in our sample, the number of observations is 567.. 4.2. UNIVARIATE ANALYSIS As a first step in our univariate analysis we were able to determine whether the mean and standard deviations for the variables were significantly different for the insured and uninsured groups. Our summary analyzes is shown in Table 4. We then carried out ttests to verify the mean differences for the two groups. Before conducting the t-tests we verified whether the variances across the two groups were significantly different. Finally we conducted a chi-squared test in order to compare the dichotomous variable indicators. The univariate analysis allowed us to compare the mean differences and standard deviations for the variables concerned. Table 4. Mean and standard deviation tests for firms that carry D&O insurance and do not carry D&O insurance Firms that have Firms that have no D&O insurance D&O insurance Μ Σ μ σ Main independent variables SignAccruals 0.67 0.47 0.56 0.50 AbsAccruals 0.22 0.20 0.23 0.18 Variables related to the firms’ financial health DebtRatio 0.417 0.25 0.43 0.22 GrowthRatio 1.46 1.38 1.77 1.46 Performance -0.04 0.49 -0.02 0.21 Volatility 0.69 0.51 0.63 0.42 Bankruptcy 5.78 3.15 5.58 3.01 Acquiror 0.21 0.41 0.25 0.44 SpinOff 0.10 0.29 0.06 0.23 FirmSize 18.6 1.89 19.3 1.68 USListed 0.10 0.29 0.24 0.43 Variables related to the officers and the directors. Tests test μ. test σ. 0.006** 0.261. 0.375 0.136. 0.487 0.010** 0.408 0.086 0.445 0.186 0.079 <0.001** <0.001**. 0.036* 0.342 <0.001** 0.001** 0.433 0.246 0.001** 0.040* <0.001**. 13.
(17) PropIndependent AuditIndependent BoardSize Duality TenureCEO TenureCOB BlockHolder CEOAversion. 0.70 0.77 8.33 0.57 2.13 1.78 0.86 0.41. 0.17 0.42 2.56 0.50 1.13 1.15 0.35 0.43. 0.69 0.84 8.56 0.39 1.94 1.79 0.83 0.46. 0.17 0.37 2.23 0.49 1.03 1.08 0.38 0.42. 0.531 0.029* 0.258 <0.001** 0.033* 0.891 0.280 0.197. 0.607 0.017* 0.014* 0.746 0.112 0.245 0.154 0.764. Legend. Differences in means and standard deviations for firms that carry D&O insurance or not. Significance is calculated using a two-tail statistic measure. Significance at the 5% level is presented with a * and significance at the 1% measure is presented with a **. The number of observations is 756 for all the tests.. Companies that choose to purchase liability insurance for directors and officers are generally larger (in terms of the market value of shareholder equity). Moreover, their financial presence on an American stock market appears to be an important factor in determining the purchase of liability insurance. The univariate analysis also shows us that the standard deviation of an insured company’ stock return is significantly lower than that of companies having no insurance. Regarding the variables linked to the board of directors, we find that companies taking out liability insurance have, on average, a chairman who has been a shorter time in office. In addition, we find the chairman of the board and the CEO positions are less likely to be held by the same person3 in companies that have insurance. The univariate analysis shows that the audit committee is on average more independent in companies subscribing to liability insurance. As for financial data reporting, univariate analysis reveals that the mean value for discretionary accruals (AbsAccruals) is not significantly different in companies that took out insurance from those that did not. Moreover, upon examining the sign for discretionary accruals (SignAccruals), it is clear that discretionary accruals were more likely to be positive for companies that do not have insurance. By combining these two results we can already presume that firms purchasing third-party liability insurance have accrual practices that are less likely to. 3. Note, however, that close to 50% of our sample are family businesses whose insurance purchasing. behaviour is undoubtedly different. Family businesses are less likely to purchase liability insurance because the family owns a large share of the company. As such it can better exercise its authority within the board, thus reducing the need for D&O insurance.. 14.
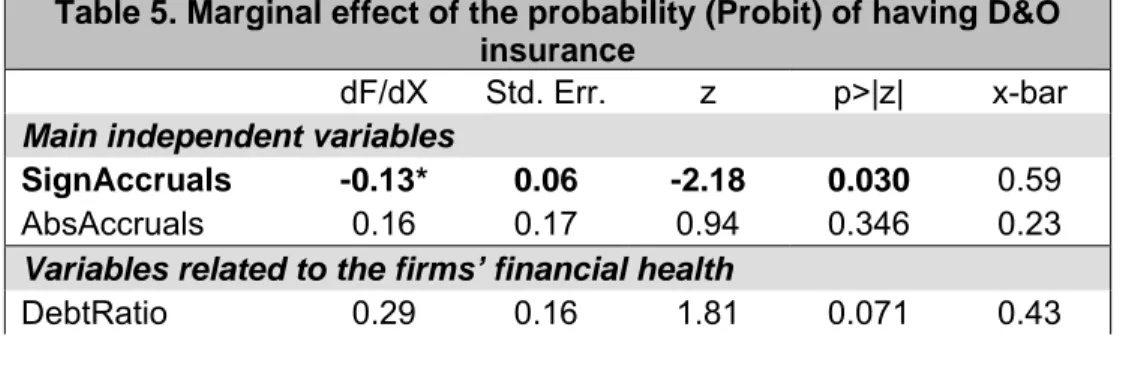
(18) artificially increase accounting results. This is possibly because of the corrections that insurance companies require at the underwriting stage of the negotiation.. 4.3 MULTIVARIATE ANALYSIS 4.3.1. PROBIT ANALYSIS RESULTS As discussed above, our analysis is conducted in two stages. First we study the results for the initial probit regression, and then we study the results arising from the Tobit regression analysis. We begin with the assumption that the decision to purchase liability insurance focuses on the fear of being prosecuted. This decision is thus dependent only on the probability (or frequency) of litigation. Consequently we expect the insurance function to depend on variables related to the financial health of the company, on the frequency of lawsuits in the industry and on the board’s structure. 4 Moreover, we include yearly dummy variables to account for unobservable global supply and demand effects and the macroeconomic environment. Finally, we cluster the standard errors to take into account the effect of existing groups in our dataset. The marginal effect results of the probit analysis are shown in Table 5. As we can see, bankruptcy risk has a positive impact on the decision to buy insurance. In agreement with the literature, we find that the closer a company is to bankruptcy, the greater its predisposition to buy liability insurance to cover all stakeholders. Daily volatility also has an important and negative impact on the decision to buy liability insurance. This probably reflects a willingness on the part of managers to mask their incompetence in the stock’s volatility. Table 5. Marginal effect of the probability (Probit) of having D&O insurance dF/dX Std. Err. z p>|z| x-bar Main independent variables 0.59 SignAccruals -0.13* 0.06 -2.18 0.030 AbsAccruals 0.16 0.17 0.94 0.346 0.23 Variables related to the firms’ financial health DebtRatio 0.29 0.16 1.81 0.071 0.43 4. From an analysis of the variance-covariance matrix between the different variables, we were able to. conclude that no variable showed greater than 90% correlation with another.. 15.
(19) GrowthRatio 0.02 0.03 0.55 Performance 0.15 0.08 1.82 Volatility -0.19* 0.09 -2.02 Bankruptcy 0.04* 0.02 2.55 Acquiror 0.05 0.05 0.87 SpinOff -0.05 0.10 -0.53 FirmSize 0.03 0.03 1.04 USListed 0.06 0.09 0.58 Variables related to the firms’ board of directors PropIndependent -0.22 0.22 -0.97 AuditIndependent -0.01 0.08 -0.07 Duality -0.17* 0.08 -2.10 TenureCEO 0.05 0.03 1.54 TenureCOB -0.04 0.04 -1.11 BlockHolder -0.05 0.07 -0.62 CEOAversion -0.06 0.09 -0.62 Year Fixed Effect Included. 0.580 0.069 0.044 0.011 0.382 0.594 0.298 0.563. 1.70 -0.02 0.64 5.63 0.24 0.07 19.1 0.20. 0.334 0.942 0.036 0.124 0.266 0.532 0.534. 0.69 0.82 0.43 1.79 1.99 0.84 0.45. Legend. Multivariate probit regression where the dependent variable is equal to 1 when the firms carries D&O insurance and 0 otherwise. Significance is calculated using a two-tail statistic measure. Significance at the 5% level is presented with a * and significance at the 1% measure is presented with a **. There are 756 total observations.. The fact that the CEO is also the chairman of the board (Duality) has a negative impact on the decision to take out insurance, a result that prima facie seems contrary to our expectations. Indeed in an effort to improve governance, financial markets encourage companies to have two different persons occupying these positions. However, the fact that this variable has a negative impact may also be due to the composition of our sample. As we explained previously, many of our sample firms are still family-owned and are thus more likely led by a chief executive officer who is also chairman. As a result, the likelihood of prosecution by shareholders is lower, which means less need for liability insurance. This also explains in part why in this model the presence of block holders (Blockholders) is not important. The variable used to measure the extent of discretionary accruals (AbsAccruals) is not statistically significant. Consequently, the scope of strategic choices that a company’s directors might exercise when handling financial information (absolute value of discretionary accruals) does not seem to have any impact on the decision to take out insurance. Whether discretionary accruals (SignAccruals) are positive or negative is significant and reduces the probability of purchasing liability insurance.. 16.
(20) Can this be due to the firm's performance? One may think so since discretionary accruals for one year could be positive because of the firm’s good performance. To account for this possibility, we evaluate discretionary accruals by controlling for the firm’s return on assets (ROA), as suggested by Kothari et al. (2005). The inclusion of performance in the regression provides a better calculation of discretionary accruals. On top of this, we also include the variable ROA in the probit model. The positive impact of discretionary accruals thus reveals a character or cultural trait linked to company’s officers and managers. Indeed, Griffith et al. (2005) remind us that when companies present and communicate their essential information to insurance companies with respect to the purchase (or renewal) of a contract, insurance companies will above all else evaluate the "nature and culture" of the company and officers in place. Insurers may even require that the officers in place amend certain practices. Showing positive discretionary accruals leads us to suspect that the company manipulated its results slightly upward. This type of manipulation could increase the risk of prosecution. Finally, and surprisingly, being listed on an American stock market does not seem to have an impact on liability insurance requests, even though the risk of prosecution is greater. CEO and chairman tenure do not seem to have any impact. These results would lead us to believe that only the managers’ performance (and not their characteristics) is valued by shareholders. We now turn our attention to the variables that affect the D&O insurance policy limit, and the potential link between discretionary accruals and the limit. 4.3.2. RESULTS OF TOBIT ANALYSIS The choice of a policy limit depends mainly on the potential severity of the prosecution. It also depends on the peculiar characteristics of the persons covered by the D&O insurance policy. In addition to the variables included in the probit analysis, we add to the probit regression the size of the board of directors. We, again, include year dummy variables to account for macroeconomic variables, and we cluster the standard errors. The Tobit analysis results that explain the log of the policy limit are shown in Table 6. Results in Table 6 tell us that company size has a positive and important impact on the policy limit, in line with previous results in the literature. Given that companies subscribe to third-party liability insurance to reimburse stakeholders in the event of prosecution,. 17.
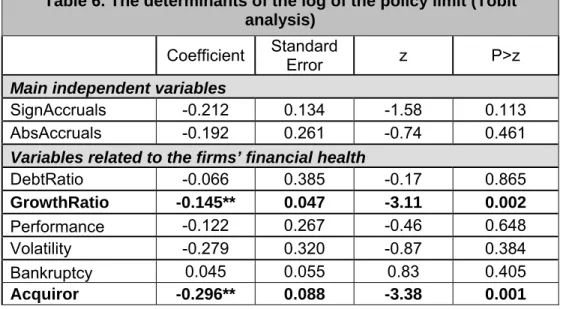
(21) such an outcome is not surprising. What is surprising, however, is that large increases in asset value (such as acquiring a new division) has a negative impact on the limit, a result that might be explained by the fact acquiring a new division reduces the amount of free cash flow in the company. This then reduces the need to rely on aggressive earnings management. In terms of the growth ratio, we find that is reduces significantly the policy limit. This is perhaps due to what the growth option symbolizes in the eyes of shareholders. The proportion of independent directors has a positive and significant impact on the limit as companies are increasingly striving to purchase insurance for their independent directors. This concurs with the thesis also put forward by Boyer (2002), stating that liability insurance complements directors’ compensation and serves an argument in favour of hiring the best. In addition, since liability insurance is intended for directors, it is not surprising board size has a positive impact on the insurance policy limit. The temptation to recruit the best managers is also part of the impact resulting from the variable used to measure the CEO’s risk aversion, which has a positive and significant impact on the limit. As such, the more the CEO is paid in options, the higher is the limit. This result supports the hypothesis put forth by Mayers (1982) whereby D&O liability insurance can be used to solve underinvestment problems. While CEOs are supposed to invest in more risky projects to increase the value of their options as well as their compensation, liability insurance would truly function as a "safety net", which is comforting for this strategy. Table 6. The determinants of the log of the policy limit (Tobit analysis) Coefficient. Standard Error. Main independent variables SignAccruals -0.212 0.134 AbsAccruals -0.192 0.261 Variables related to the firms’ financial health DebtRatio -0.066 0.385 GrowthRatio -0.145** 0.047 -0.122 0.267 Performance Volatility -0.279 0.320 0.045 0.055 Bankruptcy Acquiror -0.296** 0.088. z. P>z. -1.58 -0.74. 0.113 0.461. -0.17 -3.11 -0.46 -0.87 0.83 -3.38. 0.865 0.002 0.648 0.384 0.405 0.001. 18.
(22) SpinOff -0.042 0.162 -0.26 0.301** 0.060 4.99 FirmSize USListed -0.057 0.138 -0.41 Variables related to the firms’ board of directors PropIndependent 0.869* 0.386 2.25 AuditIndependent 0.055 0.129 0.43 0.067* 0.030 2.22 BoardSize Duality 0.129 0.158 0.82 TenureCEO -0.075 0.060 -1.25 TenureCOB -0.046 0.067 -0.69 BlockHolder 0.160 0.133 1.21 CEOAversion 0.607** 0.215 2.82 Year Fixed Effect Included /athrho /lnsigma. -0.672 -0.293. 0.191 0.135. -3.52 -2.17. 0.797 0.000 0.678 0.024 0.667 0.027 0.414 0.211 0.493 0.228 0.005 0.000 0.030. Legend. Multivariate truncated probit regression (Tobit) where the dependent variable is equal to 0 when the firms does not have D&O insurance and is equal to the log of the policy limit when the firm carries D&O insurance. Significance is calculated using a two-tail statistic measure. Significance at the 5% level is presented with a * and significance at the 1% level is presented with a **. There are 756 total observations.. Saddly, our main variables of interest, that is the sign of the discretionary accruals (SignAccruals) and their amplitude (AbsAccruals), do not seem to have any impact on the limit. We expected to find a positive relationship between the extent of accounting data manipulation and the protection offered to managers. Indeed, the more a company manipulates its earnings, in its financial statements, the greater are the chances that stakeholders face significant losses, once the evasion is unmasked. According to the study by Tillinghast-Towers Perrin (2002), the cost of complaints linked to inadequate or misleading statements was higher than others. The PriceWaterhouse-Coopers report (2005) on litigation risks revealed that accounting fraud cases cost almost twice as much as others. It was therefore normal for us to expect that large discretionary accruals would have reduced companies to increase the limit, revealing as such the presence of “entrenched” managers and administrators. The fact that variables linked to discretionary accruals have no impact on D&O insurance policy limits leads us to conclude that policy limit are not opportunistically chosen by entrenched managers. It is also possible that the directors and the CEO are not alarmed (or even warned) by the magnitude of discretionary accruals, since only the financial department is responsible for account management. On final explanation for the. 19.
(23) absence of impact is that discretionary accruals are perhaps not high enough to show a significant impact on liability insurance limits.5 All being considered, the magnitude of discretionary accruals does not seem to have any impact on D&O liability insurance policy limits.. 5. CONCLUSION In a world where market authorities are closely monitoring companies, looking for the slightest accounting fraud or wrongdoing, we wanted to demonstrate that there was a link between the quality of a company’s financial data disclosure (through monitoring discretionary accruals) and the decision to purchase liability insurance. In fact, given that this decision is first and foremost about the parade of prosecution risks faced by company, we wanted to know whether the quality of financial data (strategic earnings management) was a component in this decision, thus allowing us to assess the degree of "morality" of administrators and managers in place. Our results suggest that the magnitude of discretionary accruals has no real impact, be it on the decision to purchase insurance or on the amount of limit chosen. The positivity of discretionary accruals appears, however, to have an impact on the decision to purchase insurance or not. This confirms the assertion that liability insurance plays a managerial monitoring role. It would therefore be useful to include the tracking of discretionary accruals in traditional models. This would involve a variable informing us whether or not a company had purchased liability insurance The importance of discretionary accruals is not significantly higher for companies covered by liability insurance, and moral hazard does not appear to have any impact on the quality of the presentation and disclosure of financial results. This would indicate that the directors are not expecting an insurance contract to clear them of responsibility for any financial wrongdoing exploited by the managers in place. The quality of the companies’ audits would thus not be at stake. The next step would be to study the link between premiums paid by companies and the proportion of their discretionary accruals, 5. Note that the method applied by Jones (1991) regarding the magnitude of discretionary accrual led to. similar results.. 20.
(24) in order to ascertain whether insurance companies assess and account for "the character and culture" of the managers in place, as some authors claim. One important fact we were able to confirm during our study was that the structure of company holdings seemed to have an impact on decisions on whether or not to buy liability insurance. More specifically, in family companies where power and voting right holdings were concentrated within the board of directors or the family, seem to adopt different attitudes toward litigation risks. In our sample however we did not include enough companies to study the behaviour of the two types of companies separately. In conclusion, we find that accounting practices of Canadian companies do not seem to affect managerial behaviour toward litigation risk protection. This is surprising given that we know financial malpractice and erroneous information disclosure have become an important source of litigation against directors and officers. The absence of results may be due to the fact that our measure of discretionary accruals is not reliable enough to allow us to draw real conclusions… especially if one believes that directors blindly trust in reports submitted to them by the firms’ officers. Also, if regulatory agencies required firms to release more information to the public on their financial statements, it would certainly improve how the various stakeholders (investors, creditors, analysts, academics. etc.) discern the practices of company officers and thus allow for a more precise conclusion.. 21.
(25) 6. REFERENCES Baker, T. and S.J. Griffith (2006). Predicting Corporate Governance Risk: Evidence form the Directors' and Officers' liability Insurance Market, University of Chicago Law Review, 74: 1-58. Beasley, M.S. (1996). An Empirical Analysis of the Relation between the Board of Director Composition and Financial Statement Fraud, The Accounting Review, 71: 443465. Bhagat, S., J.A. Brickley and J.L. Coles (1987). Managerial Indemnification and Liability Insurance: The Effect on Shareholders Wealth, Journal of Risk and Insurance, 54: 721736. Blades, J. (2006). A different outlook: D&O underwriters are putting companies under more scrutiny than in the past, Best's Review, September 2006, p.107-108. Boubakri, N., M.M. Boyer and N. Ghalleb (2008). Managerial Opportunism in Accounting Choice: Evidence from Directors' and Officers' liability Insurance Purchase, mimeo HEC Montréal. Boyer, M.M. (2005). Directors' and Officers' Insurance and Shareholder ' Protection, CIRANO working paper 2005s-33, 37 p. Boyer, M.M. (2007). Directors’ and Officers’ Insurance in Canada, Corporate Ownership and Control, 4: 141-145. Brook, Y. and R.K.S. RAO (1994). Shareholder Wealth Effects of Directors’ Liability Limitation Provisions, Journal of Financial and Quantitative Analysis, 29: 481-497. Brown, S., S.A. Hillegeist and K. Lo (2005). Management Forecasts and Litigation Risk, Sauder School of Business Working paper, 48p. Cao, Z. and G. Narayanamoorthy (2006a). Accounting and Litigation Risk, Yale University Working Paper, 45 p. Cao, Z. and G. Narayanamoorthy (2006b). The Effect of Litigation Risk on Management Earnings Forecasts, Yale University Working Paper, 36 p. Chung, H. H. and J. P. Wynn, 2008, Managerial legal liability coverage and earnings conservatism, Journal of Accounting and Economics 46, 135-153. Chalmers, J.M.R, L. Dann and J. Harford (2002). Managerial Opportunism? Evidence from Directors' and Officers' Insurance Purchases, Journal of Finance, 57: 609-636. Core, J.E. (1997). On the Corporate Demand for Directors' and Officers' Insurance, Journal of Risk and Insurance, 64: 63-87. Core, J.E. (2000). The Directors' and Officers' Insurance Premium : An Outside Assessment of the Quality of Corporate Governance, Journal of Law, Economics and Organization, 16: 449-477.. 22.
(26) Daniels, R.J. and S.M. Hutton (1993). The Capricious Cushion: The Implications of the Directors' and Officers' Insurance Liability Crisis on Canadian Corporate Governance, Canadian Business Law Journal, 22: 182-230. Dechow, P., R. Sloan and A. Hutton (1995). Detecting Earning Management, The Accounting Review, 70: 193-225. Ducharme, L.L., P.H. Malatesta and S.E. Sefcik (2004). Earnings Management, Stock Issues, and Shareholder Lawsuits, Journal of Financial Economics, 71: 27-40. Fama, E. and M.C. Jensen (1983). Separation of Ownership and Control, Journal of Law and Economics, 26: 301-25. PriceWaterHouseCoopers (2005). Global Economic Crime Survey, available online at http://www.pwc.com/gx/eng/cfr/gecs/PwC_2005_global_crimesurvey.pdf. Griffith, S.J. (2005). Unleashing a Gatekeeper: Why the SEC Should Mandate Disclosure of Details Concerning Directors' and Officers' Liability Insurance Policy, University of Pennsylvania Institute for Law & Economics Working paper, 42 p. Gutierrez, M. (2000). An Economic Analysis of Corporate Directors' Fiduciary Duties, Universidad Carlos III de Madrid Working Paper, 63 p. Healy, P. (1985). The Effect of Bonus Schemes on Accounting Decisions, Journal of Accounting and Economics, 7: 85-107. Holderness, C.G. (1990). Liability Insurers as Corporate Monitors, International Review of Law and Economics, 10: 115-129. Jones, J.J. (1991). Earning Management During Import Relief Investigations, Journal of Accounting Research, 29: 193-228. Kedia, S. and T. Philippon (2007). The Economics of Fraudulent Accounting, Review of Financial Studies. Klein, A. (2006). Audit Committee, Board of Directors Characteristics and Earnings Management, Journal of Accounting and Economics, 33: 375-400. Knepper, W. and D.A. Bailey (1998). Liability of Corporate Officers & Directors, Seventh Edition, Matthew Bender Publisher. Kothari, S.P, A.J. Leone and C.E. Weasley (2005). Performance Matched Discretionary Accrual Measures, Journal of Accounting and Economics, 39: 163-197. Mayers, D. and C.W. Smith (1982). On the Corporate Demand for Insurance, Journal of Business, 55: 281-296. McNichols, M.F. (2000). Research Design Issues in Earnings Management Studies, Journal of Accounting and Public Policy, Vol. 19, p.313-345. O'Sullivan, N. (1997). Insuring the Agents: The Role of Directors' and Officers' Insurance in Corporate Governance, Journal of Risk and Insurance, 64: 545-556.. 23.
(27) Park, Y.W. and H.-H. Shin (2002). Board Composition and Earnings Management in Canada, Journal of Corporate Finance, 10: 431-457. Peasnell, K., P. Pope and S. Young (2000). Detecting Earnings Management Using Cross-sectional Abnormal Accruals Models, Accounting and Business Research, 30: 313-326. Powell, L., C. Jubb, P. de Lange and K. Langfield-Smith (2005). The Distinction between Aggressive Accounting and Financial Reporting Fraud: Perceptions of Auditors, AFAANZ Conference 2005. Reynolds, P. (2006). New Study sheds light on D&O risk and risk management, Canadian Insurance, Vol. 111, n°8,9, p.30. Romano, R. (1991). The Shareholder Suit: Litigation without Foundation?, The Journal of Law, Economics and Organization, 7: 55-87. Skinner, D.J. (1997). Earnings Disclosures and Stockholder Lawsuits, Journal of Accounting and Economics, 23: 249-282. Stulz, R. (1984). Optimal Hedging Policies, Journal of Financial and Quantitative Analysis, 19: 127-139. Stulz, R. (1996). Rethinking Risk Management, Journal of Applied Corporate Finance, 9: 8-24. Tillinghast Towers-Perrin (2002-2003-2004-2005). Directors and officers Liability Survey. Executive Summary of U.S and Canadian Results. Tufano, P. (1996). Who Manages Risk? An Empirical Examination of Risk Management Practices in the Gold Mining Industry, Journal of Finance, 51: 1097-1137. Weisdom, G.H., L.B. McCord and M.S. Williams (2006). What Board Members Need to Know About D&O Insurance, Consulting to Management, 17: 48-53. Zinkewicz, P. (2006). D&O Symposium, Rough Notes. Indianapolis, Vol. 149, n°4, p. 130-133. Zou, H., M.S. Wong, C.C. Shum, J, Xiong and J. Yang (2006). Directors' and Officers' Liability Insurance in a Non-Litigious Culture: Chinese Evidence, Lignan University Working Paper.. 24.
(28)
Figure

+2
Documents relatifs
We thus considered sequence data available for: (i) the four pools (CH2-R, BRG-R, WAS-R and BIO-R) including Red- nSpots individuals only (i.e., with a Red-nSpots allele frequency
Une étude espagnole observationnelle descriptive entre 2010 et 2013, s’intéressant au devenir des enfants hospitalisés pour une encéphalite aiguë dans 14 services
Die Messung der CIMT zusätzlich zum klassischen Risikofaktorenprofil wird bei asymptomatischen Personen über 45 Jahre von der American Heart Association (Greenland et al. 2010) und
The DOSINDYGO clinical trial aims to achieve a light-dose escalation increasing up to four times the initial light dose used in the INDYGO trial.. An increase of both light power
Although both young and elderly humans show an increase in some muscle factors associated with proliferation and differentiation, and a reduction in myostatin gene expression
This thesis examines the role of grass roots dedication and determination in the conversion process and compares that with the role of the private sector in the
- Les conditions aux limites sont alors essentielles pour assurer la compacité et de la récurrence de l’itération en physique pour remplir la condition : tout voisinage
Dans son mémoire d’octobre 1998, le Conseil retenait la définition de la formation continue qu’applique l’UNESCO à l’éducation des adultes et en rappelait les termes. Parce que
