To cite this document:
Fares, Fares and Boucheret, Marie-Laure and Escrig, Benoît and Calmettes, Thibaud
and Guillon, Hervé Multiuser Detection For Asynchronous ARGOS Signals. (2010)
In: 7th International Symposium on CSNDSP , 21-23 Jul 2010, Newcastle, UK.
Open Archive Toulouse Archive Ouverte (OATAO)
OATAO is an open access repository that collects the work of Toulouse researchers and
makes it freely available over the web where possible.
This is an author-deposited version published in:
http://oatao.univ-toulouse.fr/
Eprints ID: 3963
Any correspondence concerning this service should be sent to the repository
administrator:
[email protected]
Multiuser Detection For Asynchronous ARGOS
Signals
Fares Fares
(1), Marie-Laure Boucheret
(1), Benoit Escrig
(1), Thibaud Calmettes
(2), and Hervé Guillon
(3)(1) Université de Toulouse, IRIT/ENSEEIHT/TESA, (2) THALES ALENIA SPACE - Toulouse (France), (3) CNES -Toulouse.
[email protected], {bouchere, escrig}@enseeiht.fr, [email protected], [email protected].
Abstract – In this paper, we investigate the application of
multiuser detection techniques to a Low Polar Orbit (LPO) mobile satellite used in the ARGOS system. These techniques are used to mitigate the multiple access interference in the uplink transmission of the system. Unlike CDMA, due to the Doppler Effect, each signal has a different received carrier frequency and a different propagation delay. Multiuser detection techniques are proposed for asynchronous transmission in ARGOS system: the maximum likelihood detector, the conventional detector, and the sequential interference cancellation detector, as solutions to tackle the interference effects. Bit Error Rate performance graphs are shown for these techniques.
Index Terms — ARGOS, multiuser detection, maximum
likelihood detection, sequential interference cancellation, multiple access interference.
1. INTRODUCTION
ARGOS [1] is a global satellite-based location and data collection system dedicated for studying and protecting the environment. User platforms, each equipped with a Platform Transmitter Terminal (PTT) [2], transmit data messages to a 850 km LPO satellite. An ARGOS satellite receives, decodes, and forwards the signals to ground stations. All PTTs transmit at random times in a 100 kHz bandwidth using different carrier frequencies. The central carrier frequency f0 is 401.65 MHz. Due to the relative motion
between satellite and platforms, signals transmitted by PTTs are affected by both a different Doppler shift and a different propagation delay.
Thus, the ARGOS satellite receives overlapping signals in both frequency and time domains inducing Multiple Access Interference (MAI). One common approach to mitigate the MAI problem is to implement Multi User Detection (MUD) techniques at the receiver (the ARGOS satellite). There has been significant research on MUD for Code Division Multiple Access (CDMA) signals, which was originally done by Verdu [8]. In CDMA systems, the spreading sequence codes used are chosen to have good correlation properties for obtaining low correlated signals at the receiver. However, when it comes to a specific non CDMA system such as ARGOS system, the received signals are highly correlated due to the superposition of the received
frequencies bands at the receiver; thus making it difficult to differentiate and separate them. Furthermore, code sequences are not available to help differentiate between users. Today’s ARGOS receivers can only decode one signal at a time. Moreover, to our knowledge, there is a lack of MUD research for non-CDMA signals where each signal is affected by a different received carrier frequency. For the ARGOS system, several MUD techniques have been already designed for synchronous scenarios i.e. when all the signals are assumed to be received at the same time [3]. This paper investigates optimum and sub optimum MUD techniques for the reception of asynchronous users. The paper shows also the performance in terms of Bit Error Rate (BER). The complexity of the proposed MUD techniques is also discussed.
The rest of the paper is organized as follows. In section 2, the system model, as well as the mathematical derivations are presented. In section 3, we present the Maximum Likelihood Detector (MLD), the conventional detector, and the Sequential Interference Cancellation (SIC) detector [4] [6]. In section 4, simulation results of the proposed MUD techniques are presented. Finally, the conclusions are given in section 5.
2. SYSTEM MODEL
We consider a Binary Phase Shift Keying (BPSK) transmission of K asynchronous users with different received carrier frequencies fk = f0 + δfk where k ε [1,K]. The
frequency shift δfk includes both the transmission frequency
of user k and the Doppler shift due to the relative motion between the PTT and the satellite receiver. Thus, ARGOS system can be treated similarly as an FDMA system with each signal user k affected by its corresponding frequency fk.
The base band received signal is written as:
) ( ) 2 ( exp ) ( ] [ ) ( 1 1 0 t n t f j iT t h i b A t r k k K k M i k k − − + =
∑ ∑
= − = π τ (1)where M is the number of symbols per user message, Ak is
the received amplitude of the kth user, bk[i] ε {-1,+1} is the ith transmitted symbol of the kth user, h(t) is the unit energy signature waveform with a value of 1 T over one symbol interval [0,T] where T is the symbol period, τk is the time
delay of the kth user, j denoting the complex number where
j2= -1, and n(t) is a circularly symmetric complex Gaussian
noise with variance σ ² = 2N0. We assume an ascending
order of the time delays τk such that
T K ≤ ≤ ≤ ≤ =τ τ .... τ 0 1 2 .
Throughout this paper, we assume also a perfect estimation of the signal amplitudes Ak, the time delays τk, and the
carrier frequencies fk at the receiver.
The output yu[m] of the matched filter for the uth user,
sampled at time mT+ τu is given by:
∑ ∑
= − = + = K k M i u k u k k u m A b i mi n m y 1 1 0 , ( , ) [ ] ] [ ] [ ρ (2)where ρu,k(m,i) denotes the time dependent cross correlation
of the signature waveforms of the uth and kth users, m denoting the mth received symbol of the uth user, i denoting the ith interfering symbol from the kth user, and nu[m]
represents the noise at the output of the uth matched filter sampled at time mT+ τu. dt t f f j mT t h iT t h i m u k u T m mT k k u u u ] ) ( 2 [ exp ) ( ) ( ) , ( ) 1 ( * , =
∫
− − − − − + + + π τ τ ρ τ τ dt mT t h t f j t n m n u T m mT u u u u ) ( ) 2 exp( ) ( ] [ * ) 1 ( τ π τ τ − − − =∫
+ + +where the upper script * denotes the complex conjugate. The equation above shows the dependence of ρu,k(m,i) on the
shape of the signal waveform h(t). So different shapes of h(t) could lead to smaller values for ρu,k(m,i). This study is left
for future work.
For simplicity, the term ρu,k(m,i) shown above term is
written as the following:
dt mT t f f j t h T m i t h i m u k u T k k u u u ] ) )( ( 2 [ exp ) ( ) ) ( ( ) , ( * , =
∫
− − − − − + + π τ τ ρ τ τ (3)Figure 1. System model for K-user asynchronous multiuser system. Fig. 1 shows the reception of K asynchronous users at the receiver. From Fig.1, we note that the symbol bu[m] of the uth user at time mT+ τu is correlated with the symbols bk[m]
of the other (K-1) users where k ε [1,K] andk≠u, with the
symbols bk[m+1] of the (u-1) preceding users where
] 1 , 1 [ − ∈ u
k and with the symbols bk[m-1] of the (K-u)
following users wherek∈[u+1,K]. Therefore, (2) could be written in the following form [5]:
) 4 ( ] [ ) 1 , ( ] 1 [ ) 1 , ( ] 1 [ ) , ( ] [ ) , ( ] [ ] [ 1 , 1 1 , ) ( 1 , , m n m m m b A m m m b A m m m b A m m m b A m y u K u k k u k k u k k u k k K u k k k u k k u u u u u + − − + + + + + =
∑
∑
∑
+ = − = ≠ = ρ ρ ρ ρNote that (4) is the sum result of three terms: the useful signal term (the first line), the MAI term (lines 2, and 3), and the Gaussian noise term (the last line).
2.1. Matrix Representation
The existing MUD techniques in CDMA systems are all based on matrix form of the received symbols. Thus, in the same way, we express (4) in vector form as follows [7]:
) ( ) 1 ( ) 1 , ( ) 1 ( ) 1 , ( ) ( ) , ( ) ( m n m b A m m R m b A m m R m b A m m R m Y + − − + + + + = (5) where R(m,m) ε C K X K is the normalized cross correlation
matrix whose diagonal elements are equal to 1 and whose (u,k) element is equal to the cross correlation term ρu,k(m,m)
and R(m,m+1) is a lower triangular matrix with zero diagonal defined as follows:
> + ≤ = + k u if m m k u if m m R k u k u ( , 1), , 0 ) 1 , ( , , ρ T m m R m m R( , +1)=[ *( +1, )]
We define also the following terms:
) ,..., , (A1 A2 AK diag A= T K m y m y m y m Y( )=( 1[ ], 2[ ],..., [ ]) T K m b m b m b m b( )=( 1[ ], 2[ ],..., [ ]) T K m n m n m n m n( )=( 1[ ], 2[ ],..., [ ])
where the upper script T denotes the transpose of a matrix and n(m) is a zero-mean Gaussian noise vector.
Equation (5) can be written in the following form [5] [8]:
Y’ = R’A’b’ + n’ (6) where: A'=diag(A,A,A,...A)ε R KM X KM T KM y y y Y'=( 1', 2',..., ' ) T KM b b b b'=( 1', 2',..., ' )
T KM n n n n'=( 1', 2',..., ' ) with: ] [ ' m y ymK+k = k ,bmK' +k=bk[m],bmK' +k=bk[m],k∈[ K1, ],and ] 1 , 0 [ − ∈ M
m . Finally, R’ is defined as follows:
− − − − = ) 1 , 1 ( ) 2 , 1 ( 0 0 0 0 ) 2 , 2 ( ) 1 , 2 ( 0 0 ) 2 , 1 ( ) 1 , 1 ( ) 0 , 1 ( 0 0 ) 1 , 0 ( ) 0 , 0 ( ' M M R M M R R R R R R R R R K M M M M M M M M M M M M K K K K K K 2.2. Analytical Computation ofρu,k(m,i)
The matrix R’ presented in (6) is constituted by the ρu,k(m,i)
correlation coefficients terms. We now compute analytically
the ρu,k(m,i) coefficients. Recall that the signature waveform
h(t) is a constant value of 1 T over one symbol interval. The subsequent computations of ρu,k(m,i) are based on (3) and
the following termξu,k(a,b,m):
)] )( [( )] 2 )( ( exp[ ) ( 1 ] ) )( ( 2 exp[ 1 ) , , ( , a b f f Sinc mT b a f f j a b T dt mT t f f j T m b a u k u k b a u k k u − − + + − − = + − =
∫
π π ξ where: x x Sin x Sinc ππ ) ( ) ( = 2.2.1. Computation of ρu,k(m,m+1) fork∈[1,u−1] : dt mT t f f j T t h T m m k u T k k u u u ] ) )( ( 2 [ exp ) ( 1 ) 1 , ( , + =∫
− − − + + π τ ρ τ τ∫
+ + + − = + u k T T u k k u j f f t mT dt T m m τ τ π ρ , ( , 1) 1 exp [ 2 ( )( )] ) , , ( ) 1 , ( , ,k mm ukT k T u m u ξ τ τ ρ + = + + 2.2.2. Computation of ρu,k(m,m−1) fork∈[u+1,K] : dt mT t f f j T t h T m m k u T k k u u u )] )( ( 2 [ exp ) ( 1 ) 1 , ( , − =∫
+ − − + + π τ ρ τ τ∫
− + = − k u dt mT t f f j T m m k u k u τ τ π ρ , ( , 1) 1 exp [ 2 ( )( )] ) , , ( ) 1 , ( , ,k mm uk u k m u ξ τ τ ρ − = 2.2.3. Computation ofρu,u(m,m): dt t h T m m T u u u u u∫
+ − = τ τ τ ρ , ( , ) 1 ( ) ) , , ( ) , ( , ,u m m u u u u T m u = ξ τ τ + ρ 2.2.4. Computation of ρu,k(m,m) for k∈[1,u−1] dt mT t f f j t h T m m k u T k k u u u )] )( ( 2 [ exp ) ( 1 ) , ( , =∫
− − + + π τ ρ τ τ∫
+ − + = T u k k u k u dt mT t f f j T m m τ τ π ρ , ( , ) 1 exp [ 2 ( )( )] ) , , ( ) , ( , ,k mm uk u k T m u =ξ τ τ + ρ 2.2.5. Computation of ρu,k(m,m) fork∈[u+1,K]:∫
+ − + = T u k k u u k dt mT t f f j T m m τ τ π ρ , ( , ) 1 exp [ 2 ( )( )] ) , , ( ) , ( , ,k mm uk k u T m u =ξ τ τ + ρ3. MULTIUSER DETECTION TECHNIQUES We first present the optimal detector based on the MLD, and then the sub optimum techniques: the conventional detector and the SIC detector.
3.1. Maximum Likelihood Detector
The base band received signal is given by (1):
) ( ) ' ( ) (t s b nt r = t + where ) 2 ( exp ) ( ] [ ) ' ( 1 1 0 t f j iT t h i b A b s k k K k M i k k t
∑ ∑
τ π = − = − − =The vector b’ is defined in (6). The optimum multiuser detector estimates the symbols of all the users in an MLD sense i.e. the optimal detector searches for the vector bˆ' that maximizes the following equation [7]:
{
}
− − = ∈ 2 2 () ( ') 2 1 exp ² 2 1 ] ' ] , 0 [ ), ( [r t t MT b rt s b P t σ σ π where: dt b s t r b s t r b s t r t MT t t * 0 2 )] ' ( ) ( [ )] ' ( ) ( [ ) ' ( ) ( − =∫
− −Thus, we minimize the following Euclidian distance: ∆(b')= r(t)−st(b')2 (7) The minimization of (7) leads to the following estimation [8]: { }
{ }
) ' ~ ( max arg ' ˆ 1 , 1 ' ~ b b KM b MLD= Ω + − ∈ where Ω(b~') = Re[2(b~'TA'Y')−b~'TA'R'A'b~']When we maximizeΩ(b~')in the same way as in the synchronous case [3], the complexity grows exponentially with the length of the vector b' i.e. O(2KM). This complexity is unacceptable due to the large values of M. It can be shown that it is possible to obtain an optimal decision algorithm whose complexity is independent of M by using the Viterbi algorithm [7], [8]. The Viterbi algorithm exhibits a complexity per bit that is exponential in the number of users i.e. O(2K)[8]. This complexity is in the same order as the synchronous case [3]. The MLD consists of a bank of K-single user matched filters followed by a Viterbi algorithm with 2K-1 states [8]. Note that the MLD requires the knowledge of the received amplitudes and the cross correlations terms which have been computed in 2.2.
3.2. Conventional Detector
The conventional detector consists of a bank of filters matched to the signature waveforms of the users, and threshold devices that estimate the transmitted bits. The multiple access interference is ignored and assumed as an additive noise to the channel. The estimate of the symbol
bu[m] is given by [8]:
bˆu[m]=sign
{
yu[m]}
(8) where yu[m] is the output of the matched filter for the uthuser, sampled at time mT+ τu. The conventional detector is
the optimal detector in the absence of any interference term.
3.3. Sequential Interference Cancellation
The proposed SIC receiver works as follows [4]. The received input signal can be written in the following form:
∑
= + = K k k t n t r t r 1 ) ( ) ( ) ( ) (where r(k)(t) is the kth strongest power received signal with amplitude denoted by A(k), a time delay denoted by τ(k), and a received carrier frequency denoted by f (k). The signal r(k)(t) is written in the following form:
∑
− = − − = 1 0 ) ( ) ( ) ( ) ( ) ( ) 2 ( exp ) ( ] [ ) ( M i k k k k k t f j iT t h i b A t r τ πThe signal r(t) is first fed into a conventional detector, which demodulates the strongest signal in the presence of interferences. The symbolsbˆ(1)[m]for m ε [0, M-1] are estimated using (8). The estimated symbols are re-modulated and a replicarˆ(1)(t)is obtained, and then subtracted from the
received signal r(t). The resulting signal s1(t)=r(t)−rˆ(1)(t)
is fed into a second conventional detector to demodulate the second strongest signal and the symbols bˆ(2)[m]are obtained. The same process is repeated in subsequent stages.
Generally, the resulting signal fed into the (u+1) th conventional detector is given by:
∑
= − = u k k u t rt r t s 1 ) ( ) ( ˆ ) ( ) ( u∈[0,K−1] (9) where:∑
− = − − = 1 0 ) ( ) ( ) ( ) ( ) ( ) 2 ( exp ) ( ] [ ˆ ) ( ˆ M i k k k k k t f j iT t h i b A t r τ πNote that any error in the estimation of a symbol at the uth stage propagates into additional noise to the next cancellation stages [6].
4. SIMULATIONS RESULTS
In this section, we evaluate the performance of the MUD techniques using computer simulations in the case of (K=2) users separated by a frequency shift ∆f and a time delay of ∆τ. We assume a perfect estimation of these parameters at the receiver.
The amount of MAI is characterized by the signal to interference ratio SIR =Pi/Pin where Pi denotes the power of
the signal of interest and Pin denotes the power of the
interfering signal. The BER performance curves are plotted for each implemented technique as a function of the SIR, the time delay ∆τ, and the relative frequency shift ∆f/Rb where
Rb represents the data symbol rate (see Fig. 2).
A close observation of Fig.2 shows that the MLD achieves the best performance in terms of BER. We also note that as we increase the ratio ∆f/Rb, the proposed algorithms
performance approaches that of the single user detection which is the ideal performance case. This fact is due to the decrease of the ρu,k(m,i) coefficients terms (thus decrease of
the MAI term) as a function of ∆f/Rb (see 2.2). The
conventional detector gives the worst performance.
Another important factor when evaluating MUD techniques is the loss in terms of Eb/N0 (dB) for a fixed BER. The loss
in dB is equal to the difference between the required Signal to Noise Ratio (SNR) to achieve a given BER in the presence of MAI and the required SNR in the single user case to achieve this same BER.
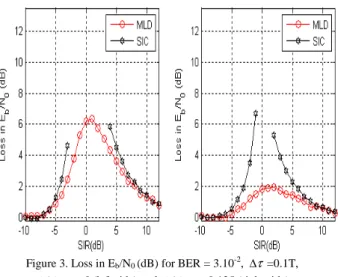
The loss in dB is evaluated as a function of the SIR for several values of ∆f/Rb and ∆τ. Results for a fixed BER are
shown in Fig.3 and Fig.4 (BER = 3.10-2).
Our simulations show that the MLD gives the smaller degradation loss with respect to the other techniques. We show in Fig.3 that for a relative frequency shift ∆f/Rb
between the two users greater than or equal to 0.125 (right side), signals with equal powers (SIR = 0dB) are required in the MLD to reach a maximum loss of 2 dB.
Similarly, Fig 4 shows that for a relative frequency shift ∆f/Rb between the two users greater than or equal to 0.25
(left side), a separation power between the two signals of 5dB is required to obtain an ideal performance for the weak signal in the SIC detector.
Figure 2. Bit Error Probability for SIR = -1 dB, ∆τ=0.1T,
b
R f /
∆ = 0.125 (left side) and ∆f /Rb= 0.375 (right side).
Figure 3. Loss in Eb/N0 (dB) for BER = 3.10-2, ∆τ=0.1T,
b
R f /
∆ = 0 (left side) and ∆f /Rb= 0.125 (right side).
The simulations show also that the SIC performance is dependent on the values of SIR. For positive values of SIR (dB), the performance of the strong signal improves as SIR increases. This fact is due to the large separation between the received signal power levels (SIR). This separation results in a small interference coming from the weak signal. After subtraction of the strong signal, if the error probability of the strong signal is low enough, the performance of the small signal will be influenced mainly by noise and a small residual interference.
5. CONCLUSION
In this paper, ARGOS satellite communication system with LPO satellites is considered. In this system, signals suffer a large Doppler shift. Several MUD techniques are studied and evaluated in the ARGOS system. The access methods, originally proposed to CDMA systems, are adapted to the ARGOS system. The performance of the optimum detector is compared with several sub optimum multiuser detectors.
Figure 4. Loss in Eb/N0 (dB) for BER = 3.10-2,∆τ=0.3T,
b
R f /
∆ = 0.25 (left side) and ∆f /Rb= 0.5 (right side). Moreover, for a given degradation loss, the power separation needed between the two users to cover a range of relative frequency shifts is given. Simulations results have been obtained assuming perfect estimation at the receiver of the amplitudes, the time delays, and the received frequencies. Further study is needed to quantify the effect of imperfect estimations of these parameters.
Future work could also be extended for other signature waveforms h(t) which could lead to smaller correlation coefficients terms.
6. REFERENCES
[1] CNES, “Rapport d'études des traitements phase B”, AS3 DJ-100-505 (in french).
[2] CNES, “Platform Transmitter Terminal (PTT-A2) Platform Message Transceiver (PMT-A2) - Physical Layer System Requirements”, AS3-SP-516-274-CNES.
[3] F.Fares, ML.Boucheret, B.Escrig, “Multiuser Detection for Time Synchronous ARGOS Signals”, ICSSC 2009.
[4] H.Arslan, K.Molnar, “Co-channel Interference Suppression with Successive Cancellation in Narrow-Band Systems”, IEEE Communications Letters, Vol.5, No.2, February 2001.
[5] R.Lupas, “Near Far resistance of multi user detectors in asynchronous channels”, IEEE Tans.Commun, vol.38, pp.496-508, April 1989. [6] S.Slimane, “Symbol Error Probability Analysis of a Multiuser
Detector for M-PSK Signals Based on Successive Cancellation”, IEEE Journal on Selected Areas in Communications, Vol.20, No.2, February 2002.
[7] S.Verdu, “Minimum probability of error for asynchronous Gaussian multiple access channels”, IEEE Trans.Inform.Theory, vol IT-32, pp.85-96, Jan 1986.
![Fig. 1 shows the reception of K asynchronous users at the receiver. From Fig.1, we note that the symbol b u [m] of the u th user at time mT+ τ u is correlated with the symbols b k [m]](https://thumb-eu.123doks.com/thumbv2/123doknet/3708784.110354/3.892.80.430.790.962/shows-reception-asynchronous-users-receiver-symbol-correlated-symbols.webp)