Real-Time Distributed Systems
Dimensioning and Validation:
The TURTLE Method
Ludovic Apvrille* —Ahlem Mifdaoui**
—Pierre de Saqui-Sannes**
* Institut Telecom, Telecom ParisTech, CNRS LTCI 2229 rte des Crêtes, B.P. 193, 06904 Sophia-Antipolis, France
**CNRS ; LAAS ; ISAE
7 avenue du colonel Roche, F-31077 Toulouse, France
Toulouse University; Université de Toulouse ; UPS, INSA, INP, ISAE ; LAAS ; F-31077 Toulouse, France
{Ahlem.Mifdaoui, pdss}@isae.fr
RÉSUMÉ.A d ˝Ofinir par la commande\resume{...}
ABSTRACT. The TURTLE language and toolkit offer a UML framework for service descrip-tion, protocol modeling and communication architecture validation. The method associated with TURTLE uses an architectural design pattern where two or several protocol entities rely on a pre-existing communication service. Modeling the pre-existing service with empirical val-ues is error-prone and hampers large space exploration during the communication architecture validation. The paper relies on the Network Calculus theory to parameterizes the service with realistic upper bounds. The revisited TURTLE method includes a dimensioning step between the requirement and analysis steps. This new step is based on a "Dimensioning Diagram" that de-scribes the network in terms of traffic and equipments behavior, and a "Dimensioning-oriented Use Case Diagram" that categorizes the flows conveyed by the network. The paper applies this method to a video conference system as example.
MOTS-CLÉS :A d ˝Ofinir par la commande\motscles{...}
1. Introduction
The term real-time UML profile denotes the family of modeling languages that customizes the Unified Modeling Language [Gro03] for real-time applications and platforms. TURTLE [ALCdSS04] is a real-time UML profile supported by the open-source toolkit TTool (TURTLE Toolkit [Lab10]). The diagram editor and the type checker support the UML 2 compliant syntax of the profile. The code gene-rators developed for LOTOS, RT-LOTOS, and UPPAAL give access to three formal verification tools : (RTL [rtl], UPPAAL [upp], CADP [cad]) [AdSS09]. The user-friendly interface offered by TTool hide the inner workings of the verification tools. Also, the Java code generators enables fast prototyping of distributed systems.
UML is a notation, not a method. A UML profile such, in parti-cular the TURTLE language, must be associated with a method. The TURTLE method defined in [AdSSPA06] is applicable to a broad va-riety of systems and specifically secure group communication systems [SSVF+10]). The TURTLE method is a four-step process that covers requirement capture, use case driven analysis with service and proto-col scenarios description, protoproto-col machines elaboration as premises to communication architecture validation, and deployment of software components over nodes.
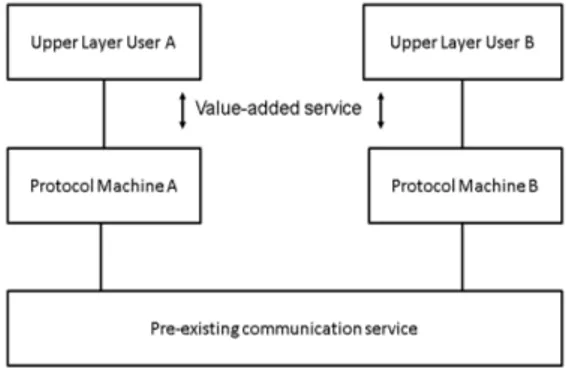
The design step uses a three-layer architectural pattern where two or several protocol entities rely on a pre-existing communication service to provide their end user with a value-added service. The pre-existing service is hard to characterize in terms of transmission delay and er-ror rate. A survey of the literature indicates that authors commonly use empirical values. This generally leads to a space explosion problem in-herent to reachability analysis techniques implemented by the formal verification tools linked to TTool.
The paper proposes to bypass the problem using analytical realistic upper bounds, obtained with the Network Calculus formalism [LT01], for the pre-existing service. The objective is to address the dimensioning problem as early as possible in the development cycle and to reduce design and prototyping costs. The paper revisits the TURTLE method accordingly.
The revisited TURTLE method introduces a "dimensioning step" between the requirements capture and analysis steps. A Dimensioning Diagram (DD) is created to describe the network in terms of traffic and equipments behavior. A dimensioning oriented use-case diagram, or DUCD for short, is introduced to document the DD and categorizes the flows conveyed by the network. The information contained in the DD and the DUCS is provided as input to the Network Calculus Software (NCS) that has been interfaced with TTool. NCS analytically computes upper bounds for network parameters such as communication delays and queues lengths (i.e. memory usage). The NCS output values are used at the design level to have an accurate model of the pre-existing service.
The paper is organized as follows. Section 2 surveys related work. Section 3 presents the TURTLE toolkit and the Network Calculus fun-damentals. Section 4 revisits the TURTLE method and introduces DDs as well as DUCSs. In section 5, the proposed approach’s applicability is assessed on a video conference application. Section 6 concludes the paper.
2. Related Work
The increasing complexity of distributed systems and the need for architecture validation have stimulated research work on protocol mo-deling using Petri nets [Dia89], formal description techniques (Estelle, SDL and LOTOS) and UML profiles (such as TURTLE) that bridge the gap between the UML and formal methods world. Much work done in this area addresses language definitions, formal verification tools and code generators. A survey of the literature indicates that too little atten-tion has been paid on methodological issues with some excepatten-tions, such as [AdSSPA06].
The methodologies that apply to distributed systems commonly iden-tify communication architecture validation as a fundamental issue, and reuses the three-layer pattern described in figure 1. Two or several pro-tocol entities rely on some pre-existing communication service to offer to their upper users a value-added service. The pattern has extensively
been used since the mid-1980’s, including for protocol engineering ba-sed on UML [Pop06].
Figure 1 – Three-layer architectural pattern
The increasing use of the UML gives protocol engineers a notation to share. The acceptance of UML among practitioners also depends on the capacity of UML tools to offer model analysis techniques. For ins-tance, the proSPEX method [dWK05] implements performance evalua-tion into TAU G2, a tool which supports a UML/SDL profile. De Wetre and Kritzinger promote a non analytical technique based upon simu-lations and application of queuing theory. Consequently the network parameters are approximated by lower bounds.
Unlike this approach, the one suggested in this paper is based on the use of analytical realistic upper bounds to characterize the com-munication service (e.g. transmission delays, throughput or memory) thanks to the Network Calculus formalism. This theory is well adapted to controlled traffic sources and provides easily analytical upper bounds of the system’s features. Our work joins the use of UML profile and the Network Calculus theory for dimensioning purposes. To our best knowledge, this kind of approach has not been addressed yet for distri-buted systems. However, it is worth to note that in terms of joint use of Network Calculus and a high-level modeling language, there are some existing tools like CYNC [SSH07] which associates the Network Cal-culus with Matlab/Simulink. Moreover, the idea to compute bounds to come up with worst-case scenarios is not exclusive to the Network
Cal-culus. For example, the synchronous language SCADE is proposed in [lSHK08], but it does not target distributed systems.
3. Background
3.1. Protocol engineering with TURTLE
TURTLE (Timed UML and RT-LOTOS Environment) is a graphic language for requirement capture, use case driven and scenario-based analysis, architectural and behavioral design, and rapid prototyping of real-time and distributed systems. TURTLE customizes SysML and UML diagrams, and gives them a formal semantics (Note : requirement and use case diagrams remain informal). The TURTLE toolkit, or TTool [Lab10] for short, offers real-time and distributed systems designers a set of diagram editors, code generators and user-friendly interfaces to formal verification tools. The UPPAAL and LOTOS/RT-LOTOS code generators enable application of model checking and labeled transition systems minimization techniques. The Java code generator enables ra-pid prototyping of distributed applications.
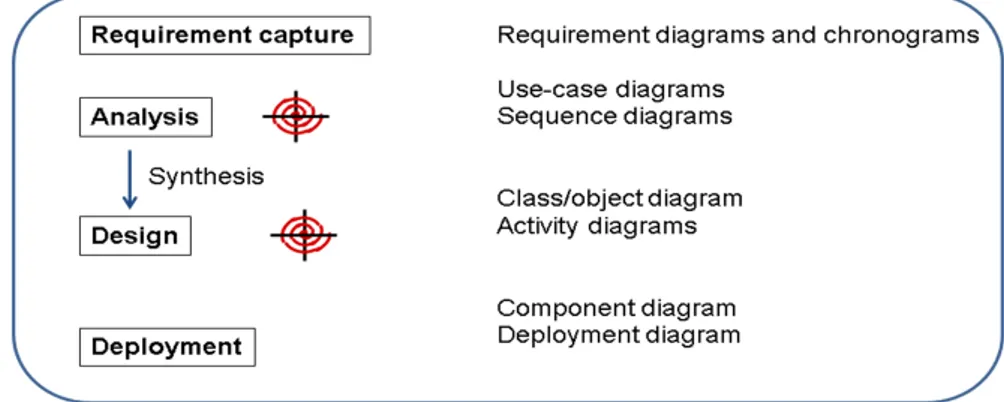
The TURTLE method applicable to distributed systems is sketched by Figure 2. A spirals denotes an incremental process where diagrams are gradually introduced and step by step formally verified.
– Requirement capture : TURTLE reuses SysML Requirement Diagrams to create a tree-structure of requirements expressed in plain text and associated with chronograms that pictorially and formally express temporal requirements. Each formal requirement is unambi-guously identified and traced through the life cycle using a traceability matrix.
– Analysis : A use case diagram sets the boundary of the distributed system and identifies actors, including the underlying service and the upper-layer users. A set of use-case identify the main functions to be implemented by the system. For a connection-oriented protocol, a use case may identify a protocol phase, such as the connection set up. The use cases are documented by Sequence Diagrams (SD) structured by an Interaction Overview Diagram (a UML2 activity diagram whose nodes are either IODs or SDs). A first group of sequence diagrams depict service scenarios. A service scenario considers the system as a single black box that interacts with actors, namely the underlying service and the end-users. The service scenarios are split up into protocol scenarios that make the protocol entities, their upper layer users and the underlying service explicitly appear. TTool does not restrict application of formal verification to design diagrams. It may generate (RT-)LOTOS or UPPAAL code from one IOD and the SDs associated with that IOD. Though SDs are not intended to represent the entire system, it is nevertheless recommended to perform formal verification on analysis diagram, as first error filter.
– Design : TTool includes a design diagram synthesizer which takes as input analysis diagrams, i.e. the high-level IOD1 and the sub-IODS or SDs referred from IOD1. An object diagram is created. It reuses the 3-layer pattern depicted by Figure 1. Activity diagrams are also created. They describe the behaviors of the objects. The synthesis algorithm applies to all analysis diagrams that are implementable [Loh03]. In brief, the implementability of analysis diagrams implies that one at least has the same set of traces the analysis diagrams have. The automatically synthesized diagrams may be extended manually in order to make the design model closer to the real system. The level of detail should not hamper application of reachability techniques, and by extension of model-checking and graph minimization techniques that
permit to characterize the service rendered by a protocol layer.
– Deployment : The model considered at the design step is a verification-oriented model that surrounds the protocol machines with their upper and lower layers. The deployment step (not discussed in the rest of the paper) isolates the protocol machines and enriches them with Java code, thus creating an implementation prototype. New objects may be created at that occasion and gathered with the protocol machines to create software components that will eventually been deployed on the nodes identified by a deployment diagram.
3.2. Network Calculus Fundamentals
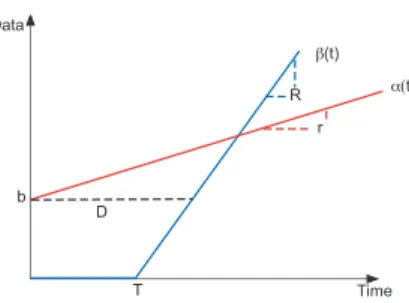
The Network Calculus formalism [LT01] relies on min-plus algebra for designing and analyzing deterministic queuing systems where the compliance to some regularity constraints suffices to model the traffic. These constraints limit traffic burstiness in the network and are des-cribed by the so called arrival curve α(t), while the availability of the crossed node is described by a service curve β(t). The knowledge of the arrival and service curves enables the computation of the delay bound that represents the worst case response time of a message, and the ba-cklog bound that is the maximum queue length of the flow. The baba-cklog bound helps configuring the memory of the system.
As shown in Figure 3, the delay bound D is the maximal horizontal distance between α(t) and β(t). The backlog bound B is the maximal vertical distance between them. Two conditions make the bounds easier to calculate : (i) a linear arrival curve α(t) = b + rt with b the maximal burst and r the rate (we say that the flow is (b, r)-constrained) ; (ii) a rate latency service curve β(t) = max(0, R(t − T )) with latency T and rate R. The obtained bounds are Rb + T for the delay and b + rT for the backlog. The previous linear arrival curve and rate-latency service are well adapted to the video-conference system which serves as case study for the paper.
b r T R D Time Data !(t) "(t)
Figure 3 – How to compute the maximum bound on delays and queues This formalism gives an upper bound for the output flow α∗(t), ini-tially constrained by α(t) and crossing a system with a service curve β(t),using min plus deconvolution where :
α∗(t) = sups≥0(α(t + s) − β(s)) = (α β)(t)
The output arrival curve of the flow α(t) in the case of a linear in-put arrival curve α(t) and a rate-latency service curve β(t) is simply α∗(t) = b + r(t + T ).
4. Revisiting the TURTLE method
The expected benefits of improving the TURTLE method and tool-kit with NC-based dimensioning is to integrate realistic analytical upper bounds on transmission delays and other parameters (throughput, me-mory usage) in order to enhance the model of the system and to obtain a more accurate design.
4.1. Basic Concepts
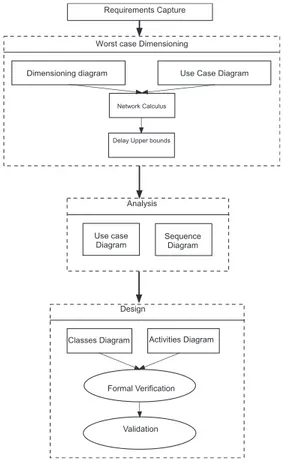
The revisited TURTLE method depicted by figure 4 integrates figure a dimensioning step, which uses a DD and a DUC. The DD characte-rizes the network by the following information :
– The Equipments connected to the network (mobiles phones, web servers, etc.).
– The Traffics emitted on network equipments (video stream, http stream, etc.).
– The Switches of the network (Ethernet switch, IP router, etc.). – Physical interconnections between the switches.
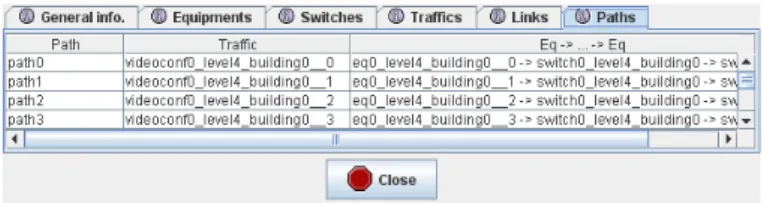
It may happen on traffic source has not one but several destinations. This does not appear on the DD but on the DUCD. The NCS software interfaced with TTool needs both diagrams to compute upper bounds. Therefore TTool includes a DD diagram editor (see Figure 7) and cus-tomizes its use case diagram editor for DUCDs. TTool may generate a list of all possible traffic paths that serves as input to NCS.
Dimensioning diagram
Worst case Dimensioning
Network Calculus
Delay Upper bounds
Use Case Diagram Requirements Capture
Classes Diagram Activities Diagram
Validation Design
Analysis
Use case
Diagram Sequence Diagram
Formal Verification
4.2. Dimensioning Diagram 4.2.1. Basics
In UML, a deployment diagram is made up of execution nodes that may be stereotyped (e.g. by << P C >> or << Switch >>) and pair-wise connected by links. A deployment diagram may also contain artifactsthat identify software elements issued from a development pro-cess.
In TURTLE, DDs customize the concept of nodes, link and arti-facts to model the equipments, traffics, routers (including routing tables of those routers), router-to-router interconnections, and equipment-to router-interconnections :
– Equipments are modeled with UML nodes stereotyped as << Equipment >>.
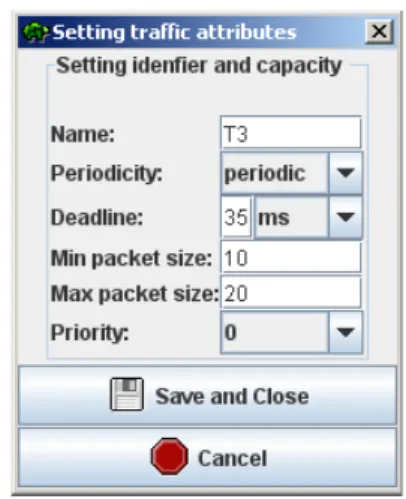
– Traffics are modeled as << raf f ic >> artifacts to be added to the nodes stereotyped by << Equipment >>. Each traffic is characteri-zed by a type (periodic, aperiodic), a deadline, a minimal and maximal packet size, and the priority level inside the router (four priority levels are supported). Figure 5 shows an example of using TTool for entering traffic information (the figure refers to the case study (Section 5.1) and more precisely to traffic T3).
– Routers and switches are modeled with UML nodes stereotyped << Switch >>, see e.g. switch0 on Figure 6. Each switch is characte-rized by a scheduling policy (Static Priority, First Come First Served), a capacity expressed in Mbs or Gbs, and a set of entry / exit interfaces. That capacity is taken into account if and only if the capacity of the links connected to the router is not set.
– Routing information is modeled inside a router, using << Routing >> artifacts to be mapped onto << Switch >> nodes. See, e.g., the artifact R0 of node switch1. A route is defined by a 3-uple (en-try interface, traffic, exit interface). A routing artifact may contain one or several routes.
– Links between nodes model exit and entry interfaces of equipments and switches. At equipment level, multiplicity parameters may be asso-ciated to the interfaces, so as to model large numbers of similar
equip-ments in a system (e.g. thousands of mobile phones).
Figure 5 – Entering traffic characteristics
Figure 6 – Characteristics of a Route artefact 4.2.2. Properties
The network calculus theory applies from DDs if the latter satisfy the following properties :
– The traffic routing must not contain any cycle.
– A multiplicity may be attached to a link between an equipment and a switch ; it exclusively applies to that equipment. It is not permitted to attach a multiplicity to another type of link.
– For all traffics emitted to the network, there must be at least one well-formedpath making it possible for the traffic to be sent to a desti-nation equipment. Here, well-formed means that for all traffic entering
a switch, (i) there must exist at least one output interface which differs from the input interface, and (ii) the routing information associated with the switches must allow each traffic to reach at least one equipment.
4.3. Dimensioning-oriented use case diagram
The use case diagram developed at dimensioning step clarifies the use of the network described by the DD. Like any UML use case dia-gram, it separates a system and its main functions (use cases) from an external environment made up of actors. In a dimensioning use case diagram, the system, the actors and the use case respectively represent the network modeled by the DD, the traffic emitter applications, and the routing functions, respectively.
4.4. TTool Extension
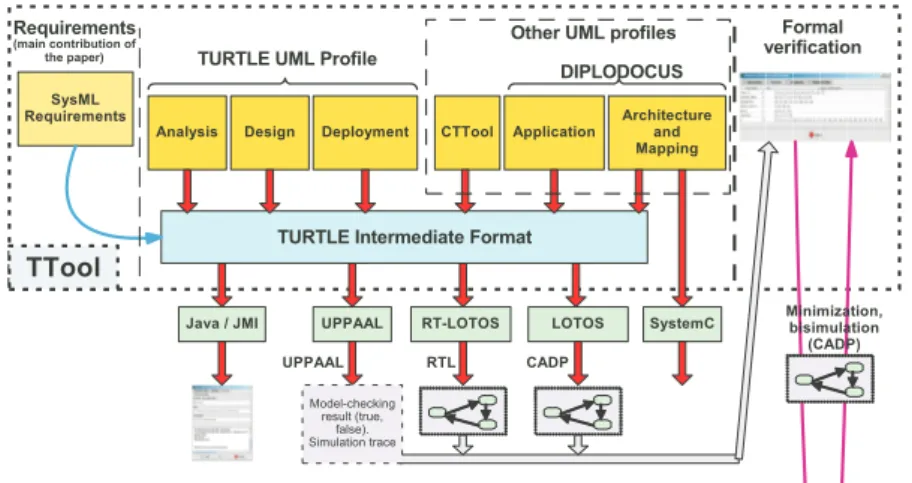
The TURTLE toolkit has been extended with a DD editor (see Figure 7). A code generator implements the formal semantics attributed to DDs and transforms the latter into an XML file that is accepted by Network Calculus Software (NCS), a piece of software which implements algo-rithms based on the network calculus theory. The XML file is generated if the DD meets the properties listed in Section 3.1 (e.g. no cycle and routing information are correct). Otherwise, error messages are issued, and the user is invited to modify the network.
For each use case UC, NCS computes the analytical upper bounds of the communication service associated with UC. The service is cha-racterized by the latency, the memory, and the throughput, just to men-tion a few. These upper bounds are integrated in the model of the sys-tem to make the diagrams developed at the analysis and design steps more accurate. The TURTLE model made up of requirement, dimen-sioning, analysis and design diagrams may be formally verified using TTool companion tools, i.e. UPPAAL, RTL and CADP. Hence, the aim of this extension is to offer a complete framework to the designer to make the system dimensioning and verification using formal methods in a transparent manner within TTool and its user-friendly interfaces.
SysML Requirements
Analysis Design Deployment CTTool Application
TURTLE Intermediate Format
Java / JMI UPPAAL RT-LOTOS LOTOS
TTool
Other UML profiles Requirements (main contribution of the paper) Formal verification RTL CADP UPPAAL Model-checking result (true, false). Simulation trace Minimization, bisimulation (CADP) Architecture and Mapping TURTLE UML Profile
DIPLODOCUS
SystemC
Figure 7 – Extension of TTool for dimensioning purpose 5. Application Example : Video Conference System
5.1. Case Study
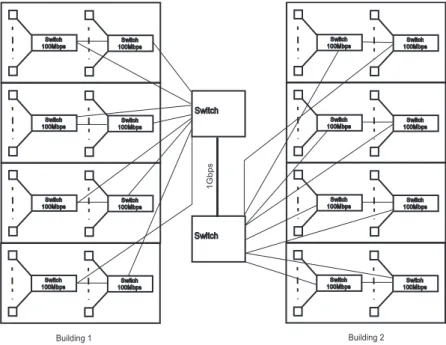
The system dimensioned and modeled in TURTLE is a video-conference system enabling room-to-room conversation on a university campus. The dormitories consist of two four-floor buildings with 28 rooms on each floor. The network topology is as follows : two full-duplex Ethernet switches are installed on each building floor to connect the rooms to the network. Also, a 100 Mbps connects the two switches (each switch has sixteen 100Mbps interfaces). Each building has eight switches connected to a building switch with eight 100 Mbps ports and one Gbps port used to interconnect the two buildings. Each
video-conferencing application generates a full-duplex 120 Kbps audio-video stream (Packets of 1500 Bytes are sent periodically) as shown in figure 8. In the paper, the performance of the video conference system is in-vestigated with respect to transmission delays.
First, the TURTLE method presented in Figure 2 is applied : the use case and DDs have been elaborated. Then, the respective maximal end to end delay bounds are determined thanks to Network Calculus Software. Finally, the system has been modeled taking into account the dimensioning results and then validated.
1 G b p s Building 1 Building 2
Figure 8 – Case Study
5.2. Network Modeling
5.2.1. Dimensioning oriented use case diagram
The dimensioning-oriented use case diagram depicted by Figure 9 explains how a group of students located on two separate buildings may use the video-conference system. Three use cases represent the traffic
Figure 9 – Dimensioning-oriented use case diagram
routing depending on the location of the video-conference applications modeled by the actors : two students living at the same floor (use case com1), two students living in the same building but not necessarily on the same floor (use case com2), and two students not living in the same building (use case com3).
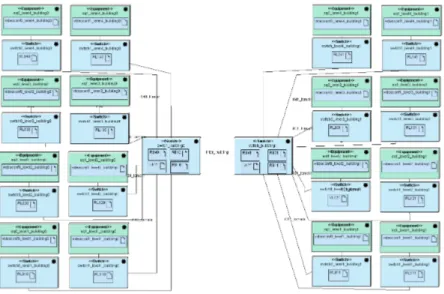
5.2.2. Dimensioning Diagram
Figure 10 – Dimensioning diagram for the case study In TURTLE, a DD (see Figure 10) includes :
Figure 11 – Synthesis of the network, as presented by TTool – 16 switches, each being located on one building floor (8 switches per building).
– 1 switch per building (switch _building0, switch_building1) : the two switches are connected by a 1 Gbps link.
– 14 equipments per floor : only one equipment is pictorially mode-led in oder to avoid problems with representing multiplicities on links.
– Links to connect equipments to switches.
– Routing tables on switches, and traffics on equipments. Routing tables stipulate that each equipment can communicate with any other equipment of the network.
TTool uses the DD to check network properties such as cycle free-ness and to visualize bot network elements (see Figure 11) and the paths that may be followed by the traffics. TTool then converts the diagram into an xml representation that is compatible with the input format of NCS.
NOTE. — The network is quite complex (224 equipments and traffics,
18 switches, around 50000 paths), but the graphical UML representa-tion remains manageable.
5.3. Analytical Delay Bounds
The transmitted audio-video flows are periodic with a maximal length L = 1500Bytes and a maximum rate r = 120 Kbps. Hence, each audio-video flow i has an affine arrival curve αi(t) = L + r ∗ t.
The service curve offered by the crossed switch depends on the used scheduling policy. In our case, we consider the simple policy
First Come First Served (FCFS) and the technological switch relaying latency is neglected. Hence, the service curve offered by the switch is simply β(t) = Ct, where C is the switch capacity (in this case C ∈ {100M bps, 1Gbps}).
The maximal switch processing delay bound D, obtained by the maximal deviation between the arrival curve of the global traffic α(t) = P
iαi(t) and beta is D = P
iLi
C .
Algorithm 1 End-to-end delay bounds Calculus
1: S ← {s1, s2...snstreams} 2: EED ← NULL-VECTOR(S.length) 3: for i = 1 to nstreams do 4: Path ← Vector-crossed-components(si) 5: β ← Vector-service-curves(Path) 6: for k = 1 to Path.length do 7: R ← Vector-rcv-streams(P ath(k)) 8: α ← Vector-arrival-curves(R) 9: αglobal←Pj∈Rα(j) 10: D ← Delay-calculus (αglobal, β(k)) 11: αglobal← Left-shift-curve (αglobal, D)
12: EED(i) ← EED(i) + D 13: end for
14: end for
NCS was used to calculate the analytical maximal end to end delay bounds. NCS used the traffic characteristics and the network architec-ture model to compute the arrival curve of each stream at every point of the network. NCS also identified the service curve offered by each net-work component according to its processing policy. Finally, NCS gave the maximal delay bounds that represents the horizontal distance bet-ween the two curves. A maximal end to end delay bound can then be determined. NCS implements the algorithm described in 1.
Initially, NCS identifies the traffic flows set at the network input (line 1). Then, for each flow in the identified set, it determines its associa-ted path (line 4) and the service curves offered by the crossed switches (line 5). Afterward, the delay bound calculation is propagated from one
switch to another by resolving the burstiness constraint evolution of each flow (line 6- line 13). In fact, the traffic flows crossing the same switch output port (line 7) and their respective arrival curves (line 8) are requested to determine the global arrival curve (line 9). The service curve is requested in turn to compute the submitted delay bound as the maximum horizontal deviation between the arrival curve and the service curve (line 10). The output arrival curve calculated in (line 11) becomes the input arrival curve for the next network component and so on, until the last component is taken into account. Afterwards, since the delay bounds are known for each flow and each network point, a maximal end to end delay bound can be computed for each flow along its path (line 12).
For the video conference system, three kinds of communication are possible (com 1, com 2 and com 3) as explained in section 5.2.1). The associated end to end delays are given in table 1.
Tableau 1 – Maximum bounds obtained when using network calculus techniques
Use case Maximum end to end delay (ms)
com1 1.68
com2 2.70
com3 28.80
5.4. Design and Validation
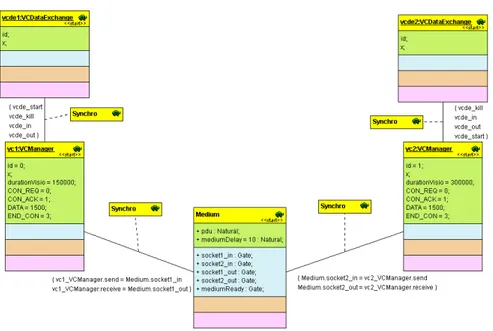
The TURTLE design model of the video conference system includes an object architecture based upon the pattern in Figure 1. The objects model the user applications, the protocols, and the communication me-dium.
The model of Medium remains simple. This is a consequence of using NCS during the dimensioning step. Using a previous release of TTool not interfaced with NCS would lead to model the entire intercon-nection network.
The architecture is made up of five objects (see Figure 12) :
– The protocol class VCManager is instantiated twice (sending entity and receiving entity). The class models the protocol’s phases (connec-tion setup, data exchange, connec(connec-tion release).
– The audio/video capture class is named VCDataExchange. The class is instantiated twice (for two students).
– The class modeling the interconnection network (Medium) is ins-tantiated once. In that case, TURTLE uses the same symbol to denote the class and the object.
Figure 12 – Class diagram
The activity diagram of Medium takes into account the results provided by NCS (see Figure 13). The diagram is divided into two sub-activities, one per transmission direction. In both directions, data transmission is delayed by 29ms. Also, a time-limited offer is used to model that a pa-cket reaching a network output interface must be accepted immediately by the receiving entity ; otherwise, it is discarded.
Formal verification enabled proving the protocol’s correctness for the specified latency in Medium. The reachability graph of the system contains around 3,000 states and 10,000 transitions. The graph would
Figure 13 – Activity diagram of the Medium class
have been much larger - and may be not computable - without using the dimensioning results provided by NCS. Additionally, the graph has quite a high ratio of transitions per state. The reason is as follows : the communication can be aborted at all time by one of the two entities. At last, model-checking and graph minimization techniques defined in [GV90] and implemented in the bcg_min / CADP toolkit [cad], were used to prove the following properties :
– All data exchanges are always preceded by a connection setup. – A connection release may occur only after a connection setup has been completed.
6. Conclusion
Protocol engineers are used to modeling communication software on top of a communication service like traffic delays, throughput and other parameters that remained unknown or at least imprecisely
com-puted. This fact leads to a space explosion problem inherent to reacha-bility analysis techniques. The paper proposes to improve the TURTLE method, language and toolkit by using the Network Calculus theory to overcome this problem. Using this theory enables to analytically obtain realistic upper bounds, and hence to accurately model the communi-cation service in terms of transmission delay, consumed memory and throughput.
The TURTLE method is improved by adding a dimensioning step that now follows the requirement capture step and precedes the analysis step. The main benefit of the proposed extension is that dimensioning problems that were so far addressed at the design step, are now taken into account earlier, which particularly limits the state explosion pro-blem raised by formal verification of large design models and enhances the system’s design accuracy.
The dimensioning step introduces two new diagrams : a Dimensioning-oriented Use Case Diagram and a Dimensioning Dia-gram. The former describes the different scenarios for which the com-munication service (e.g. transmission delay, memory, throughput) is computed. Whereas the latter gives an accurate and graphical descrip-tion of the network’s characteristics, such as the input traffic and the equipments behaviors. That information is used by the Network Cal-culus Software (NCS) to evaluate the analytical upper bounds of the respective communication service which would be integrated in the ana-lysis step.
The paper discusses the revisited TURTLE method’s applicability to a video conference system. The proposed approach has been positively assessed in terms of transmission delays. The design model of the sys-tem and the obtained results are more accurate than those obtained using the "old" TURTLE method. Hence, this revisited method contributes to enhance the system’s accuracy and to reduce the development cycle’s duration.
Références
[AdSS09] Ludovic Apvrille and Pierre de Saqui-Sannes. Making Formal Verification Amenable to Real-Time UML Prac-titioners. In Proceedings of the 12th European Work-shop on Dependable Computing (EWDC’09), Toulouse, France, May 2009.
[AdSSPA06] L. Apvrille, P. de Saqui-Sannes, R. Pacalet, and A. Ap-vrille. Un environnement UML pour la conception de systes distribu . Annales des Tommunications, 61 :11/12 :1347–1368, Novembre 2006.
[ALCdSS04] L. Apvrille, C. Lohr, J.-P. Courtiat, and P. de Saqui-Sannes. TURTLE : A Real-Time UML Profile Supported by a Formal Validation Toolkit. In IEEE transactions on Software Engineering, volume 30, pages 473–487, July 2004.
[cad] The CADP toolkit. http ://www.inrialpes.fr/vasy/cadp. [Dia89] Michel Diaz. Application of petri nets to communication
protocols. In Petri Nets. fundamental Models, Verification and Applications, 978-1-84821-079-0 :27–39, 1989. [dWK05] Nico de Wet and Pieter Kritzinger. Using UML models
for the performance analysis of network systems. Com-puter Networks, 49 :627–642, 2005.
[Gro03] Object Management Group. UML 2.0 Superstructure Specification. In http ://www.omg.org/docs/ptc/03-08-02.pdf, Geneva, 2003.
[GV90] J. F. Groote and F. Vaandrager. An efficient algorithm for branching bisimulation and stuttering equivalence. In Mike Paterson, editor, Proceedings of the 17th Internatio-nal Colloquium on Automata, Languages and Program-ming, (ICALP’90), volume 443 of Lecture Notes in Com-puter Science, Warwick University, England, July 1990. Springer.
[Lab10] LabSoc. The TURTLE Toolkit. In http ://lab-soc.comelec.enst.fr/turtle/ttool.html, 2010.
[Loh03] Markus Lohrey. Realizability of high-level message se-quence charts : closing the gaps. Theoretical Computer Science, 309(1-3) :529–554, 2003.
[lSHK08] T. le Sergent, R. Heckmann, and D. Kastner. Me-thodology and benefist of Timing Verification for Safety-Critical Embedded Software. In DO-178 White paper, http ://www.esterel-technologies.com/DO-178B/request/whitepaper, 2008.
[LT01] J.Y. Leboudec and P. Thiran. Network Calculus. Springer Verlag LNCS volume 2050, 2001.
[Pop06] Miroslav Popovic. Communication Protocol Enginee-ring. Tailors and Francis, 2006.
[rtl] The RTL toolkit. http ://www.laas.fr/RT-LOTOS/index.html.en.
[SSH07] H. Schioler, H. P. Schwefel, and M. B. Hansen. Cync : a matlab/simulink toolbox for network calculus. In Value-Tools ’07 : Proceedings of the 2nd international confe-rence on Performance evaluation methodologies and tools, pages 1–10, ICST, Brussels, Belgium, Belgium, 2007. ICST (Institute for Computer Sciences, Social-Informatics and Telecommunications Engineering). [SSVF+10] Pierre de Saqui-Sannes, Thierry Villemur, Benjamin
Fon-tan, Sara Mota, Mohammed Salah Bouassida, Najah Chridi, and Isabelle Chrisment. Formal verification of se-cure group communication protocols modelled in UML. Innovations in Systems and Software Engineering, 2010. [upp] The UPPAAL toolkit. http ://www.uppaal.com/.
ANNEXE POUR LA FABRICATION
A FOURNIR PAR LES AUTEURS AVEC UN EXEMPLAIRE PAPIER
DE LEUR ARTICLE
1. ARTICLE POUR LA REVUE :
Studia Informatica Universalis.
2. AUTEURS :
Ludovic Apvrille* —Ahlem Mifdaoui**
—Pierre de Saqui-Sannes**
3. TITRE DE L’ARTICLE:
Real-Time Distributed Systems Dimensioning and Valida-tion:
4. TITRE ABRÉGÉ POUR LE HAUT DE PAGE MOINS DE 40SIGNES:
The TURTLE Method
5. DATE DE CETTE VERSION:
12 octobre 2010
6. COORDONNÉES DES AUTEURS :
– adresse postale :
* Institut Telecom, Telecom ParisTech, CNRS LTCI
2229 rte des Crêtes, B.P. 193, 06904 Sophia-Antipolis, France
**CNRS ; LAAS ; ISAE
7 avenue du colonel Roche, F-31077 Toulouse, France Toulouse University; Université de Toulouse ; UPS, INSA, INP, ISAE ; LAAS ;
F-31077 Toulouse, France
{Ahlem.Mifdaoui, pdss}@isae.fr – téléphone : +33 (0)4 93 00 86 06 – télécopie : +33 (0)4 93 00 82 00
– e-mail : [email protected]
7. LOGICIEL UTILISÉ POUR LA PRÉPARATION DE CET ARTICLE :
LATEX, avec le fichier de style studia-Hermann.cls,