Any correspondence concerning this service should be sent to the repository administrator: [email protected]
Open Archive Toulouse Archive Ouverte (OATAO)
OATAO is an open access repository that collects the work of Toulouse researchers and makes it freely available over the web where possible.
This is an author -deposited version published in: http://oatao.univ-toulouse.fr/
Eprints ID: 3649
To link to this article: DOI:10.1016/j.foodchem.2009.03.102 URL:
http://dx.doi.org/10.1016/j.foodchem.2009.03.102
To cite this version: Alignan, Marion and Roche, Jane and Bouniols, Andrée and Cerny, Muriel and Mouloungui, Zephirin and Merah, Othmane ( 2009) Effects of genotype and
sowing date on phytostanol-phytosterol content and agronomic traits in wheat under organic agriculture. Food Chemistry, vol. 117 (n°2). pp. 219-225. ISSN 0308-8146
Effects of genotype and sowing date on phytostanol-phytosterol content and
agronomic traits in wheat under organic agriculture
Suggestion for an abbreviated running title: Effects of genotype and sowing date on wheat phytosterol content
In memory of Andrée Bouniols who passed away in 2008.
Marion Alignan1,2, Jane Roche1,2, Andrée Bouniols1,2, Muriel Cerny1,2, Zephirin Mouloungui1,2, Othmane Merah1,2*
1Université de Toulouse; INP; LCA (Laboratoire de Chimie AgroIndustrielle);
ENSIACET, 118, Route de Narbonne, 31077 Toulouse Cedex 4, France.
2INRA; LCA (Laboratoire de Chimie AgroIndustrielle); 31029 Toulouse, France.
*Corresponding author: Dr. Othmane Merah Phone: +33 5 62 88 56 94 Fax: +33 5 62 88 57 30
Abstract
Cereals are an important source of sterols and stanols in the human diet. The present study underlines the effect of genotype and weather conditions in bread wheat, on total sterol and stanol content (TSS), agronomic traits, proteins and ash content under organic conditions. Variations in TSS as well as other characters between two sowing dates were observed. A broad genotypic variability was also reported since extreme genotypes differed by more than 30 mg 100. g-1 DW for TSS, with total stanol content varying twofold. Moreover, two groups of genotypes that differed in agronomic production, ash and protein content were depicted, based on their response to an increase in temperature. This result suggests that the genotypic factor prevails over the sowing date factor for determining sterol and stanol traits in wheat cultivated under organic conditions. Nevertheless, a strong interaction exists between the two factors, which can be used to drive bioaccumulation of these molecules.
Keywords: bread wheat, phytosterols, phytostanols, genetic variability, crop management, organic conditions, bioaccumulation.
1. Introduction
Cereal grains contain a wide variety of nutrients and bioactive molecules that play an important role in disease prevention (Halvorsen et al., 2002). Among these molecules, much attention has been focused on phytosterols in the last few years. As minor constituents of lipids, they constitute a group of cholesterol-like molecules and are characterised by the presence of a methyl or ethyl group in carbon 24 of the basic cholesterol chemical structure (Moreau, Whitaker & Hicks, 2002). Phytosterols occur in plants as free sterols and conjugated forms (Piironen, Lindsay, Miettinen, Toivo, & Lampi, 2000). They are key compounds for the formation of plant plasma membrane microdomains (Roche et al., 2008). These molecules play an essential role in the regulation of membrane fluidity and permeability by affecting the proteins associated to membranes. Moreover, they are precursors of brassinosteroids and are involved in embryogenesis (Schaller, 2003).
Phytosterols have been described as cancer-preventive bioactive molecules and have an immuno-modulating activity (Bouic, 2001). However, the most important property of phytosterols is their beneficial effect in reducing the low density lipoprotein (LDL) cholesterol level (Calpe-Berdiel, Escolà-Gil & Blanco-Vaca, 2008). According to Valsta
et al. (2004), even if the sterol level in cereals is lower than that of oilseeds, cereals
remain the major source of natural sterols in the human diet due to the large amounts consumed daily. Comparison between sterol content in cereals was performed by Piironen, Toivo & Lampi (2002). It appears clearly that rye, wheat and barley grains exhibit the highest sterol-stanol content whereas oat presented the lowest level of these same compounds. Moreover, wheat is one of the most important food crops and is grown worldwide.
Phytosterols in cereals are present in two forms: sterols and their completely saturated forms, stanols. This fact has oriented clinical experiments to focus on stanol versus sterol efficiency in reducing LDL cholesterol, and it seems that stanols are more efficient (Santos, Limas, Sousa, da Conceição Castilho, Ramos & Noronha da Silveira, 2007).
Several authors have studied total phytosterol content in grains of different cereals (Moreau, Singh, Nunez & Hicks, 2000) and in cereal by-products (Nyström, Paasonen, Lampi & Piironen, 2007; Jiang & Wang, 2005; Hakala et al., 2002). However, in these studies, sterol content was measured on commercial samples, which considerably limits source traceability. Other experiments have been carried out to study sterol and stanol levels in oat (Määttä, Lampi, Petterson, Fogelfors, Piironen & Kamal-Eldin, 1999), rye (Zangenberg, Boskov Hansen, Jorgensen & Hellgren, 2004; Piironen et al., 2002), corn
(Harrabi et al., 2008) and bamboo (Lu, Ren, Zhang & Gong, 2009) across locations as influenced by genotype under conventional conditions. However, information on the effects of genotype and environmental conditions on the stanol and sterol composition of wheat is lacking. Moreover, effect of water deficit or high temperatures on technological traits as sterols content and protein content was studied under conventional conditions where pests and diseases were managed by chemicals (Dupont
et al. 2006; Zangenberg et al., 2004; Määttä et al., 1999). In contrast, organic culture,
conducted without chemicals, can be considered as stress for plants. Thus, this agricultural method may influence molecules composition in wheat grain.
Phytosterols used in industrial preparations are chemically extracted from oil plants, and phytostanols are obtained by hydrogenation of sterols (Mouloungui, Roche & Bouniols, 2006), often by using harsh chemical methods that are not always in accordance with European Union recommendations and REACH legislation. It has in fact been
recommended to decrease different inputs, particularly chemicals, in agriculture, and to develop environmentally-friendly production and extraction methods. This latter goal could be easily reached by the improvement of sterol thresholds in plant organs.
The objectives of this work were therefore to study the genotypic variability of phytosterols and phytostanols in bread wheat cultivated under organic conditions and to examine the effect of weather conditions during grain filling on target compound content in the kernel. Relationships between sterols–stanols and protein and ash content, which are the most important quality traits, are also examined.
2. Materials and methods 2.1. Plant material
Twenty bread wheat (Triticum aestivum L.) cultivars varying in yield potential and technological traits were used in this study, as well as three other synthetic populations currently used in organic culture in France. The details of genotype characteristics are presented in Table 1.
2.2. Crop management and experimental conditions
Trials were carried out at the Regional Organic Agriculture Experimental Station in Auch (near Toulouse, south-west France, 43° 38’ 47” N, 0° 35’ 08” E). Two sowing dates were chosen. The first sowing was done on 24 November 2005. The second sowing was performed on 15 January 2006.
The crops were completely managed under organic and rainfed conditions without any chemical supply. Crushed feathers were applied as an organic fertiliser at a rate of 60 units. ha-1 in April and May for the conventional (SD1) and later (SD2) sowings, respectively. Weeds were mechanically eliminated.
The soil was a clay-loam (organic matter content: 3.2%; pH 8.1) with a depth of about 1.2 m. Table 2 shows temperature and rainfall during the plant cycle. The growing season was characterised by a total rainfall of 405 mm and 385 mm for SD1 and SD2, respectively. These amounts are 110 mm and 50 mm lower than the half-century average rainfall observed for the same period in our area. In contrast, temperature during the grain filling period was 18.4 and 22.4°C in SD1 and SD2, respectively. These temperatures were at least 2°C higher than the observed average temperature during the 50 past years in our region. It clearly appears that the grain filling period in SD2 coincided with higher temperatures and lower water availability.
The field experiments were conducted as a randomised complete block design with three replicates. Seeds were sown in 22.5 m² plots with seven rows per plot (20 cm between rows and 3 cm between plants). Anthesis occurred from beginning to mid-May and from mid-May to end-May for SD1 and SD2, respectively. Maturity took place at the end of June for SD1 and the first week of July for SD2.
2.3. Trait measurements
2.3.1. Agronomic measurements
The number of grains per ear was noted at maturity on ten ears (randomly selected) per plot. Plants were therefore separately harvested by plot in each block. The grain yield was determined by weighing and expressed in tonnes ha-1. Two samples of 1000 grains
were taken and then weighed in order to determine the thousand grains weight of each genotype in each plot. Two aliquots, each of 10 g, were sampled in order to analyse protein and sterol-stanol content separately.
The method of sterol determination was adapted from the one performed by Toivo, Lampi, Aalto & Piironen (2000). Wheat samples (1.3 g) were added to each tube containing 100 µg of cholestanol (dihydrocholesterol; Aldrich Chemicals Co.), used as an internal standard. Saponification was performed by adding ethanolic KOH (1 M) (TITRINORM, Prolabo) for 60 min at 75°C. One millilitre of distilled water was added to the samples and the unsaponifiable fraction was extracted from the saponified lipids with 6 mL of iso-hexane (Merck). Sterols and stanols were silylated by N-methyl-N-trimethylsilyl-heptafluorobutyramide (MSHFBA; Macherey-Nagel) mixed with 1-methyl imidazole (Sigma). One µL of sterol and stanol tri1-methylsilyl ether derivatives was injected into a Perkin-Elmer GC equipped with a CPSIL 5CB 30m column (i. d.: 0.25 mm), and an on-column injector. Detection was performed with a Flame Ionisation Detector. The thermal regime was the following: 160°C (0.5 min), 10°C min-1 to 260°C, 2.5°C min-1 to 300°C, 25°C min-1 to 350°C, and 350°C (1.5 min) for the oven temperature; 55°C (0.5 min), 200°C min-1 to 320°C, 30°C min-1 to 350°C, and 350°C (2.5 min) for the injector temperature; and 365°C for the detector temperature. Total phytosterols and phytostanols detected included desmethylsterols (-sitosterol, stigmasterol, campesterol, ∆-7 stigmastenol, ∆-7 avenasterol), campestanol and sitostanol. A typical GC chromatogram of the compounds analysed is shown in Fig. 1. Grain protein content was determined by NIRS (AACC method 39-11, American Association of Cereal Chemists, 2000).
The moisture content of the samples was determined by drying them (5.0 g) at 105 ± 2°C overnight. Ash content (expressed in mg. g–1 dry weight) was determined after complete combustion of the powder aliquot in a muffle furnace at 900°C and subsequent weighing of the residue. Each sample was analysed at least three times. 2.3.3. Statistical analyses
All the data were subjected to variance analysis using the GLM procedure of SAS (SAS Institute, 1987, Cary, NC, USA). Since genotypes were different in terms of flowering, there were differences for the number of days from sowing to heading. This trait was therefore taken as a covariate in an ANOVA and adjusted means were generated to overcome the effect of flowering date on other traits. The mean pairwise comparisons were based on the means test at 0.5% probability level. Correlation analysis was performed to determine the relationships between the traits using the SAS CORR procedure.
3. Results
3.1. Effect of genotype on sterol-stanol, protein and ash content in grain
In the collection studied, total sterols consisted of 21.3% stanols and 78.7% sterols, where the mean value of sterols + stanols was 65.6 mg. 100 g-1 DW. The most abundant sterol was β-sitosterol, which represented nearly 70% of the total sterols and more than half of the sterols + stanols. Campestanol and sitostanol represented nearly one third and two thirds of the total stanol content, respectively (Table 3).
Significant differences were observed among the studied genotypes for sterol-stanol level and for both protein and ash content (Table 3). Total sterol (sterols and stanols, TSS) content varied between 49.4 (Bulk 3) and 79.6 mg 100 g-1 DW (Caphorn). The largest genotypic difference was observed for stanols since values varied twofold between Orpic (highest value, richer one) and Palladio (lowest one, poorer one). From the point of view of relative value, the latter genotype was the poorest genotype in terms of stanols compared to TSS, whereas stanols represented more than a quarter of TSS in the case of Kalongo. There were significant differences among bread wheat genotypes in our collection for each sterol and stanol. Caphorn, which showed the highest value of
TSS, was the richest genotype in sterols, whereas Apache and ORP, the two other richest genotypes in TSS, exhibited the highest values in stanols. In contrast, PR22, the poorest cultivar in TSS, presented the lowest value of sterols.
A wide variability was observed among the studied genotype for ash content. This trait varied from 19.7 (Pactole) to 60.0 mg. g-1 DW (Quebon), with a mean value of 39.3 mg. g-1 DW. Protein content varied less than sterol and ash content. Pollux contained nearly 3% more proteins than Aubusson, while Caphorn and Bulk-3, extreme genotypes for TSS, showed intermediate values for protein content.
3.2. Effect of sowing date on sterol-stanol, protein and ash content in grain
The objective of different sowing dates was to study the effect of contrasted temperatures that occurred during grain filling. In this region, late sowing delays grain filling, which in turn coincides with high temperatures. Higher protein and ash content values were observed for later sowing.
Sowing date has shown a significant impact on sterol and stanol content in grain, except on stigmasterol, β-sitosterol, d7-stigmasterol content and TSS. Two response patterns were depicted. The increase in temperature during grain filling (by sowing at the later date rather than the conventional date) improved the content for several sterols but did not significantly increase the most abundant one (i.e., β-sitosterol) and the total sterol level (Table 3). In contrast, and surprisingly, sitostanol, campestanol and total stanol content decreased when temperatures increased. Despite this, a strong increase of the campestanol/sitostanol ratio was observed for delayed sowing (Table 3). A significant increase of the ratio of campesterol to β-sitosterol plus stigmasterol was observed in grain for late sowing (Table 3). Genotype by sowing date interaction was also significant for all traits (Table 3).
Two genotypic groups were different in response to high temperatures. A group made up of 18 genotypes reduced its TSS from the conventional (SD1) to the late sowing date (SD2) by more than 4.0 mg 100 g-1 DW, mainly due to the decrease in stanol content (Table 4). This group included Aubusson, Lona, Palladio, Quebon and the three bulk genotypes. In contrast, the second group composed of five genotypes (Fiorenzo, Kalongo, Orpic, Renan and Stefanus) increased TSS by nearly 13.0 mg. 100 g-1 DW (2.1 mg. 100 g-1 DW of stanols and 10.4 mg. 100 g-1 DW of desmethylsterols) from SD1 to SD2 (Table 4). Moreover, the difference between SD1 and SD2 was more pronounced for the genotypes of the former group than for the group of the five genotypes for the agronomic traits (Table 4).
3.3. Effects of sowing date and genotypes on agronomic traits
Both sowing date and genotype effects significantly influenced agronomic traits. Interaction between the two factors was also significant for all traits (Table 3).
Plants sowed at the conventional date produced more grains by spike and filled those more than grains sowed later. Consequently, grain yield was higher for conventional compared to late sowing. Large and significant genotypic differences were observed within the collection studied for agronomic traits. Saturius produced three times more grain than Esperia. Grains of Renan were more than two times heavier than those of Orpic. PR22 yielded two times more than Pollux.
4. Discussion
4.1. Effects of genotype and sowing date on agronomic traits, protein and ash content Differences were observed in agronomic traits, ash and protein content within the collection of genotypes studied (Table 3). Grain yield varied twofold between extreme
genotypes. These differences resulted from the variability in yield components (Table 3). These results were expected since genotypic variability in agronomic traits had been widely reported in cereals (Xu, Yuan, Li & Monneveux, 2007; Asseng and Milroy, 2006; Merah, Deléens, Souyris & Monneveux,2001). Similarly, protein and ash content varied considerably among the studied genotypes (Table 3), confirming results of previous reports in several cereals (Ma et al., 2007; Xu et al., 2007; Roussel, Branlard, Vezine, Bertrand & Balfourier, 2005; Merah et al., 2001).
Significant differences were observed for all traits between the two sowing dates (Table 3). Late sowing induced a decrease in agronomic characteristics. This decrease is probably related to the difference in weather conditions between the two sowing dates, primarily during the grain filling period (Xu et al., 2007; Merah, Deléens & Monneveux, 1999). It clearly appears that terminal drought and higher temperatures were more pronounced at the late sowing date (Table 2). This may explain the differences in grain yield between SD1 and SD2, resulting from the decrease in the number of grains per ear and the grain weight due to increasing stress (Asseng & Milroy, 2006; Spiertz, Hamer, Xu, Primo-Martin, Don, & van der Putten, 2006).
The negative correlation between ash content and grain yield (r = 0.50, P > 0.01, DF = 44) found in our study is in agreement with reports of Xu et al. (2007) and Merah et al. (2001, 1999). These reports suggest that minerals accumulate in grains by phloem transport rather than passively from the transpiration stream. Therefore, mineral accumulation in the grain primarily depends on translocation from the leaves and on minerals removed from the lower parts of the plant after the onset of senescence. As a consequence, genotypes that cannot maintain high rates of stomatal conductance and photosynthesis during grain filling would fill their grains through retranslocation of photoassimilates from preanthesis reserves, and of minerals from early senescent
vegetative tissues (Merah et al., 2001). The ash concentration in grain could be an indication of the importance of the retranslocation processes during grain filling (Merah
et al., 1999). These results suggest that grain ash content is higher in genotypes more
affected by drought and higher temperatures during grain filling. Moreover, Xu et al. (2007) reported that higher temperatures, drought or both induced an increase of grain ash content, regardless of genotype tolerance.
Differences between SD1 and SD2 in grain protein content were also observed. This result means that variation in protein content was a consequence of agronomic practices (late sowing in this case) due to differences in weather conditions, for the same location and the same genotype. Previous studies have emphasized the increase of protein content in grain or in flour as a result of moisture stress (Saint Pierre et al., 2008) and high temperatures (Asseng and Milroy, 2006; Dupont et al., 2006; Spiertz et al., 2006). It has been reported that higher temperatures as well as water stress during the grain filling period induces more of an increase in nitrogen accumulation than in dry weight accumulation, leading to higher protein content in grain (Asseng and Milroy, 2006; Dupont et al., 2006; Spiertz et al., 2006). In our study, the average temperature during grain filling was 4°C higher for plants that were grown later than the conventional sowing date, in conjunction with low water availability (Table 2). As a consequence, plants sowed later accumulate less dry matter per grain but increase their protein content (Table 3). Thousand grains weight was in fact 6 g lower in SD2 than in SD1, whereas the grain accumulated more proteins in late sowing than in conventional sowing (Table 3), thereby confirming previous reports. This is also supported by the negative correlation found between protein content and grain yield (r = -0.71, P < 0.001, df = 44).
4.2. Effects of genotype and sowing date on phytosterol and phytostanol content
In our study, the range of genotypic variation was from 49.4 to 79.6 mg. 100 g-1 DW. This wide range of variation was similar to those reported for wheat grain in other studies. Piironen et al. (2002) reported a mean value of two wheat genotypes of 69.0 mg. 100 g-1. Analysis of whole grains of commercial samples revealed 78.3 mg. 100 g-1 D W (Nyström et al., 2007). It is clear that the range of variation in total sterol level in bread wheat grain observed within our collection is similar to those reported in the few studies done on wheat grain. Nevertheless, our results cannot be compared to those observed elsewhere. There are several reasons for this discrepancy. The main studies dealing with sterol content in grain or other plant organs were done on commercial samples. These samples may come from bulk grains of several genotypes obtained from crops in different locations and under different climates, and information on growing conditions in these studies was inadequate. Moreover, our study was done under organic conditions that are considered to be stressed growing conditions and that probably influence the potential expression of the genotypes.
The second reason is the difference in analytical methodology for sterol analysis. In our study, we focused on sterols and steryl fatty acid esters, whereas Nyström et al. (2007) and Piironen et al. (2002) also assessed conjugated forms. In spite of this difference, our values were similar to those of Piironen et al. (2002).
The third reason was that results reported in the different studies were expressed in lot of units and the comparison was therefore not possible. This fact has already been reported by Zangenberg et al. (2004). These authors, as well as Määttä et al. (1999), highlighted the influence of genotypes on sterol content in cereal grains, which could also partially explain the different values observed between our study and the other studies mentioned above.
The fourth reason was that the studies differed by the number and the genotypes used for the evaluation of sterol and stanol content. A large variation was observed for sterol and stanol content within the collection of bread wheat genotypes studied. Genotypic variation was reported for sterol content among seven oat cultivars (Määttä et al., 1999) and three rye cultivars (Zangenberg et al., 2004). Piironen et al. (2002) also reported differences in four cereals. In the latter study, the difference reported between the two genotypes used was 5.0 mg. 100 g-1 DW. This difference represents nearly a quarter of the observed genotypic range within our collection. For the other cereal species, genotypic ranges for TSS were quite lower than those observed in our study (Zagenberg
et al., 2004; Piironen et al., 2002; Määttä et al., 1999). Even if the range of genotypic
variation for stanol content was wider in our study, the mean reported value was quite equivalent to the values reported by Piironen et al. (2002) in wheat.
A difference was observed between the two sowing dates for campesterol. Surprisingly, sitostanol strongly decreased in later sowing, which in turn induced a reduction of stanol content in the grain. Consequently, TSS was lower in later sowing. In rye, a decrease of sitostanol was observed for three genotypes across years (Zagenberg et al., 2004). Unfortunately, climatic conditions were not recorded in this study and we can therefore not effectively compare our results to those obtained by Zagenberg et al. (2004).
In sunflower, high temperatures (late sowing) induce an increase of sterol content in the kernels (Roche, Bouniols, Mouloungui, Barranco & Cerny, 2006; Valsta et al., 2004). Other studies have reported that variations in temperature may cause a difference in sterolic profiles, mostly for campesterol vs. stigmasterol + β-sitosterol (Schaller 2003; Hartmann 1998). In our study, we observed that the ratio of campesterol to stigmasterol + β-sitosterol (hereafter C/SSr) was not significantly different between SD1 and SD2. In
contrast, the ratio of campestanol to sitostanol (hereafter referred to as C/Sn) strongly increased at the later sowing date (Table 3). This was due to the concomitant decrease of sitostanol with the slight reduction of campestanol in the grain from later sowing. However, this is a general tendency and the two groups were differentiated on the basis of their response to higher temperatures. The first one (GRP1), made up of five genotypes, increased its TSS as a result of the increase in the stanol level and of desmethylsterols, in particular. In contrast, in the second group (GRP2), composed of 18 genotypes, high temperatures led to a decrease of sterol and particularly stanol content (Table 4). Moreover, the genotypes of the former group had increased levels of mainly -sitosterol and sitostanol from the conventional to the delayed sowing. These two components were the main molecules that were reduced by high temperatures in the second group. Sterols and stanols play an important role in membrane fluidity and permeability (Schaller, 2003; Moreau et al., 2002). Changes in the physical properties of membranes reflect variations in their composition resulting from alterations in metabolic processes. These processes are accompanied by an increase in the sterol-to-phospholipid ratio (Itzhaki, Borochov & Mayak, 1990; Borochov and Woodson, 1989). Moreover, membrane fluidity is not only influenced by the level of sterols but also by the change in their composition (Schaller, 2003; Moreau et al., 2002). It seems that the increase in -sitosterol content increases membrane fluidity, which in turn changes metabolic cell functioning. In contrast, the increase of campesterol content reduces the physical properties of the membrane, thus leading to increased fluidity. Variation in desmethylsterols (represented in our study by C/SSr) may result from the activity of sterol-methyl-transferase 2 (SMT2) (Schaeffer, Bronner, Benveniste & Schaller, 2001). Interestingly, Schaller (2003) reported the importance of genotypic factor on this ratio, which is in accordance with our results (Tables 3 and 4). Moreover, our study
emphasized the effect of temperature on C/SSr in grain, confirming previous reports on
Arabidopsis (Schaeffer et al., 2001). Delayed sowing coincided with high temperatures
during grain filling (Table 2). These conditions induced an increase in -sitosterol and sitostanol from conventional to delayed sowing in GRP1. A decrease of these sterols and stanols was observed for GRP2 with high temperatures (Table 4). In addition, the C/SSr ratio as well as the C/Sn ratio remained fairly constant in the former group, whereas these ratios increased for GRP 2 due to the decrease of -sitosterol and sitostanol (Table 4).
In our study, different responses to high temperatures of the two groups of genotypes for agronomic traits were found. Grain yield and its component decreased with high temperature. This decrease was more pronounced in GRP2 than in GRP1 (Table 4). Similarly, genotypes of GRP2 accumulated 1.5 times more minerals in their grains in SD2 than in SD1, whereas genotypes belonging to GRP1 maintained a constant ash content (Table 4). We hypothesized that the difference in tolerance of high temperature and water shortage exists between the two groups of genotypes. Among the numerous mechanisms involved in this expressed genotypic difference, there is a difference in the maintenance of membrane fluidity. This could be the result of an increase in sterol content, which induces the changes in the physical properties of membranes and may therefore cause alterations in cell functioning and plant development, depending on the timing of the alterations during the plant cycle (Itzhaki et al., 1990; Borochov and Woodson, 1989). Our results also suggest that genotype effect was the main factor influencing sterol content.
No significant correlation was found between sterols and agronomic traits (data not shown). Sterol content was not related to protein content in our study (r=0.05, df= 44). The relationship between sterol and protein content has not been studied in cereals.
However, phytosterols are distributed in endosperm, germ and pericarp (Harrabi et al., 2008), while proteins are localised in the aleurone cell layer. This fact could explain the lack of correlation in the accumulation of the two compounds. In sunflower cultivated under different water availability conditions, no significant correlation was found between protein and sterol content in the grain (Roche, 2005). This result is very interesting. If confirmed, it would mean that improvement of both sterol and protein content is possible and may be easily feasible within a selection programme.
5. Conclusion
Wheat is among the major sources of sterols and stanols. A wide variability of sterol and stanol content exists in bread wheat cultivated under organic conditions. Although the main factor remained the genotype, our data revealed a strong interaction with weather conditions that could easily be managed to promote the accumulation of targeted sterols or stanols and to provide added value to the wheat grain. Sterol and stanol content seems to be independent from other technological traits and, therefore, may be easily improved without any negative interaction with other characters of interest. These results are interesting and should be studied under other climatic conditions and with other genotypes. Much attention is being focused on functional foods at this time. The accumulation of compounds of interest such as sterols in plants should facilitate their extraction by soft methods, ultimately benefiting the consumer.
Acknowledgements
We would like to thank the European Union for financially supporting this work (FEDER 7440 and 12688). Thanks are due to Loïc Prieur and Laurent Laffont from CREAB for help in experiments and for providing grains. The participation
of Dr. O. Merah was supported by IUT Paul Sabatier, Toulouse (University of Toulouse III), France.
References
Asseng, S., & Milroy, S. P. (2006). Simulation of environmental and genetic effects on grain protein concentration in wheat. European Journal of Agronomy, 25(2), 119-128. Borochov, A., & Woodson, W. R. (1989). Physiology and biochemistry of flower petal senescence. Horticultural Reviews, 11, 15-43.
Bouic, P. J. D. (2001). The role of phytosterols and phytosterolins in immune modulation: a review of the past 10 years. Current Opinion in Clinical Nutrition and
Metabolic Care, 4, 471–475.
Calpe-Berdiel L., Escolà-Gil J.C., & Blanco-Vaca F. (2008). New insights into the molecular actions of plant sterols and stanols in cholesterol metabolism.
Atherosclerosis, In Press, Corrected Proof, Available online 6 July 2008.
Dupont, F. M., Hurkman, W. J., Vensel, W. H., Tanaka, C., Kothari, K. M., Chung, O. K., & Altenbach, S. B. (2006). Protein accumulation and composition in wheat grains: Effects of mineral nutrients and high temperature. European Journal of Agronomy, 25(2), 96-107.
Hakala, P., Lampi, A.M., Ollilainen, V., Werner, U., Murkovic, M., Wähälä, K., Karkola, S., & Piironen, V. (2002). Steryl phenolic acid esters in cereals and their milling fractions. Journal of Agriculture and Food Chemistry, 50, 5300-5307.
Harrabi, S., St-Amand, A., Sakouhi, F., Sebei, K., Kallel, H., Mayer, P. M., & Boukhchina, S. (2008). Phytostanols and phytosterols distributions in corn kernel. Food
Chemistry, 111, 115–120.
Hartmann, M.-A. (1998). Plant sterols and the membrane environment. Trends in plant
Itzhaki, H., Borochov, A., & Mayak, S. (1990). Age-related changes in petal membranes from attached and detached rose flowers. Plant-Physiology, 94(3), 1233-1236.
Jiang, Y., & Wang, T. (2005). Phytosterols in Cereal By-products. Journal of American
Oil Chemist’s Society, 82(6), 439-444.
Lu, B., Ren, Y., Zhang, Y., & Gong, J. (2009). Effects of genetic variability, parts and seasons on the sterol content and composition in bamboo shoots. Food Chemistry, 112, 1016–1021.
Ma, W., Sutherland, M. W., Kammholz, S., Banks, P., Brennan, P., Bovill, W., & Daggard, G. (2007). Wheat flour protein content and water absorption analysis in a doubled haploid population. Journal of Cereal Science, 45(3), 302-308.
Määttä, K., Lampi, A.M., Petterson, J., Fogelfors, B. M., Piironen, V., & Kamal-Eldin, A. (1999). Phytosterol content in seven oat cultivars grown at three locations in Sweden. Journal of the Science of Food and Agriculture, 79, 1021-1027.
Merah O., Deléens E., & Monneveux P. (1999). Grain yield, carbon isotope discrimination and carbon, mineral and silicon content in leaf and mature kernels of durum wheat under different precipitation regimes. Physiologia Plantarum, 107, 387-394.
Merah, O., Deléens, E., Souyris, I., & Monneveux, P. (2001). Ashes content might predict carbon isotope discrimination and grain yield in durum wheat. New Phytologist, 149, 275-282.
Moreau, R. A., Singh, V., Nunez, A., & Hicks, K.B. (2000). Phytosterols in the aleurone layer of corn kernels. Biochemical Society Transactions, 28(6), 803-806.
Moreau, R. A., Whitaker, B. D., & Hicks, K. B. (2002). Phytosterols, phytostanols, and their conjugates in foods: structural diversity, quantitative analysis, and health-promoting uses. Progress in Lipid Research, 41(6), 457-500.
Mouloungui, Z., Roche, J., & Bouniols, A. (2006). Limitations extractives des ingrédients fonctionnels natifs : lipides bioactifs par modifications chimiques.
Oléagineux, Corps gras, Lipides, 13, 16-22.
Nyström, L., Paasonen, A., Lampi, A.M., Piironen, V. (2007). Total plant sterols, steryl ferulates and steryl glycosides in milling fractions of wheat and rye. Journal of Cereal
Science, 45, 106–115.
Piironen, V., Lindsay, D. G., Miettinen, T. A., Toivo, J., & Lampi, A. M. (2000). Plant sterols: biosynthesis, biological function and their importance to human nutrition.
Journal of the Science of Food and Agriculture, 80, 939-966.
Piironen, V., Toivo, J., & Lampi, A. M. (2002). Plant sterols in cereals and cereal products. Cereal Chemistry, 79(1), 148-154.
Roche, J. (2005). Ph.D. Thesis. Institut National Polytechnique de Toulouse, Toulouse (France) 2005.
Roche, J., Bouniols, A., Mouloungui, Z., Barranco, T., & Cerny, M. (2006). Management of environmental crop conditions to produce useful sunflower oil components. European Journal of Lipid Science and Technology, 108, 287–297.
Roche, Y., Gerbeau-Pissot, P., Buhot, B., Thomas, D., Bonneau, L., Gresti, J., Mongrand, S., Perrier-Cornet, J.M., & Simon-Plas, F. (2008). Depletion of phytosterols from the plant plasma membrane provides evidence for disruption of lipid rafts. FASEB
Journal, 22, 3980-3991.
Roussel, V., Branlard, G., Vezine, J. C., Bertrand, D., & Balfourier, F. (2005). NIRS analysis reveals temporal trends in the chemical composition of French bread wheat
accessions cultivated between 1800 and 2000. Journal of Cereal Science, 42(2), 193-203.
Saint-Pierre, C., Peterson, C. J., Ross, A. S., Ohm, J. B., Verhoeven, M. C., Larson, M., & Hoefer, B. (2008). Winter wheat genotypes under different levels of nitrogen and water stress: changes in grain protein composition. Journal of Cereal Science, 47(3), 407-416.
Santos, R., Limas, E., Sousa, M., da Conceição Castilho, M., Ramos, F., & Noronha da Silveira, M. I. (2007). Optimization of analytical procedures for GC–MS determination of phytosterols and phytostanols in enriched milk and yoghurt. Food Chemistry, 102, 113–117.
Schaeffer, A., Bronner, R., Benveniste, P., & Schaller, H. (2001). The ratio of campesterol to sitosterol that modulates growth in Arabidopsis is controlled by STEROL METHYLTRANSFERASE 2;1. The Plant Journal, 25(6), 605-615.
Schaller, H. (2003). The role of sterols in plant growth and development. Progress in
Lipid Research, 42, 163–175.
Spiertz, J. H. J., Hamer, R. J., Xu, H., Primo-Martin, C., Don, C., & van der Putten, P.E.L. (2006). Heat stress in wheat (Triticum aestivum L.): effects on grain growth and quality traits. European Journal of Agronomy, 25(2), 89-95.
Toivo, J., Lampi, A. M., Aalto, S., & Piironen, V. (2000). Factors affecting sample preparation in the gas chromatographic determination of plant sterols in whole wheat flour. Food Chemistry, 68, 239-245.
Valsta, L. M., Lemstrom, A., Ovaskainen, M. L., Lampi, A. M., Toivo, J., Korhonen, T., & Piironen, V. (2004). Estimation of plant sterol and cholesterol intake in Finland: quality of new values and their effect on intake. British Journal of Nutrition, 92(4), 671-678.
Xu, X., Yuan, H., Li, S., & Monneveux, P. (2007). Relationship between Carbon Isotope Discrimination and Grain Yield in Spring Wheat under Different Water Regimes and under Saline Conditions in the Ningxia Province (North-west China).
Journal of Agronomy and Crop Science, 193(6), 422-434.
Zangenberg, M., Boskov Hansen, H., Jorgensen, J.R., Hellgren, L.I. (2004). Cultivar and Year-to-Year Variation of Phytosterol Content in Rye (Secale cereale L.). Journal
Figure caption 1
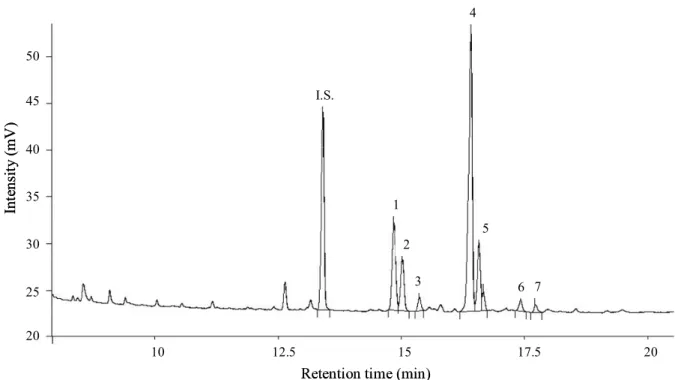
Figure 1. A typical GC chromatogram of sterols and stanols found in bread wheat 2
kernel. I.S. (internal standard) cholestanol, 1. campesterol, 2. campestanol, 3. 3
stigmasterol, 4. β-sitosterol, 5. stigmastanol, 6. ∆-7 stigmastenol, 7. ∆-7 avenasterol. 4
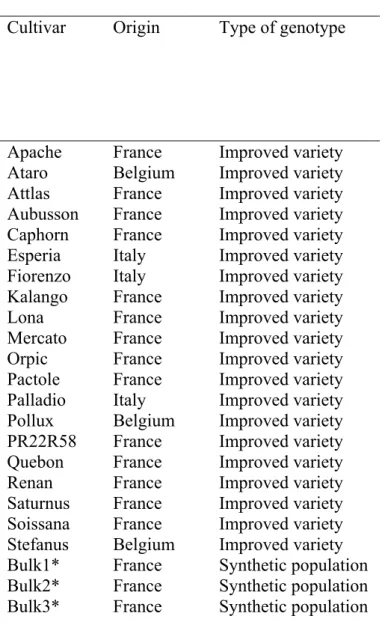
Table 1. Cultivars of bread wheat used in this study. Cultivar Origin Type of genotype
Apache Ataro Attlas Aubusson Caphorn Esperia Fiorenzo Kalango Lona Mercato Orpic Pactole Palladio Pollux PR22R58 Quebon Renan Saturnus Soissana Stefanus Bulk1* Bulk2* Bulk3* France Belgium France France France Italy Italy France France France France France Italy Belgium France France France France France Belgium France France France Improved variety Improved variety Improved variety Improved variety Improved variety Improved variety Improved variety Improved variety Improved variety Improved variety Improved variety Improved variety Improved variety Improved variety Improved variety Improved variety Improved variety Improved variety Improved variety Improved variety Synthetic population Synthetic population Synthetic population
Table 2. Prevailing weather conditions during the plant cycle at two different sowing dates (conventional (SD1) and late (SD2) sowings) in Auch (south-west France, near Toulouse). Comparisons are made with the half-century average values of precipitation and temperatures in the same location.
2005-2006 Last 50years
Phenological period Weather parameter
SD1 SD2 SD1 SD2
Grain filling
Plant cycle
Rainfall (mm)
Mean temperature (°C) Temperature sum (°C/day) Rainfall (mm)
Mean temperature (°C) Temperature sum (°C/day)
95.8 18.4 1120.2 405.0 9.9 2398.7 78.0 22.4 1369.7 385.4 13.3 2922.4 112.9 16.7 1014.7 515.0 11.3 2452.9 81.0 19.7 1203.8 434.1 12.4 2839.7
Table 3. Sterol and stanol content (mg 100g-1DW), grain protein content (%), ash content (mg g-1DW) grain yield (t/ha), number of grains per spike (NGS), and thousand grains weight (TGW, g) of 23 genotypes of bread wheat grown under rainfed conditions in Auch (south-west France) at two sowing dates (conventional (SD1) and late (SD2)).
Trait SD1 SD2 Overall Genotype
(G) df=22 Sowing date (SD) df=1 G x SD DH LSD Mean SE Mean
SE rol Stigmasterol β-Sitosterol C/SSr Desmethysterols Campestanol Sitostanol C/Sn Total stanols Total sterols+stanols Protein content Ash content NGS TGW Grain yield 10.2B 1.8A 35.7A 0.27B 50.8A 5.0A 10.0A 0.52B 15.0A 65.8A 12.1B 32.9B 54.2A 34.0A 2,6A 1.6 0.3 3.9 0.02 5.7 1.1 2.0 0.14 2.5 6.6 0.7 7.9 13.6 3.5 0.5 10.8A 1.8A 36.0A 0.29A 51.6A 5.2A 8.4B 0.64A 13.6B 65.4A 12.5A 45.7A 37.9B 28.3B 2.2B 2.0 0.4 4.8 0.03 6.4 1.4 2.3 0.15 3.2 8.9 0.6 6.3 10.6 3.1 0.4 10.5 1.8 35.9 0.28 51.3 5.2 9.2 0.58 14.4 65.6 12.3 39.3 45.9 31.0 2.4 6.8 - 14.3 1.3 – 2.8 26.4 – 43.5 0.22 – 0.33 39.6 – 62.1 2.4 – 7.9 4.2 – 13.0 0.29 – 0.89 7.8 – 19.9 49.4 - 79.6 10.4 – 13.2 19.7-60.0 23.3 – 86.7 23.3 – 39.5 1.5 – 3.6 14.9*** 0.5*** 65.7*** 0.00*** 121.8*** 7.3**** 20.2*** 0.1*** 39.3*** 206.6*** 2.1*** 118.5*** 856.3*** 72.6*** 94.1*** 15.9*** 0.1ns 2.9ns 0.01*** 0.2ns 0.8ns 83.8*** 0.49*** 68.5*** 19.2ns 6.9*** 5609.0*** 9071.9*** 1145.3*** 668.1*** 4.4*** 0.2*** 49.4*** 0.00*** 96.7*** 1.7** 6.2*** 0.04*** 8.9** 156.9*** 2.0** 82.4** 3600.3*** 815.9** 634.9*** 1.2ns 0.1ns 4.4ns 0.0ns 10.9ns 0.1ns 1.1ns 0.0ns 2.0ns 18.4ns 0.4ns 1.0ns 8860.0*** 1162.7*** 638.0*** 0.3 0.1 0.9 0.0 1.3 0.3 0.4 0.0 0.7 1.8 0.2 2.3 5.7 0.9 1.1
† Values presented are mean (across genotypes) and standard error (SE) values. Means indicated by a different letter are significantly different (P≤0.05). LSD: least significant difference. For each trait, F-value and degrees of freedom (df) of the genotype, sowing date and
their interactions (GxSD), as well as the covariate effect of the number of days from sowing to heading (DH), are also displayed. ** and *** significance at 0.01 and 0.001 probability levels, respectively. ns: not significant. C/SSr: ratio of campesterol to stigmasterol + β-sitosterol; C/Sn: ratio of campestanol to sitostanol.
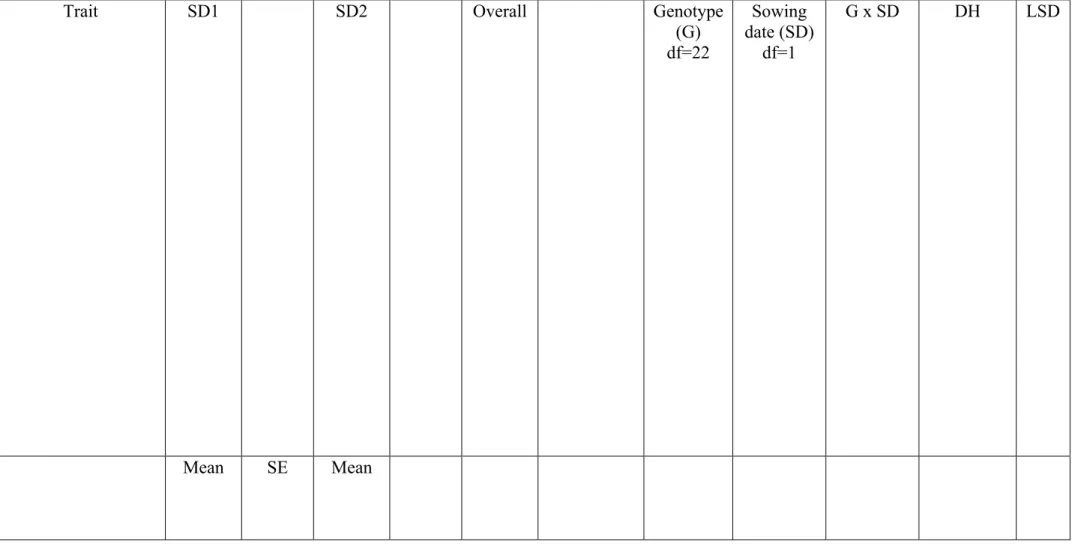
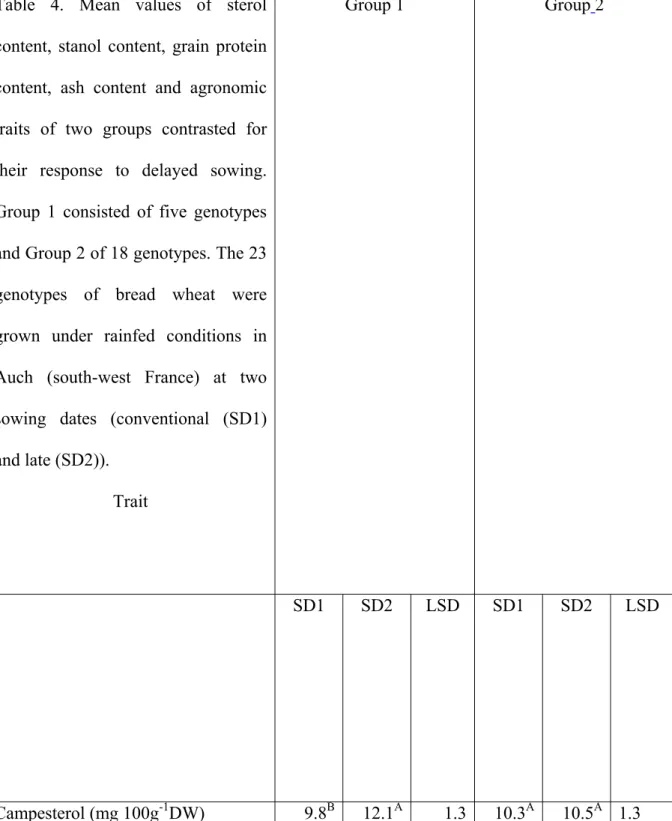
Table 4. Mean values of sterol content, stanol content, grain protein content, ash content and agronomic traits of two groups contrasted for their response to delayed sowing. Group 1 consisted of five genotypes and Group 2 of 18 genotypes. The 23 genotypes of bread wheat were grown under rainfed conditions in Auch (south-west France) at two sowing dates (conventional (SD1) and late (SD2)).
Table 4. Mean values of sterol content, stanol content, grain protein content, ash content and agronomic traits of two groups contrasted for their response to delayed sowing. Group 1 consisted of five genotypes and Group 2 of 18 genotypes. The 23 genotypes of bread wheat were grown under rainfed conditions in Auch (south-west France) at two sowing dates (conventional (SD1) and late (SD2)).
Trait
Group 1 Group2
SD1 SD2 LSD SD1 SD2 LSD
Stigmasterol (mg 100g-1DW) β-Sitosterol (mg 100g-1DW) C/SSr Desmethylsterols (mg 100g-1DW) Campestanol (mg 100g-1DW) Sitostanol (mg 100g-1DW) C/Sn Total stanols (mg 100g-1DW) Total sterols+stanols (mg 100g-1DW) Protein content (%) Ash content (mg g-1DW) Number of grains per spike Thousand grains weight (g) Grain yield (t/ha)
1.8A 33.7B 0.28A 47.5B 5.2A 10.2A 0.52A 15.4A 64.7B 12.4A 40.1 53.9A 34.4A 2.6A 2.2A 41.0A 0.28A 57.9A 6.1A 11.4A 0.54A 17.5A 76.8A 12.8A 46.7 35.7B 29.9B 2.3A 0.6 4.5 0.0 6.0 1.9 2.1 0.2 3.0 8.1 0.5 7.5 11.9 6.5 0.5 1.9A 36.3A 0.27 51.8A 5.0A 9.9A 0.52B 14.9A 68.7A 12.0B 33.5B 54.2A 34.0A 2.6A 1.7A 34.7A 0.29 50.0A 5.0A 7.7B 0.67A 12.7B 64.2A 12.5A 45.5A 38.8B 28.1B 2.2B 0.3 2.9 0.0 4.0 0.8 1.3 0.1 1.8 5.0 0.5 8.3 9.0 2.0 0.3
C/SSr: ratio of campesterol to stigmasterol + sitostanol; C/Sn: ratio of campestanol to β-sitosterol.
20 25 30 35 40 45 50 10 12.5 15 17.5 20 I.S. 1 2 3 4 5 6 7
Retention time (min)
In te ns it y (mV ) 20 25 30 35 40 45 50 10 12.5 15 17.5 20 I.S. 1 2 3 4 5 6 7
Retention time (min)
In te ns it y (mV )
Figure 1. A typical GC chromatogram of sterols and stanols of bread wheat kernel. I.S. (internal standard) cholestanol, 1. campesterol, 2. campestanol, 3. stigmasterol, 4. β-sitosterol, 5. stigmastanol, 6. ∆-7 stigmastenol, 7. ∆-7 avenasterol.