POLYMÈRES DE COORDINATION LUMINESCENTS 1D et 2D AVEC DES
LIGANDS RIGIDES CONTENANT DU Pt(II) MONTRANTS DES
PROPRIETES D’ADSORPTION DU CO2
Par
Frank Juvenal
Mémoire présenté au Département de chimie en vue de l’obtention du grade de Maître ès Sciences (M. Sc.)
FACULTÉ DES SCIENCES
UNIVERSITÉ DE SHERBROOKE
ii
LUMINESCENT 1D-AND 2D-COORDINATION POLYMERS
CONSTRUCTED WITH RIGID Pt(II)-CONTAINING LIGANDS
EXHIBITING CO2 ADSORPTION PROPERTIES
by
Frank Juvenal
Thesis presented to Chemistry Department to obtain a degree of Masters of Science (M. Sc.)
FACULTÉ DES SCIENCES
UNIVERSITÉ DE SHERBROOKE
iii Le jury a accepté le mémoire de monsieur Frank Juvenal
dans sa version finale.
Membres du jury
Professeur Pierre D. Harvey Directeur de recherche Département de chimie
Professeur Patrick Ayotte Évaluateur interne Département de chimie
Professeure Gessie Brisard Présidente-rapporteure Département de chimie
iv
SOMMAIRE
La conception de nouveaux matériaux fonctionnels a une longue histoire. Durant les deux dernières décennies, le domaine des polymères organiques et inorganiques a attiré l'attention des chercheurs. Plus important encore, les matériaux poreux tels que les Metal Organic Frameworks
(MOFs), en anglais, Covalent Organic Frameworks (COFs), en anglais, ainsi que des polymères
de coordination poreux sont maintenant étudiés de manière intensive en raison de leurs applications potentielles, comprenant le stockage de gaz, la séparation de gaz, la catalyse et la détection. D'un autre côté, les polymères contenant du Pt ont montré l'application potentielle dans les cellules solaires et les diodes électroluminescentes. Le mémoire est divisé en trois sections principales présentant des résultats nouveaux.
Dans la première section, le chapitre 2 traite essentiellement de la formation de polymères de coordination (CP) avec des sels CuX (X = Cl, Br, I) et trans-[p-MeSC6H4C≡C-Pt(PMe3)2
-C≡CC6H4SMe] (L1), soit dans le PrCN ou PhCN. Les polymères résultants sont soit 2D
(bidimensionel) ou 1D (unidimensionel). Cependant, en presence de PrCN ou de PhCN, le CP 2D obtenu avec le CuBr n'a pas incorporé de solvant dans ses espaces vides. D'autre part, le CP 2D et le reste des CP 1D obtenus avaient soit des molécules de solvant de cristallisation dans leurs cavités ou coordonnés au cuivre sur la chaîne. Les unités cuivre-halogénures étaient soit des rhomboïdes Cu2X2 ou le cubane Cu4I4. Leurs mesures photophysiques en présence et en l'absence de molécules
de solvant de cristallisation ont été effectuées. En outre, la porosité du CP a été évaluée par BET (N2 à 77 K). Le vapochromisme du CP 2D sans solvant et des CP 1D ont été étudiés, ainsi que les
mesures de sorption du CO2 ont été effectuées.
De plus, nous avons utilisé CuCN et L1 dans MeCN pour former de nouveaux CP’s. Ceci est rapporté dans la deuxième section, le chapitre 3. Le CP obtenu était inattendu : L1 s’est rompu et du cyanure CN‾ s’est coordonné sur le Pt. Ceci a conduit à la formation d’un CP 1D zigzag. Généralement, les CP sont formés avec L1 via des liens Cu-S ou/et Cu(2-C≡C), mais pas dans le
cas du CuCN qui lui forme une chaîne 1D (CuCN)n où le L1 rompu se lie avec cette chaîne via un
lien Cu-N. Les propriétés photophysiques et de stabilité thermique ont été étudiées.
La troisième section (Chapitre 4) traite d'une exploration des CP formés par la reaction des sels CuX (X = Cl, Br, I) et le trans-[p-MeSC6H4C≡C-Pt(PMe3)2-C≡CC6H4SMe] (L1) ou le
v
L'utilisation de L1 a donné lieu à un CP 2D ou 1D CPs avec le MeCN piégé à l'intérieur des cavités, il y a de l’espace vide. L2 a conduit uniquement à des CP 1D sans molecules de solvant de cristallisation. Des analyses thermogravimétriques, photophysique et des mesures d’adsorption de gaz (uniquement pour ceux avec du solvant) ont été étudiées.
MOTS CLÉS:
Metal Organic Frameworks (MOFs) (en anglais), Covalent Organic Frameworks (COFs) (en
anglais), Polymères de coordination poreux, Les clusters cuivre-halogénures, vapochromisme, propriétés photophysiques et stabilité thermique, adsorption de gaz.
vi
SUMMARY
The design of new functional materials has a long history. For the past two decades, the field of organic and inorganic polymers has attracted attention of researchers. More importantly, porous materials such as Metal Organic Frameworks (MOFs), Covalent Organic Frameworks (COFs) as well as porous coordination polymers are now being intensively studied due to their potential applications including gas storage, gas separations, catalyst and sensing. On another hand, Pt-containing polymers have shown potential applications in solar cells and light emitting diodes. The masters’ thesis is mainly divided into three main sections presenting new results.
In the first section; Chapter 2 mainly discusses the formation of coordination polymers with CuX salts (X= Cl, Br, I) and trans-[p-MeSC6H4C≡C-Pt(PMe3)2-C≡CC6H4SMe] (L1), in either PrCN or
PhCN. The resulting polymers obtained were 2D (bidimensional) CPs or 1D (unidimensional) CPs in all cases. However, 2D CPs obtained when CuBr salt is used by either using PrCN or PhCN did not incorporate the solvents in their cavities. On the other hand, the 2D CP and the rest of 1D CPs obtained had either the crystallization molecules in the cavities or coordinated to the copper cluster. The copper-halide clusters were either the rhomboids Cu2X2 fragments or the step cubane Cu4I4.
The photophysical measurements in the presence and absence of solvent crystallization molecules were performed. In addition, the porosity of the CPs was evaluated by adsorption isotherms. The vapochromism of the solvent-free 2D and 1D CPs were investigated as well as CO2 sorption
measurements were perfomed.
Furthermore, we then attempted to use CuCN and L1 in MeCN which is reported in the second section as Chapter 3. The obtained CP was unexpected as L1 broke and a cyanide (CN‾) ion coordinated to the Pt atom leading to the formation of zigzag 1D CP. The coordination bonds Cu-S or/and Cu(2-C≡C) were generally observed with L1, but not in the CuCN case. Instead a 1D
chain of (CuCN)n was made and the broken L1 now binds the chain via a Cu-N bond. The
photophysical and thermal stability properties were studied.
Lastly, the third section, Chapter 4 deals with a potential predictability of CP formation by using CuX salts (X= Cl, Br, I) and either trans-[p-MeSC6H4C≡C-Pt(PMe3)2-C≡CC6H4SMe] (L1) or
trans-[p-MeSC6H4C≡C-Pt(PEt3)2-C≡CC6H4SMe] (L2) in MeCN as the solvent. The use of L1
vii
1D CPs without MeCN being present in their cavities. The thermogravimetric, photophysical as well as gas sorption measurements (only for those with crystalisation molecules) were perfomed.
KEY WORDS:
Metal Organic Frameworks (MOFs), Covalent Organic Frameworks (COFs), Porous coordination polymers, copper-halide clusters, vapochromism, photophysical and thermal stability properties, gas sorption measurements.
viii
ACKNOWLEDGEMENTS
I would like to sincerely thank my supervisor, Prof. Pierre D. Harvey for the support and training that he gave me for the past two years during my entire project. He has always been there for me whenever I encountered any problem by guiding me the whole time. I also thank him for the lab facilities/ instruments that were provided in order to complete the project.
I also thank all the past and the current members of our research group for their support and encouragement throughout the past two years including: Dr. Leo Bucher, Dr. Antoine Bonnot, Mr. Adam Langlois, Dr. Di Gao, Dr. Shawkat Aly, Dr. Xiaorang Wong, Mr. Hu Lei, Mr. Gabriel Marinneau-Plante, Mr. Luo Peng, Mr. Ahmed Soliman, Mr. Loïc Tanguy, Mr. Adrien Schlachter, Ms. Isabelle Cantin-Savoie, Mr. Antoine Buisson and Mr. Chad Normandin.
I thank the various staff members at the Université de Sherbrooke who assisted me tremendously throughout the project including: Dr. Daniel Fortin (crystal structures), Mr. Carl St. Louis and Mrs. Regina Zamojska (TGA), Mr. Paul-Ludovic Karsenti (quantum yield), Sonia Blais (elemental analysis). I would also like to thank Prof. Patrick Ayotte and Prof. Gessie Brisard for being on the jury committee for my Master’s thesis.
In addition, I would like to thank my family and different people for their support: my brother, Mr. Peter Frank and the rest of my family; Mr. Stephen Stafford; Mrs. Kathryn Stafford; Mrs. Lissa McRae, Prof. William Robson, Dr. Mary Hill, Mr. Jonathan Gutstein-Ziv and Mr. Chris Hornibrook. Moreover, without the training that I received from Dr. Jade Savage, Dr. Dale Wood and Dr. Mihai Scarlete during my undergraduate studies; I would not have even dreamt of pursuing my graduate studies. I am thankful for the training that I received.
Finally, I would like to thank the Natural Sciences and Engineering Research Council of Canada (NSERC), the Centre Québécois des Matériaux Fonctionnels (CQMF), the Fonds de recherche du Québec-Nature et technologies (FRQNT), and the Centre d’Études des Matériaux Optiques et Photoniques de l’Université de Sherbrooke (CEMOPUS) and Université de Sherbrooke for their financial support.
ix LIST OF PUBLICATIONS IN THE THESIS
Frank Juvenal, Adam Langlois, Antoine Bonnot, Daniel Fortin, and Pierre D. Harvey. “Luminescent 1D- and 2D-Coordination Polymers using CuX Salts (X = Cl, Br, I) and a Metal-containing Dithioether Ligand.” Inorg. Chem. 2016, 55, 11096-11109.
DOI: 10.1021/acs.inorgchem.6b01703
Frank Juvenal, Antoine Bonnot, Daniel Fortin, and Pierre D. Harvey. “Unexpected Formation of Luminescent Heterobimetallic Organometallic/Coordination Polymer with CuCN and Metallic Containing Ligand” 2017, Manuscript under preparation.
Frank Juvenal, Antoine Bonnot, Daniel Fortin, and Pierre D. Harvey. “The trans-Bis(p-thioetherphenylacetynyl)bis(phosphine)platinum(II) Ligands, a Step Towards Predictability and Crystal Design.” 2017, Manuscript under preparation.
LIST OF PUBLICATIONS NOT INCLUDED IN THE THESIS
Antoine Bonnot, Frank Juvenal, Antony Lapprand, Daniel Fortin, Michael Knorr, and Pierre D. Harvey, “Can Highly Flexible Copper(I) Cluster-containing 1D and 2D Coordination Polymers Exhibit MOF-like Properties?” Dalton Trans. 2016, 45, 11413-11421.
DOI: 10.1039/C6DT01375A
Antoine Bonnot, Paul-Ludovic Karsenti, Frank Juvenal, Christopher Golz, Carsten Strohmann, Daniel Fortin, Michael Knorr, and Pierre D. Harvey. "The 3D [(Cu2Br2){μ-EtS(CH2)4 SEt}]n
material: a rare example of a coordination polymer exhibiting triplet–triplet annihilation." Physical
Chemistry Chemical Physics. 2016, 18, 24845-24849.
x
TABLE OF CONTENTS
SOMMAIRE ... iv
SUMMARY ... vi
ACKNOWLEDGEMENTS ... viii
LIST OF PUBLICATIONS IN THE THESIS ... ix
TABLE OF CONTENTS... x
LIST OF SYMBOLS AND ABBREVIATIONS ... xiii
LIST OF X-RAY STRUCTURES PRESENTED IN THIS THESIS ... xiv
LIST OF FIGURES ... xv
LIST OF TABLES ... xix
INTRODUCTION ... 1
I.1.General background on coordination polymers ... 1
I.2. Porous Coordination Polymers (PCPs) / Materials ... 2
I.2.1. General overview ... 2
I.2.2. MOFs (Metal Organic Frameworks) ... 4
I.2.3. Applications of MOFs ... 7
I.3. Coordination Polymers based on CuX (X = Br, Cl, I, CN) salts ... 12
I.3.1. Overview of copper cluster complexes ... 13
I.3.2. Monothioether or dithioether ligands ... 13
I.4. OBJECTIVE OF THE THESIS ... 21
CHAPTER 1 ... 22
Theory ... 22
1.1. Gas sorption measurement (adsorption and desorption) ... 22
1.1.1. Overview of gas adsorption... 22
1.1.2. The general concept of adsorption isotherms ... 22
1.2. X-ray diffraction (XRD) ... 30
1.2.1. General overview ... 30
1.2.2. Single crystal X-ray diffraction (SCXRD) ... 32
1.2.3. Powder X-ray diffraction (PXRD)... 33
1.2.4. Elemental analysis ... 34
1.2.5. Thermogravimetric analysis (TGA) ... 34
1.3. Photophysical properties ... 36
xi
1.3.2. Fluorescence and Phosphorescence ... 38
1.3.3. Non-radiative processes ... 39
1.3.4. Emission Lifetime ... 40
1.3.5. Quantum yield ... 41
1.3.6. Density functional theory (DFT) and time dependent density functional theory (TD-DFT) calculations ... 43
CHAPTER 2 ... 44
Luminescent 1D- and 2D-Coordination Polymers using CuX Salts (X = Cl, Br, I) and a Metal-containing Dithioether Ligand ... 44
2.1. Project overview ... 44
2.2. Manuscript published in Inorg. Chem. 2016, 55, 11096-11109. ... 45
2.2.1. Abstract ... 45
2.2.2. Introduction ... 46
2.2.3. Experimental section ... 48
2.2.4. Results and Discussion ... 51
2.2.5. Conclusion ... 69
2.2.6. References ... 70
2.2.7. Supporting Information ... 77
CHAPTER 3 ... 118
Unexpected Formation of Luminescent Heterobimetallic Organometallic/Coordination Polymer with CuCN and Metallic Containing Ligand ... 118
3.1. Project overview ... 118
3.2. Manuscript in preparation;... 119
3.2.1. Abstract. ... 119
3.2.2. Introduction ... 119
3.2.3. Experimental Section ... 120
3.2.4. Results and Discussion ... 122
3.2.5. Conclusion ... 130
3.2.7. Supporting Information ... 137
CHAPTER 4 ... 143
The trans-Bis(p-thioetherphenylacetynyl)bis(phosphine)platinum(II) Ligands, a Step Towards Predictibility and Crystal Design ... 143
4.1. Project overview ... 143
xii
4.2.1. Abstract ... 144
4.2.2. Introduction ... 145
4.2.3. Experimental section ... 146
4.2.4. Results and Discussion ... 149
4.2.5. Conclusion ... 160
4.2.6. References ... 161
4.2.7. Supporting Information ... 169
CHAPTER 5 ... 184
DISCUSSION ... 184
5.1. CPs obtained with their dimentionality using X-ray crystallography ... 184
5.1.1. Overview ... 184
5.1.2. General protocol for obtaining CPs. ... 184
5.1.3. Effect of halides: X= I, Br, Cl, CN and the solvents used ... 185
5.1.4. Predictability based on the ligands ... 186
5.1.5. MOF formation? ... 186
5.2. Vapochromism and gas sorption measurements ... 187
5.2.1. Monitoring presence/ absence of solvent ... 187
5.2.1. Potential applications of the CPs ... 188
5.3. Future work ... 189
5.3.1. Modification of Pt-containing ligand ... 189
5.3.2. Exploring other metal salts. ... 190
CONCLUSION ... 191
xiii
LIST OF SYMBOLS AND ABBREVIATIONS
α: Alpha UV-Vis: Ultraviolet/Visible light
Ǻ: Angstrom, 10-10 m nm: nanometer, 10-9 m
beta NMR: Nuclear Magnetic Resonance
γ: gamma %: Percentage
λ: wavelength, lambda TMS: Trimethylsilyl
: chemical shift; ppm DFT: Density Functional Theory
χ2: chi-square TDDFT: Time Dependent Density Functional Theory
mg: milligram MLCT: Metal–to - Ligand Charge Transfer
g: gram BET: Brunauer-Emmett-Teller
cm-1 inverse centimetre TGA: ThermoGravimetric Analysis
cm3: cubic centimeter LMCT: ligand-to-metal Charge Transfer
mL: milliliter HOMO: Highest Occupied Molecular Orbital
MHz: mega-hertz LUMO: Lowest Occupied Molecular Orbital
MeCN: acetonitrile HSOMO: Highest Singlet Occupied Molecular Orbital PrCN: butyronitrile LSOMO: Lowest Singlet Occupied Molecular Orbital
PhCN: benzonitrile Calcd: calculated
MeOH: methanol mmol: millimol
CDCl3: deuterated chloroform XRD: X-ray Diffraction
CH2Cl2: methylene chloride PXRD: Powder X-ray Diffraction
H2O: water MO: Molecular Orbital
CP: Coordination Polymer B3LYP: Becke, three-parameter, Lee-Yang-Parr
MOFs: Metal Organic Frameworks ORTEP: Oak Ridge Thermal Ellipsoid Presentation
COFs: Covalent Organic Frameworks ZIFs: Zeolitic Imidazolate Frameworks
IC: Internal Conversion ISC: Intersystem Crossing
mbar: millibar TRES: Time Resolved Emission Spectra
IR: infrared SBU: Secondary Building unit
CO2: carbon dioxide SI: Supporting Information
N2: nitrogen PCP: Porous Coordination Polymer
°C: degree Celsius MeTHF: Methyl Tetrahydrofuran
xiv
LIST OF X-RAY STRUCTURES PRESENTED IN THIS THESIS
Chapter
Ligands used
CPs
2
trans-[p-MeSC6H4C≡C-Pt(PMe3)2-C≡CC6H4SMe](L1) 2D {[Cu4I4L1]•PrCN]}n (CP1) 1D{[Cu2I2L1]•PhCN]}n (CP2) 1D {[Cu2Cl2L1]•PrCN]}n (CP3) 1D {[Cu2Cl2L1]•PhCN]}n (CP4) 2D {[Cu2Br2L1]}n (CP5) 2D {[Cu2Br2L1]}n (CP5’)
3
trans-[p-MeSC6H4C≡C-Pt(PMe3)2-C≡CC6H4SMe](L1) 1D {(C15H25P2PtS[Cu(CN)2]}n (CP1)
4
trans-[p-MeSC6H4C≡C-Pt(PMe3)2-C≡CC6H4SMe]
(L1)
trans-[p-MeSC6H4C≡C-Pt(PEt3)2-C≡CC6H4SMe]
(L2) 2D {[Cu4I4L1]•MeCN]}n (CP1) 1D{[Cu2I2L2]]}n (CP2) 1D {[Cu2Br2L1]•MeCN]}n (CP3) 1D {[Cu2Br2L2]]}n (CP4) 1D {[Cu2Cl2L1]•MeCN]}n (CP5) 1D {[Cu2Cl2L2]}n (CP6)
xv
LIST OF FIGURES
Figure 1. Illustration of 1-, 2-, and 3-dimensional coordination polymers. ...1 Figure 2. Two examples of most used porous materials. Left: artificial and right: natural ...2 Figure 3. Representation scheme for the classification of the PCPs with respect of the
adsorption-desorption behaviour of guest molecules. (Modified from Ref. 11) ...3
Figure 4. An example of 1,4-benzenedicarboxylic acid ligand which is used to make MOF-5. ...5 Figure 5. The porous coordination polymer [Zn4O(bdc)3] (bdc = benzene-1,4-dicarboxylate;
MOF-5 or IRMOF-1. left: Representation of 2D showing the voids. Right: view of a 3D representation of the MOF in a perspective view showing the voids. Note: The cif file was obtained from ref. 17 and the image was generated using the Vesta software. ...5
Figure 6. Illustration of single-crystal to single-crystal transformation upon solvent removal. The
DMF solvent does not seem to go back in the cavity upon removal. Calix [4] arene are shown in dark brown polyhedral. Colour codes: O= red, C= black, N= sky blue, Pb= purple. Note: The cif file was obtained from ref. 18 and the images were generated using the Vesta software. ....6
Figure 7. CO2 adsorption pattern showing hysteresis loop at 273 K for calix[4]arene-based MOF.
(Modified from ref. 18) ...6
Figure 8. Illustration of how MOF can be useful in storage of methane, hydrogen, carbon monoxide
and carbon dioxide gases. (Modified from ref. 20). ...7
Figure 9. a) Representation of Cu(Fumarate)(4,4’-trans-bis-(4-pyridyl) ethylene). Colour codes:
Cu= blue, C= black, O= red, N= sky blue. The hydrogen atoms are omitted for clarity. b) View of a 3D perspective of the MOF without water molecules in the cavities. (c) Gas sorption isotherms of [Cu(Fumarate)(4,4’-trans-bis-(4-pyridyl) ethylene))0.50•5H2O] at 195 K.
(Modified from ref. 24) CO2= red; CH4= pink; N2= blue. Note: The cif file was obtained from
ref. 24 and the images a and b were generated using the Vesta software. ...8
Figure 10. a) Crystal structure of [(HOC2H4)2dtoaCu]. The HOC2H4− group has been omitted for
clarity. b) Overview of [(HOC2H4)2dtoaCu] with colour codes for each atom. Dtoa=
dithiooxamidato. (Modified from ref. 27). ...9
Figure 11. An illustration of [(HOC2H4)2dtoaCu] MOF showing electrocatalyst for ethanol
oxidation. (Modified from ref. 27). ...9
Figure 12. a) Illustration of a 3D MOF with guest molecules incorporated in the channels. b) View
of 3D MOF after guest molecules removed. c) Photographs showing the luminescence responses of the MOF sensor after immersing in EtOH solvent under UV lamp (365nm).(d) Emission spectra of MOF with or without solvent molecule. H atoms are omitted for clarity.
xvi
Colour codes: Cu = brown, N = sky blue, O= red, C = gray. (Modified from ref. 29). Note: the cif file was obtained from ref. 29 and the image was generated using the Vesta software. ... 11
Figure 13. (a) Illustration for high diffusion of oxygen gas in the {[Zn4(μ4-O)
(methyl-3-(2-pyridyl)benzoate)2] •6DMF•H2O} CP after guest molecules removal (DMF and H2O). Colour
codes: N= sky blue, Ir= Pink, O= red, Zn= brown, C= black. (b) Graph showing reversible phosphorescence quenching of CP upon exposure to 0.1 atm of O2 after vacuum. (Modified
from 30) Note: The cif file was obtained from ref. 30 and the image was generated using the Vesta software. ... 12
Figure 14. Some examples of clusters (CuX)n (X= Br, Cl, I) encountered in CP networks. ... 13
Figure 15. Structures of some mono- and dithioether ligands. ... 13 Figure 16. X-ray structure of the 1D (((Cu4I4) (L1)2(MeCN)2)n and a 3D ((Cu4I4)(L1)2•MeOH)n
CPs. (Cu= brown; S=yellow, I= mangeta, O=red, N=sky blue, C= black). The solvent molecules are circled and hydrogen atoms are omitted for clarity. Note: the cif files were obtained from ref. 34 and the image was generated using the Vesta software. ... 14
Figure 17. X-ray structure of a 3D ([Cu6I5(L2)3] (BF4)•H2O)n. The Cu-Cu distanges are in a range
from 3.674 to 3.754 Å. Colour code: (Cu = blue, S = yellow, I = mangeta, O = red, N = sky blue, C = black, B = green, F = orange. The guest molecules are included in the structure and hydrogen atoms are omitted for clarity. Note: the cif file was obtained from ref. 35 and the image was generated using the Vesta software. ... 15
Figure 18. X-ray structure of the 3D CP [(Cu3I3)(L3)(MeCN)(CH2Cl2)(2H2O)]n with Cu-Cu
distances of 2.62 and 3.17Å. Colour code Cu = blue, S = yellow, I = mangeta, O = red, N = sky blue, C = black. The solvent molecules are not shown and hydrogen atoms are omitted for clarity Note: the cif file was obtained from ref. 36 and the image was generated using the Vesta software. ... 16
Figure 19. X-ray structure of the 2D CP. Left: [(Cu2Cl2)(L4)2•MeCN]n with (Cu-Cu = 2.98 Å) and
right: [(Cu2I2)(L4)2•THF]n (Cu-Cu distance = 3.18 Å). Colour code: Cu = blue, S = yellow, Cl
= green, I = mangeta, O = red, N = sky blue, C = black. The solvent molecules are circled in red and hydrogen atoms are omitted for clarity. Note: The cif files were obtained from ref. 37 and 38 and the images were generated using the Vesta software. ... 17
Figure 20. Structures of some mono- and dithioether ligands. ... 17 Figure 21. X-ray structure of 3D [(Cu6I6) (L5)3]n. Colour code: C = black, S = yellow, Cu = brown,
I = magenta. The hydrogen atoms are omitted for clarity. Note: The cif file was obtained from ref. 39 and the image was generated using the Vesta software. ... 18
xvii Figure 22. X-ray structure of the 3D framework [(Cu4I4) (L6)1.5]n. The Cu-Cu distances within the
Cu4I4 cluster are 2.72(1) and 2.893 (4) Å. Colour code: C = black, S = yellow, Cu = brown, I =
magenta. The hydrogen atoms are omitted for clarity. Note: the cif file was obtained from ref. 41 and the image was generated using the Vesta software. ... 18
Figure 23. X-ray structure of the 3D framework of [(Cu4I4)(L7)]n. The Cu-Cu distances within the
cubane Cu4I4 cluster range between 2.72(1) and 2.89 (4) Å. Colour code: C = black, S = yellow,
Cu = blue, O= red, I = purple. The hydrogen atoms are omitted for clarity. Modified from ref. 42. Note: the cif file was obtained and the image was generated using the Vesta software. .... 19
Figure 24. X-ray structure in perspective view of a 2 D layer of {[Cu(CN)]3(L8)} with Cu-N
distances of 2.62 Å. The hydrogen atoms are omitted for clarity. Note: The cif file was obtained from ref. 43 and the image was generated using the Vesta software. ... 20
Figure 25. Top: some of the common formed clusters from copper halide salts. Below: Two
Pt-containing ligands (L1 and L2) ... 21
Figure 26. Top: Schematics of adsorption and desorption processes. Bottom: Illustration of
adsorption of gas molecules towards the porous solid sample... 23
Figure 27. Classification of physisorption isotherms. Six standard adsorption isotherms based on
IUPAC nomenclature (Modified from ref. 47 and 48). ... 24
Figure 28. Schematic representation of physisorption measurement with ASAP 2020 analyzer ... 26 Figure 29. Illustration of BET plot. ... 27 Figure 30. Left: CO2 gas sorption measurement at 273 K showing adsorption (closed shapes and
deorption (open shapes). Right: X-ray structure of 3D MOF. Colour code: C = black, N = sky-blue, Zn = green, O= red, H = white. Modified from ref. 67. Note: the cif file was obtained and the image was generated using the Vesta software. ... 29
Figure 31. Cumulative surface area as a function of pore width calculated from adsorption isotherm
data of CO2 at 273 K using the Density Functional Theory (DFT) model. (Modified from ref.
67 and plotted using origin software). ... 30
Figure 32. Cumulative pore volume versus pore width calculated from the adsorption isotherm data
of CO2 at 273 K using the Density Functional Theory (DFT) model. (Modified from ref. 67 and
plotted using origin software). ... 30
Figure 33. General illustration for X-ray diffraction measurements. ... 31 Figure 34. Incident beam (X-ray 1 and X-ray 2) showing the relationship between angle and the
distance (d) obtained from diffracted rays which illustrate the derivation of Bragg’s law. ... 32
Figure 35. Scheme of 4-Circle Single-Crystal X-ray Diffraction goniometer. (Modified from ref.
xviii Figure 36. Left: Example of a PXRD pattern of the CP on the right-hand side (black line = calculated
and red line = measured). Right: View of crystalline unit cell of CP along b axis. Colour codes:
Cu = brown, S = yellow, Br = green, C = grey and H = white. (Modified from ref. 73). ... 33
Figure 37. Scheme for CHN elemental analysis instrument. ... 34
Figure 38. A layout of thermogravimetric analyzer. ... 35
Figure 39. The Jablonski diagram describing the various electronic levels and processes. ... 37
Figure 40. Illustration of the absorption, fluorescence and phosphorescence spectra. (Modified from ref. 75). ... 38
Figure 41. An example of exponetial decay (blue), instrument response function [IRF] (red) and the fit of the decay (black). ... 41
Figure 42. The general scheme for obtaining the reported CPs. ... 184
Figure 43. Observed copper clusters in the project. ... 185
Figure 44. (a) 1D CP formed when L1 is reacted with CuCl in MeCN as solvent, the MeCN is circled. (b) 1D CP when L2 is reacted with CuCl with MeCN as solvent. Colour codes: Cu = brown, Cl = green, Pt = silver, N = sky blue, S = yellow, P = orange, C = black. Hydrogen atoms are hidden for clarity... 186
Figure 45. Top: Schematic representation showing the reversibility vapochromic behaviour upon solvent removal and exposure to solvent vapour. Bottom-left: TGA traces focussing in the temperature range where the solvent loss occurs in a 2D CP (MeCN) as synthesized showing solvent loss. Black: single crystals used. Red: TGA curve after the solvent removal under reduced pressure (600 mbar) and slight heat at 60 oC. Bottom-right: CO 2 sorption measurement for a 2D CP at 273 K. Closed cirles: adsorption and open circles= desorption. ... 188
Figure 46. Proposed ligands for future works. ... 189
xix
LIST OF TABLES
Table 1. Gases with their kinetic diameters ... 8 Table 2. Number of publications reporting CPs and MOFs (Sci-Finder Database Search; August 20th
August, 2016).44 ... 20
Table 3. Classification of pores for microporous materials based on pore width. ... 22 Table 4. The X-ray structures obtained in this project... 185
1
INTRODUCTION
I.1.General background on coordination polymers
In recent years, coordination polymers have become a hot topic. The increasing interest is not only due to their amazing as well as captivating molecular structure but also due to their potential applications including gas storage,1 luminescence,2 sensors,3 gas separations4 and catalysis.5
Despite the long history of coordination chemistry; the term coordination polymer was first used by Shibata in 1916.6However, the field was first reviewed in 1964 by Bailar.7
A coordination polymer (CP) is defined as a compound that contain a coordination entity which can be formed by organic ligand or inorganic building blocks connected through different types of bonds to form infinite one-, two- and three-dimensional structures (Figure 1).8 These structures
can be obtained by metal-ligand coordination bonding. The structures of the materials can be dictated by either the symmetry of the ligand or the coordination number with the geometry of the linking metals (metal ions). These CPs might be synthesized using a solvent, organic or organic-inorganic linkers, and a metal ions or clusters.
2
On another hand, some CPs can also be synthesized in the absence of solvent by mechanochemical method whereby grinding is involved and the polymers obtained are usually non-porous. Therefore, the CPs can further be divided into two categories including porous and non-porous.
I.2. Porous Coordination Polymers (PCPs) / Materials
I.2.1. General overview
Porous materials are very important in our daily lives. The most commonly used porous material for example include a sponge which is now used for cleaning dishes in almost every household today as well as soil which is also essential for agricultural purposes (Figure 2).
Figure 2. Two examples of most used porous materials. Left: artificial and right: natural
Therefore, artificial porous materials play such an important role as mentioned above. Before 1989, porous materials (generally known as microporous materials / polymers) generally consisted of zeolites, alumina, graphite and silica.9 Zeolites for instance became vital as they were porous upon
removal of water molecules leading to more potential applications such as commercial adsorbents and catalysts.9 Hoskins and co-workers were the first to publish on porous coordination polymers
(PCPs), which is believed to be the set basis for the future of microporous coordination polymers.10
They synthesized the porous coordination polymer using a rigid ligand with copper cation by slow evaporation of the solvent from the mixture containing all the starting materials, which yielded infinite network.
Interestingly, when coordination polymers are synthesized using solvent, some extended networks are formed without the guest (solvent or small molecules) molecule in their cavity while others are formed with the crystallization guest present in their cavities. The guest molecules can be removed through vacuum and or slightly heating and thus leaving free spaces (voids) which is a characteristic of porosity for those CPs with some rigid ligands. In addition; the voids can later be replaced with another different solvent or another guest molecule including small molecules such as gases. On the other hand, when the ligands are not rigid enough, the CPs may shrink or collapse (Figure 3).
3 Figure 3. Representation scheme for the classification of the PCPs with respect of the
adsorption-desorption behaviour of guest molecules. (Modified from Ref. 11)
Kitagawa and co-workers classified microporous coordination polymers in three different categories including 1st, 2nd, and 3rd generations.11
The 1st generation compounds: These materials are porous in nature, which means that they have microporous frameworks. However, the cavities of these PCPs are usually filled with guest molecules such as solvents and these cavities show an irreversibility behavior upon guest removal and reintroduction of the guest molecules. When the guest molecules are removed, the framework usually collapses (Figure 3). Thus, they are not considered to be very proper porous materials after guest removal.
The 2nd generation compounds: The PCPs of this category have very robust and stable porous frameworks such that when the guest molecule is removed, the frameworks do not collapse. These PCPs will have voids (or cavities or permanent pores) upon guest removal.
The 3rd generation compounds: These have flexible frameworks and may either respond to
different external stimuli including guest molecules, light, and change of pore shapes and sizes upon solvent removal (Figure 3).
4
The 3rd generation compounds are also subdivided into three sub-categories including:
Guest-induced crystal-to-amorphous transformation: these types of compounds are encountered when the framework collapses upon guest removal indicating the presence of close-packing forces. However, under initial conditions, it forms back to the original structure (Figure 3).
Guest-induced crystal-to-crystal transformation: removal or exchange of different guest molecules results in a structural change of the network. However, the crystallinity is maintained. This robust framework is very useful as they can also act as sensors of small molecules.
Guest-induced crystal-to-crystal reformation: upon guest removal, the framework may shrink thus changing the structure. This implies that the ligands that make up this type of frameworks are flexible and not very rigid. However, the framework is obtained back after the reintroduction of the guest molecules.
Over the past decade, some porous coordination polymers were divided in different types including Metal Organic Frameworks (MOFs), Covalent Organic Frameworks (COFs) as well as Zeolitic Imidazolate Frameworks (ZIFs). For simplification purposes and in relevance with this thesis, only MOFs will be discussed further.
I.2.2. MOFs (Metal Organic Frameworks)
A ‘MOF’ may be defined as a rigid porous polymer with the ability to adsorb small molecules and the structure is usually made up of organic linker and metal atoms including zinc, copper as well as magnesium. These porous crystalline compounds form generally three dimensional structures with the use of metal ions and they usually consist of a metal ion and an organic molecule, often called ligand. However, 2D and 1D CPs can also act as pseudo MOFs as they may absorb small molecules reversibly.
The term ‘MOF’ became very popular in 1995 when Yaghi and co-workers reported different MOFs with their potential application.12,13 A well-known example of porous material is MOF-5,
also known as IROMOF-1 (Iso-Reticular Metal Organic Framework-1) reported by Yaghi’s research group and this is composed of Zn4O-based IRMOF with 1,4-benzenedicarboxylic acid
5
later modified MOF-5 by substituting 1,4-benzenedicarboxylic acid with many other dicarboxylic acids in order to obtain several other IROMOFs which also had similar frameworks to that of the skeleton of MOF-5. The 3D type of MOFs have pore sizes in the mesoporous range ((i.e: > 20 Å (> 2 nm)) as well as very low crystal density.16
Figure 4. An example of 1,4-benzenedicarboxylic acid ligand which is used to make MOF-5.
Figure 5. The porous coordination polymer [Zn4O(bdc)3] (bdc = benzene-1,4-dicarboxylate;
MOF-5 or IRMOF-1. left: Representation of 2D showing the voids. Right: view of a 3D representation of the MOF in a perspective view showing the voids. Note: The cif file was obtained from ref. 17 and the image was generated using the Vesta software.
Although most of the synthesized MOFs are mainly composed of zinc metal atoms, a MOF can also be obtained by using other metal ions including copper, lead as well as cobalt as reported in the literature.18-19,24 Ki-Min Park and co-authors reported a very uncommon three dimensional (3D)
calix[4]arene-based MOF containing lead (Pb) showing a shrunken 3D framework after removal of the guest solvent (DMF) (Figures 6 and 7).18 In addition, the CO
2 adsorption was also
investigated and this showed a linear adsorption and non-linear desorption indicating that the 3D calix[4]arene-based MOF is not very porous if compared with those with very rigid framework.
6 Figure 6.Illustration of single-crystal to single-crystal transformation upon solvent removal. The
DMF solvent does not seem to go back in the cavity upon removal. Calix [4] arene are shown in dark brown polyhedral. Colour codes: O= red, C= black, N= sky blue, Pb= purple. Note: The cif file was obtained from ref. 18 and the images were generated using the Vesta software.
Figure 7. CO2 adsorption pattern showing hysteresis loop at 273 K for calix[4]arene-based MOF.
7
I.2.3. Applications of MOFs
I.2.3.1. General overview
MOFs have several potential applications which have been explored in the past decades. A few applications including gas storage, catalysis and sensing will be discussed in the following section.
I.2.3.2. Gas storage
The continuous threat of global warming has recently put many researchers to focus their interest towards the search of clean energy which can be used in vehicles in order to reduce carbon dioxide emission (Figure 8). The focus has been to find an effective way to store a large amount of gas including hydrogen, methane as well as to capture carbon dioxide, which may reduce their emission in the atmosphere. This issue can be addressed by the use of the highly porous materials to trap these gases. Zhou and coworkers constructed different MOFs in 2010 and the authors focused on the concept of creating clean energy, which might be used as either fuel or for gas capture / storage.20
Figure 8. Illustration of how MOF can be useful in storage of methane, hydrogen, carbon
monoxide and carbon dioxide gases. (Modified from ref. 20).
One of the emerging class of porous materials is MOF which proved to have a very high surface area as compared to other porous materials which have proved to be very effective in storing a large amount of gas within a given small area container. The huge surface area in these porous materials can be well above 5000 m2g-1.21-23 In addition, the group of Zhou and collaborators also
illustrated the gas storage capacity of copper containing MOF which shows the selective adsorption of different gases at the same temperature in the year 2007 (Figure 9).24
8 Figure 9. a) Representation ofCu(Fumarate)(4,4’-trans-bis-(4-pyridyl) ethylene). Colour codes: Cu= blue, C= black, O= red, N= sky blue. The hydrogen atoms are omitted for clarity. b) View of a 3D perspective of the MOF without water molecules in the cavities. (c) Gas sorption isotherms of [Cu(Fumarate)(4,4’-trans-bis-(4-pyridyl) ethylene))0.50•5H2O] at 195 K. (Modified from ref. 24)
CO2= red; CH4= pink; N2= blue. Note: The cif file was obtained from ref. 24 and the images a and
b were generated using the Vesta software.
Nevertheless, different gases are adsorbed depending on different parameters which include temperature, pressure as well as the kinetic diameters of the gas, which is very important when considering the highest gas adsorptivity.25 Kinetic diameters is defined as a measure applied to a
molecule, which expresses the possibility of collision of that molecule in a gas phase with another identical molecule. Table 1 illustrates some of the kinetic diameters of some gases. The kinetic diameters can be noted as the sizes of gases which were reported by Mehio and coworkers.25 These
kinetic diameters of gases have a tremendous effect on the absorptivity into porous materials as those porous materials with small pores will only allow the gases with small kinetic diameters diffuse in and out of the cavity.
Table 1. Gases with their kinetic diameters
Gas Kinetic diameter (Å)
H2 2.89
CO2 3.30
N2 3.64
CO 3.76
9 I.2.3.3. Catalyst
MOFs with a potential to act as catalysts should possess big pores sizes or cavities ranging between 3 to 35 Å and they should also have some relatively big surface areas in the range of 500–6500 m2 g−1.26 In addition, the ligand should be very rigid so that after the solvent is removed, the
framework does not collapse.
Koyama and collaborators reported a very good example of a MOF which acts as an electrocatalyst for the ethanol oxidation (Figures 10 and 11).27 The synthesized MOF was composed of copper
and a ligand as illustrated in Figure 10. The one hydrogen atom of the ethanol was thought to have coordinated with the copper atom while the H atom on the OH group of ethanol is suggested to interact through hydrogen bonding with the O and N atoms of [(HOC2H4)2dtoaCu].
Figure 10. a) Crystal structure of [(HOC2H4)2dtoaCu]. The HOC2H4− group has been omitted for
clarity. b) Overview of [(HOC2H4)2dtoaCu] with colour codes for each atom. Dtoa=
dithiooxamidato. (Modified from ref. 27).
Figure 11. An illustration of [(HOC2H4)2dtoaCu] MOF showing electrocatalyst for ethanol
10
In addition, other research groups including the group of Zhu and his co-workers also reported an iron-containing coordination polymer, which was applied as a calatyst for the oxidation of benzyl alcohol into an aldehyde.28
I.2.3.4. MOF sensors
By definition, a sensor is a device which can be used to detect a signal by either receiving or transmitting a signal. In this category, there are several ways on how MOFs can act as sensors. However, only solvatochromism / vapochromism and gas-based sensing will be discussed. When selecting MOFs for sensing applications, there are several factors to consider as discussed below.
Sensitivity: the selection of MOF sensors is very critical as one should make sure that they are
sensitive to either gas or vapour detection. The MOF should be able either to sense gases or solvent vapor/molecules. Sensitivity may be triggered by host-guest interactions that may provoke a change to a given property (i.e: optical, electrochemical properties).
Selectivity: since different MOFs have different pore sizes, the analyte (guest molecule) should
be small enough to be absorbed through the pores. For instance, kinetic diameters of different gases will play a role in the adsorption of the gases depending on the pores.
Stability: the MOF should be stable when removing the solvent molecules as high vacuum will be
applied to remove the guest. The structural stability of the MOF is essential to prevent the framework from collapsing.
Response time: this is dependent on the sorption kinetics and this facilitates easy removal of the
guest molecules by either a vacuum alone or with slight heating.
I.2.3.4.1 Solvatochromism / vapochromism
Vapochromism as the name suggests is the ability for the MOF to respond to the external environmental conditions such as contact to vapour of different solvents. Porous metal organic frameworks have attracted a large attention in the research field of material science. The most used MOFs for chemical sensing applications are those that are luminescent in nature, which preferably contain the solvent in their pores. Dan Li and co-workers synthesized a MOF using CuCN salt and 2,6-bis((3,5-dimethyl-1H-pyrazol-4-yl) methyl) pyridine ligand.29 This 3D MOF is luminescent
11
and exhibits some microporous channels (Figure 12). In addition, the MOF reversibly changes colour when exposed to different solvent molecules (Figure 12).
Figure 12. a) Illustration of a 3D MOF with guest molecules incorporated in the channels. b) View
of 3D MOF after guest molecules removed. c) Photographs showing the luminescence responses of the MOF sensor after immersing in EtOH solvent under UV lamp (365nm).(d) Emission spectra of MOF with or without solvent molecule. H atoms are omitted for clarity. Colour codes: Cu = brown, N = sky blue, O= red, C = gray. (Modified from ref. 29). Note: the cif file was obtained
from ref. 29 and the image was generated using the Vesta software.
I.2.3.4.2. Gas sensing
Over the past few decades, a few number of publications in the literature have surfaced where MOFs have been used to sense oxygen gas molecules.30 Xie and co-workers reported highly
phosphorescent MOFs, which are based on Ir[3-(2-pyridyl)benzoate]3 derivatives, and their
potential applications in oxygen sensing using luminescence quenching was investigated.30 The
phosphorescence of the CPs is quenched by oxygen and one of the CP showed reversible luminescence quenching by oxygen due to the high permanent porosity which allowed the facile diffusion of oxygen gas through the channels in the MOFs (Figure 13).
12 Figure 13. (a) Illustration for high diffusion of oxygen gas in the {[Zn4(μ4-O)
(methyl-3-(2-pyridyl)benzoate)2] •6DMF•H2O} CP after guest molecules removal (DMF and H2O). Colour
codes: N= sky blue, Ir= Pink, O= red, Zn= brown, C= black. (b) Graph showing reversible phosphorescence quenching of CP upon exposure to 0.1 atm of O2 after vacuum. (Modified from
30) Note: The cif file was obtained from ref. 30 and the image was generated using the Vesta software.
I.3. Coordination Polymers based on CuX (X = Br, Cl, I, CN) salts
The following section describes coordination polymers based on Cu(I) ions with halides and the pseudo-halide CN‾. However, these are not considered to be MOFs as they are not porous. However, some CPs exhibit cavities in their frameworks (1D or 2D) occupied by solvent crystallisation molecules, which collapse when the solvent is removed.
13 I.3.1. Overview of copper cluster complexes
Coordination polymers based on CuX salts have been the topic of long standing interest. The early investigations of their photophysics and photochemistry started to surface in 1973 from the works of Hardlt and coworkers who reported the emission thermochromism of pyridine copper iodides.31
This work was revisited later in 2006 by De Angelis and co-wokers who explored the absorption spectrum and the dual luminescence of tetranuclear cubane [Cu4I4(pyridine)4] cluster.32 The
properties of the clusters as well as their nature were studied using density functional theory (DFT) as well as time-dependent density functional theory (TDDFT).32 They concluded that the
high-energy emissive state was dominated by iodide-to-pyridine charge transfer (XLCT); while the low-energy band was assigned to originate from a cluster-centred (3d → 4s) excited state, possibly mixed with iodide-to-copper charge transfer (XMCT).32 For over a decade now, our group has
reported different CPs composed of copper-halides.33 Below are some of the clusters that can be
formed when CuX salts is used (Figure 14)
Figure 14. Some examples of clusters (CuX)n (X= Br, Cl, I) encountered in CP networks.
I.3.2. Monothioether or dithioether ligands
I.3.2.1. Presence of guest molecules in the cavity of CPs
14
Cho and co-workers reported an interesting series of CPs and MOFs in 2015 which were synthesized from one ligand. L1 reacts with CuI in either MeOH/MeCN mixture or MeCN to obtain a 3D CP of formula ((Cu4I4) L12•MeOH)n and a 1D CP of the formula
(((Cu4I4)L12(MeCN)2)n.34 The X-ray crystallography data reveal the presence of a MeOH
crystallization molecule in the cavity of the 3D CP. The cluster formed is a closed cubane Cu4I4
and is used as a Secondary Building Unit (SBU) which is either coordinated by two Cu-S or by two Cu-N bonds (Figure 16b). On the other hand, the 1D CP shows stair-step cubane Cu4I4 clusters
with two MeCN coordinated to two different copper atoms and two ligands (Figure 16a). The group also reported the vapochromism for the CPs. For instance, upon exposing 1D CP to MeOH, the 1D CP transforms into a 3D network and the 3D CP transforms back to 1D upon exposure to MeCN. The CPs were found to have luminescent properties but no emission lifetimes were recorded. In addition, gas adsorption measurements were not done as the crystals were transformed upon changing the external environment.
Figure 16. X-ray structure of the 1D (((Cu4I4) (L1)2(MeCN)2)n and a 3D ((Cu4I4)(L1)2•MeOH)n
CPs. (Cu= brown; S=yellow, I= mangeta, O=red, N=sky blue, C= black). The solvent molecules are circled and hydrogen atoms are omitted for clarity. Note: the cif files were obtained from ref. 34 and the image was generated using the Vesta software.
15
Peng and co-workers also reported a CP in 2005 with ligand L2 (1,4-bis(2-pyrimidinesulfanylmethyl)benzene) which has a thioether and a N-containing residue and both can coordinate to Cu(I). The 3D CP with a formula of ([Cu6I5(L2)3] (BF4)•H2O)n was obtained by
reacting L2 with CuI and [Cu(MeCN)4]BF4 in a ratio of 1:1:1 using MeCN as the solvent.35The
X-ray analysis reveals a 3D structure with organic sheets connected by L2 whereby Cu-N as well as Cu-S coordination bonds formed the network. The counter anion BF4‾ and H2O molecules are
found to be present in the voids of the 3D network (Figure 17). An emission spectrum exhibiting a maximum at 535 nm was also provided indicating that the CP is luminescent. No attempt was made to prove that this CP can be porous upon removal of the H2O guests’ molecules.
Figure 17. X-ray structure of a 3D ([Cu6I5(L2)3] (BF4)•H2O)n. The Cu-Cu distanges are in a range
from 3.674 to 3.754 Å. Colour code: (Cu = blue, S = yellow, I = mangeta, O = red, N = sky blue, C = black, B = green, F = orange. The guest molecules are included in the structure and hydrogen atoms are omitted for clarity. Note: the cif file was obtained from ref. 35 and the image was generated using the Vesta software.
16
Kim and co-workers also reported a 3D Cu(I) coordination polymer [Cu3I3(L3)] n. The CP was obtained by reacting the CuI salt with the ligand 1,4-bis((cyclohexylthio)acetyl)piperazine L3.36
The X-ray crystallography structure reveals the presence of a cluster with the formula of Cu3I3 and
the copper atom coordinates the sulfur atom. The network also can accomodate some guest molecules inside the cavities including MeCN, CH2Cl2 and 2H2O: [(Cu3I3)
(L3)(MeCN)(CH2Cl2)(2•H2O)]n (Figure 18). The resulting CP is luminescent and its emission
spectra were measured. However, no further study such as vapochromic behaviour was performed for this CP.
Figure 18. X-ray structure of the 3D CP [(Cu3I3)(L3)(MeCN)(CH2Cl2)(2H2O)]n with Cu-Cu
distances of 2.62 and 3.17Å. Colour codeCu = blue, S = yellow, I = mangeta, O = red, N = sky blue, C = black. The solvent molecules are not shown and hydrogen atoms are omitted for clarity Note: the cif file was obtained from ref. 36 and the image was generated using the Vesta software.
Munakata and co-workers reported the CP 2,11-dithia[3.3]paracyclophane, L4 with Cu(I) salts in 1996.37 The reaction of L4 with CuI in a MeCN/THF solvent mixture produces a 2D material of
composition [(Cu2I2)(L4)2•THF]n (Figure 19). The THF solvent molecule is seen to be present in
the large circle-like cavity of the 2D CP. Noteworthy, each Cu atom is coordinated to two S atoms. In addition, the group of Munakata reported in 2004 another interesting CP which they claimed to be porous.38 The reaction of L4 with CuCl in MeCN resulted in a porous 2D framework
[(Cu2Cl2)(L4)2·MeCN]n (Figure 19). The resulting 2D sheets formed incorporated the solvent
17
contains solvent molecules in the cavities like MOFs. Even though the authors claimed that the CP is porous, there was no further attempt to conduct experiments to prove the porosity after the solvent removal (i.e. BET measurements for example). In addition, no luminescence property study was performed. However, one cannot safely assume that these CPs were not luminescent.
Figure 19. X-ray structure of the 2D CP. Left: [(Cu2Cl2)(L4)2•MeCN]n with (Cu-Cu = 2.98 Å) and
right: [(Cu2I2)(L4)2•THF]n (Cu-Cu distance = 3.18 Å). Colour code: Cu = blue, S = yellow, Cl =
green, I = mangeta, O = red, N = sky blue, C = black. The solvent molecules are circled in red and hydrogen atoms are omitted for clarity. Note: The cif files were obtained from ref. 37 and 38 and the images were generated using the Vesta software.
I.3.1.2. Absence of guest molecules in the cavity of some CPs
Figure 20. Structures of some mono- and dithioether ligands.
Harvey’s group and collaborators have also reported a 3D network formed when 1,4-bis(phenylthio)but-2-yne ligand L5 (Figure 20) reacts with CuI in MeCN in a 2:1 ratio.39-40 The
crystals appear to be colorless in nature and the X-ray crystallography confirmed the presence of a 3D structure with a general formula of [(Cu6I6)(L5)3]n (Figure 21).39-40 The CP shows that there is a coordination bond between S-atoms with Cu-atoms which appear to form a hexagonal core. The luminescence properties of the CP were studied supported by DFT computations to further understand the nature of the cluster in the polymer. It is noteworthy to indicate that despite the network being 3D in nature, the porosity of this interesting CP was not reported.
18 Figure 21. X-ray structure of 3D [(Cu6I6) (L5)3]n. Colour code: C = black, S = yellow, Cu = brown,
I = magenta. The hydrogen atoms are omitted for clarity. Note: The cif file was obtained from ref. 39 and the image was generated using the Vesta software.
In 2009, Chen and collaborators reported a 3D network obtained from the reaction of ligand, 1,4-bis(benzylthio)butane, L6 with CuI in MeCN/CH2Cl2 solvent mixture with 1:1 ratio of the
mentioned solvents.41 The X-ray crystallography also reveals a 3D structure without any
crystallization solvent in the crystal (Figure 22). The photophysical properties were also reported and thus illustrating the CP is luminescent. The porosity of the CP was not reported by this group. As a result, one can not conclude whether the CPs formed from Cu(X) salts with flexible ligands are porous or not.41
Figure 22. X-ray structure of the 3D framework [(Cu4I4) (L6)1.5]n. The Cu-Cu distances within the
Cu4I4 cluster are 2.72(1) and 2.893 (4) Å. Colour code: C = black, S = yellow, Cu = brown, I =
magenta. The hydrogen atoms are omitted for clarity. Note: the cif file was obtained from ref. 41 and the image was generated using the Vesta software.
19
In addition, one of the flexible ligand L7 is also reported by Harvey’s group and collaborators indicating an interesting two sides of coordination on S- and O- atoms with copper.42 L7 reacts
with CuI in MeCN to form a 3D CP with a formula of ([Cu4I4(L7)])n as confirmed by X-ray
crystallography (Figure 23). The 3D CP is reported to be luminescent at both room temperature as well as at 77 K and the emission spectra were measured as well as lifetimes. No further measurements were conducted to confirm the porosity of the CP.
Figure 23. X-ray structure of the 3D framework of [(Cu4I4)(L7)]n. The Cu-Cu distances within the
cubane Cu4I4 cluster range between 2.72(1) and 2.89 (4) Å. Colour code: C = black, S = yellow,
Cu = blue, O= red, I = purple. The hydrogen atoms are omitted for clarity. Modified from ref. 42. Note: the cif file was obtained and the image was generated using the Vesta software.
I.3.1.3. Coordination polymers based on CuX (X= CN) salt
.
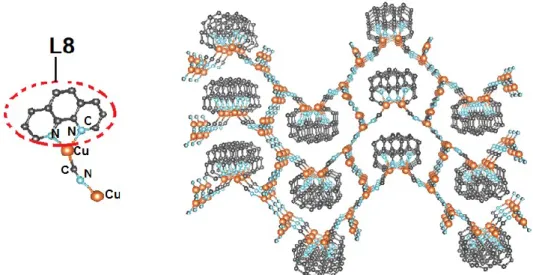
Su and collaborators reported the presence of a 2D sublayer inside a 3D CP composed of the CuCN chains which was constructed from the reaction of 1,10’-phenanthroline as a ligand, L8 and CuBr2•2H2O with K4Fe(CN)6•3H2O.43 The CP contains a 1D zigzag chain with a formula of
{[Cu(CN)]3(L8)} which is illustrated below (Figure 23). The luminescent properties of the CP
20 Figure 24. X-ray structure in perspective view of a 2 D layer of {[Cu(CN)]3(L8)} with Cu-N
distances of 2.62 Å. The hydrogen atoms are omitted for clarity. Note: The cif file was obtained from ref. 43 and the image was generated using the Vesta software.
The increasing interest in either coordination polymers or Metal Organic Frameworks by the scientific community is illustrated in Table 2 below.44 The term coordination polymer started to
appear in scientific literature in early 1950’s and now one can see a continuous increase in the use of this term since that year. On another hand, MOFs began to surface in the early 1990’s with only 8 publications in the 1991-2000 period. Despite this short history, it has recently become a popular field in the past five years where more than 4700 publications on MOFs appeared in the literature (Table 2).44
Table 2.Number of publications reporting CPs and MOFs (Sci-Finder Database Search; August 20th August, 2016).44
Years Coordination polymers Metal Organic Frameworks
< 1950 1 0 1951-1960 12 0 1961-1970 178 0 1971-1980 130 0 1981-1990 154 0 1991-2000 542 8 2001-2010 6564 1483 2011-2015 9153 4788
21
I.4. OBJECTIVE OF THE THESIS
The aim of the master thesis is to design luminescent CPs from copper(I) salts and Pt(II)-containing ligands for potential sensing applications using modulations in their luminescent behaviour upon vapour uptake of different solvents such as MeCN, MeOH, PrCN and PhCN. The platinum metal was chosen because platinum-containing polymers have recently shown the potential for applications in light emitting diodes83 and solar cells.84 Thus, showing the potential luminescent
of the CPs. In addition, flexible ligands have shown to have unstable framework upon removal of the guest molecules as discussed in the introduction, leading to collapsing of the framework. Therefore, platinum was used to increase the rigidity of the ligands to obtain rigid frameworks. These SBU’s and organometallic ligands are shown in Figure 25.
Figure 25. Top: some of the common formed clusters from copper halide salts. Below: Two
Pt-containing ligands (L1 and L2)
In order to achieve the main objective, the CPs were synthesized using CuX (X = Cl, Br, I or CN) and an organometallic thioether ligands in either MeCN, PrCN or PhCN. Then, their thermal stability and physical properties of the CPs were investigated. Lastly, the porosity (N2 gas
adsorption) of CPs as well as their vapochromic behaviour with small solvents such as MeCN, PrCN and MeOH were studied after the solvent removal for those CPs with solvent in their pores.
22
CHAPTER 1
Theory
1.1. Gas sorption measurement (adsorption and desorption)
1.1.1. Overview of gas adsorption
Considering that different porous materials are crystalline in nature, a number of factors can lead to the deviations from perfect crystalline structure. For instance, the resultant reduced pore volumes were discussed as being a result of partial collapse upon removing the guest molecule, and/or other activation related problems have become problematic. Therefore, to fully analyze whether the specific material is porous or not, the porosity measurement is performed.
Porous materials may have variations in their pores based on both size and shape. Therefore, the pore width as mentioned already has a very important role to play. It was not until the year of 1960 that Dubinin proposed a classification of porous materials based on their average pore width.45 The pore size classification was based on the effect that the adsorption shows in each
range. This classification was later adopted by the International Union of Pure and Applied Chemistry (IUPAC) (Table 3).46
Table 3. Classification of pores for microporous materials based on pore width. Pore type Pore width
Micropores < 20 Å (2 nm)
Mesopores 20 to 500 Å (2 to 50 nm) Macropores >500 Å (50 nm)
1.1.2. The general concept of adsorption isotherms
Adsorption isotherm is defined as the relationship between the pressure and adsorption amount at a constant temperature. The adsorption isotherm gives information on how much a solid material can adsorb either a gas or any other adsorptive molecule at a standard pressure (P) and
23
temperature (T). The amount of the molecules (gas) adsorbed can be used to calculate the surface area and the pore volume of the solid matererial.
Figure 26. Top: Schematics of adsorption and desorption processes. Bottom: Illustration of
adsorption of gas molecules towards the porous solid sample.
Gas adsorption is the most used method to evaluate the amount of particular molecules that a solid can uptake. These molecules are taken up in by a given adsorbent. It has been used for instance to find the quantity of either a particular gas or a solvent adsorbed by a given adsorbent material. The higher the uptake usually mean that the particular adsorbent has a good efficiency for storage (Figure 26). The total adsorption is most of the times refered as ‘sorption/ adsorption capacity’ and is usually investigated by the sorption (or adsorption) isotherm. The shape of adsorption isotherm provides enough information concerning the physical as well as the chemical properties of the particular solid material or adsorbent and how the adsorption proceeds. In principle, various types of isotherms can be depicted depending on the nature of the material and the kind of MOF-gas interactions that exist.
Based on the International Union of Pure and Applied Chemistry (IUPAC), six different types of isotherms are defined (Figure 27). The first five types (I to V) were originally proposed by
24
Brunauer, Deming, Deming and Teller, denoted as the BDDT classification.47 Later, type VI was
proposed by Sing and co-workers.48
Figure 27. Classification of physisorption isotherms. Six standard adsorption isotherms based
on IUPAC nomenclature (Modified from ref. 47 and 48).
Type I isotherm: This type of isotherm is obtained for microporous solids that have small external
surfaces which are observed for some MOFs,49 some zeolites 50 and activated carbons 51 also
known as activated charcoal. The disadvantage of this type of the pore volume is that some pores are often very small.
Type II isotherm: The type of isotherm is usually obtained from the materials that are nonporous
or that display macropores.52 The isotherm indicates the presence of monolayer adsorption when
the material has macropore. It also shows a rise on the isotherm (Figure 27), which is attributed to multilayer adsorption.
Type III isotherm: Such isotherms are not very common in the literature. However, the reported
ones are those of water vapor adsorption on nonporous carbons.53 The other known example is
that of nitrogen adsorption on polyethylene.54 The characteristic of this isotherm is that it does
not show any possibily of porosity (i.e: no feature of type I which is for microporous materials).
Type IV isotherm: This kind of isotherm is best known for its hysteresis loop, which is reported
for condensation of capillary in mesopores.55 By definition, a capillary condensation is when the
25
gas is sustained so that the desorption process is slow which lead to the condensation of a gas in the pores. However, the first segment of the graph is due to the monolayer and multilayer adsorption at high pressures as it shows the same shape as for Type II. This type of isotherm is associated with the mesoporous solids.
Type V isotherm: The type of isotherm is not very common. This is however known to be
obtained from a special kind of porous solids. An example of Type V isotherm is the adsorption of water vapour on charcoal at 1000 oC.56
Type VI isotherm: This type of isotherm is very interesting as it shows a kind of step by step
shape. This means that the adsorption of a gas occurs on each type of layer and thus mean that the layers are uniform. This is observed in isotherms for the adsorption of argon gas on carbon
57 and this can also be observed with nonporous solids.
1.1.2.1. Methods of gas adsorption measurement
There are several measurement methods of adsorption isotherm which include volumetric and gravimetric method. The following section will mainly focus on volumetric method which is commonly used to measure the surface area and porosity.
1.1.2.2. Volumetric gas adsorption isotherm measurement
Apparatus: Volumetric method apparatus consists of pressure sensors, valves, and vacuum
system as in the Figure 28. The valves are automated such that they open and close based on the initial parameter settings. The inner volume is calibrated before the measurement. The adsorption amount is calculated by subtracting the number of remaining molecules at the adsorption equilibrium from the number of introduced molecules by using the ideal gas equation. The volumetric method has the advantage over the gravimetric method only for sample pretreatment to achieve the high output measurement of surface area and porosity.
Measurements: Gas sorption isotherms in this masters’ thesis were measured at low-pressure ranging between 0 to 1100 mbar (~1.1 atm) using Micrometrics instrument ‘Accelerated Surface Area and Porosimetry’ (ASAP 2020) analyzer. For the isotherms, warm and cold free space correction measurements were performed using ultra-high purity He gas with 99.999 % of purity. All gases used are of high grade with purity of 99.999 % for N2 gas and the purity grade of 99.99 %
26
nitrogen) for N2 gas while for CO2 gas, the measurement was done at 273 K (using ice water).
Before performing the sorption measurements, the samples were heated under a vacuum or reduced pressure (600 mbar) at 110 oC for approximately 8 h and measured the mass. The
samples were then backfilled with N2 and transported to the analysis port where further
evacuation was done for 2 h before starting the whole analysis.
Figure 28. Schematic representation of physisorption measurement with ASAP 2020 analyzer 1.1.3. Surface area determination
The surface area, which is often reported as the specific surface area (SSA) of solids, is usually measured per unit mass and is usually presented in the units of m2g-1. There are several models
for calculating the specific surface area of porous materials. BET (see below) and Langmuir are the most common reported models in the literature for calculating surface area when nitrogen gas is used. These two models produce different values most of the times. One possible explanation for this is that the Langmuir model only considers physical adsorption in the form of a monolayer, whereas the BET model, takes data directly from the isotherm, which would therefore include any pores within a solid material. The BET model assumes that there is a formation of multilayers when high pressures are used. In this project, BET was chosen as it is used even for multilayer gas adsorption which is was available and often used at the university. In addition, one was not completely sure on the pores of the materials concerned.
1.1.3.1. Brunauer, Emmett and Teller (BET) Theory
The BET equation was first derived by Stephen Brunauer, P.H. Emmet and Edward Teller in the year 1938.58 It was developed based on the Langmuir theory which was used during the time.

![Figure 7. CO 2 adsorption pattern showing hysteresis loop at 273 K for calix[4]arene-based MOF](https://thumb-eu.123doks.com/thumbv2/123doknet/4953891.122269/25.892.106.817.114.535/figure-adsorption-pattern-showing-hysteresis-calix-arene-based.webp)

![Figure 11. An illustration of [(HOC 2 H 4 ) 2 dtoaCu] MOF showing electrocatalyst for ethanol oxidation](https://thumb-eu.123doks.com/thumbv2/123doknet/4953891.122269/28.892.215.701.831.1067/figure-illustration-hoc-dtoacu-showing-electrocatalyst-ethanol-oxidation.webp)