Université de Montréal
Méthodes optiques d’attribution d’identifiants moléculaires
à des cellules uniques pour assurer leur traçabilité
par Loïc Binan
Département de pharmacologie et physiologie Faculté de médecine
Thèse présentée
en vue de l’obtention du grade de Philosophiae doctor Doctorat en génie biomédical
Mai 2019
Université de Montréal
Département de pharmacologie et physiologie, Faculté de médecine
Cette thèse intitulée
Méthodes optiques d’attribution d’identifiants
moléculaires à des cellules uniques pour assurer leur
traçabilité
Présentée par Loïc Binan
A été évaluée par un jury composé des personnes suivantes Mathieu Dehaes Président-rapporteur Santiago Costantino Directeur de recherche Alexis Vallée-Belisle Membre du jury Daniel Coté Examinateur externe
iii
Résumé
Bien qu’apparues récemment, les technologies de séquençage de cellules uniques ont déjà largement illustré l’immense variabilité observable entre les cellules d’un tissu. Dès lors, nombre de techniques permettant de caractériser un échantillon biologique évoluent rapidement vers l’analyse individuelle de chaque cellule constituant l’échantillon. Cette variabilité est en effet porteuse d’informations déterminantes qui sont perdues lorsqu’une étude est réalisée en moyenne sur des millions de cellules. Or, si l’on exclut la microscopie, la majorité des protocoles applicables aux cellules uniques requiert une homogénéisation de l’échantillon en une suspension de cellules. Dès que la structure de l’échantillon est brisée, toute information concernant des éléments distinctifs facilement observables au microscope tels que la position, la forme, les contacts avec l’environnement, la direction et la vitesse de déplacement de la cellule étudiée est perdue. Ces éléments sont pourtant des descripteurs clefs du développement d’un embryon ou d’une pathologie, des réponses immunitaires, du fonctionnement du système nerveux, de la croissance et de la différenciation cellulaire.
L’objectif de ce travail est de développer une approche qui permette d’associer une identité aux cellules d’intérêt afin d’en assurer la traçabilité tout au long des protocoles expérimentaux auxquels elles seront soumises par la suite. Les informations obtenues sur chacune de ces cellules par observation au microscope pourront ainsi être corrélées à celles obtenues lors d’analyses subséquentes.
Dans un premier temps, notre but a été d’attacher un marqueur fluorescent à des cellules arbitrairement choisies une à une dans une image de microscope. Nous avons pour cela développé « Cell labeling via photobleaching » (CLaP). Cette méthode repose sur l’utilisation d’un laser pour photoblanchir un fluorophore, ce qui génère un radical libre et permet la liaison d’une biotine à la membrane plasmique des cellules. Cette procédure est non toxique, n’affecte pas le transcriptome des cellules visées et le marquage peut être détecté plusieurs jours après avoir été placé. Nous faisons la démonstration de principe de l’utilisation de CLaP en conjonction avec la plateforme Fluidigm C1TM pour obtenir la séquence de quelques
iv
cellules choisies individuellement dans un échantillon. Nous étendons ensuite l’utilisation de cet outil à des échantillons tridimensionnels, ainsi qu’à l’ancrage simultané de plusieurs étiquettes de couleur, et à la génération de liaisons entre les cellules et leur substrat afin de permettre leur isolation.
Nous changeons ensuite de paradigme et, plutôt que d’essayer de reconnaître les cellules d’intérêt après avoir séquencé toutes les cellules de l’échantillon, nous cherchons à les isoler. Ces cellules purifiées restent viables et peuvent ensuite être séquencées, réinjectées, cultivées… Pour cela, nous proposons « Single-Cell Magneto-Optical Capture », scMOCA, une adaptation du précédent protocole qui permet de coller des billes magnétiques à la surface de cellules d’intérêt pour les extraire à l’aide d’un simple aimant. Ces manipulations nous ont permis de purifier sans dommages des cellules reconnues très sensibles tels des neurones primaires et des cellules souches embryonnaires. Nous démontrons les capacités de cette procédure en générant des lignées de cellules choisies pour leur capacité exceptionnelle à réparer les dommages induits à l’ADN et ainsi qu’en purifiant des cellules multinucléées jouant un rôle déterminant dans l’apparition des résistances aux médicaments et les récidives de cancer et finalement en extrayant les premières cellules qui se différencient en adipocytes à partir d’une culture de cellules 3T3.
Mots-clés : Cellule unique, marquage, séquençage, photoblanchiment, tri cellulaire, cellule rare, cancer.
v
Abstract
Even though they only recently appeared, single cell sequencing techniques have already highlighted huge variability among cells. Since then, numerous techniques arose that allow the characterization of each individual cell from a sample. This variability indeed holds crucial information that is lost when studies average observations across millions of cells. Outside of microscopy, most single cell protocols require the creation of a homogenized cell suspension from the sample. Because the spatial structure of the sample is broken, any information easily obtained with a microscope about shape, position, cell-cell contacts, migration direction and speed is lost. These descriptors are nevertheless key to understanding both embryo and pathology development, immune responses, nervous system functioning and cell growth and differentiation.
The objective of this project is to develop a technique that allows giving an identity to cells of interest to trace them across any protocol they might later undergo. This will allow pairing microscopy generated information with that obtained with any downstream analysis.
Our first goal was to tether fluorescent markers to cells that were individually chosen in a microcopy image. We developed Cell labeling via photobleaching (CLAP), in which a fluorophore is bleached using a laser to generate a free radical that allows binding a biotin to plasma membranes. This procedure is non-toxic, leaves transcriptomes untouched, and the tag can be found for several days. We show a proof of principle of the use of this technique with the Fluidigm C1TM platform to sequence individually chosen single cells. We then
extended this new tool for 3-dimentional samples, for the simultaneous use of multiple color stamps, and for sorting cells by binding them to their substrate.
We then considered the problem through a different angle: instead of trying to recognize data originating from single cells of interest after sequencing all cells from a sample, one can try to first isolate these few cells prior to sequencing, reinjecting or further culturing them. To this aim, we propose Single-Cell Magneto-Optical Capture (scMOCA), in which the above protocol is adapted to attach magnetic beads on cell surfaces. Viable cells can then be
vi
extracted with high efficiency and purity with a simple magnet; even from populations of very sensitive cells such as primary neurons or embryonic stem cells. Using this procedure, we generated cell lines selected for their outstanding ability to quickly repair induced DNA damage. We then purified multinucleated cells which are involved in the appearance of drug resistance and in cancer relapse and extracted cells that differentiated into adipocytes faster than the rest of the culture.
vii
Table des matières
Résumé ... iii
Abstract ... v
Table des matières... vii
Liste des tableaux ... xi
Liste des figures ... xii
Liste des sigles ... xiv
Remerciements ... xvi
Chapitre 1 : Introduction ... 1
Chapitre 2 : Revue des approches existantes pour marquer des cellules ou des molécules : article Exploiting Molecular barcodes in High-Throughput Cellular assays ... 5
a) Abstract ... 5
b) Introduction ... 6
c) Barcoding for single cell transcriptomics ... 8
d) Barcoding antibodies for transcriptomics and proteomics ... 10
e) Barcoding chemical libraries for interaction screening ... 14
f) Use of barcodes for lineage studies ... 14
g) Barcoding spatial information for next generation sequencing ... 16
h) Color barcoding of probes ... 17
i) Conclusions ... 21
Chapitre 3 : revue des techniques de marquage de la position des cellules ... 23
a) Les techniques permettant de corréler information biochimique et origine spatiale d’une cellule ... 23
b) La fonctionnalisation de substrats assistée par laser ... 25
c) Le photoblanchiment des fluorophores ... 26
Chapitre 4 : fonctionnalisation de membranes cellulaires par photoblanchiment, article Live single cell laser tag ... 29
a) Abstract ... 29
b) Introduction ... 30
viii
i) Cell labeling. ... 31
ii) Single-cell isolation and genomics. ... 35
iii) Laser-controlled spatial distribution of cells... 39
d) Discussion ... 41
e) Methods... 42
i) Cell culture. ... 42
ii) Single cell labeling. ... 43
iii) Cell viability... 44
iv) Cell proliferation. ... 44
v) Transient cell adhesions. ... 45
vi) Cell proliferation after CLaP-induced adherence. ... 45
vii) Laser and movement automation. ... 45
viii) Flow cytometry. ... 46
ix) Electron Microscopy. ... 46
x) Single cell whole genome amplification. ... 47
xi) Identification of species of origin of single-cells by polymerase chain reaction. . 48
xii) RNA sequencing. ... 48
xiii) Analysis of gene expression from RNA-Seq data. ... 50
xiv) Imaging. ... 50
xv) Image Processing. ... 51
f) Acknowledgements ... 51
g) Author contributions ... 51
h) Competing financial interests ... 51
Chapitre 5 : solutions apportées à certaines limites de la technologie ... 52
a) Utilisation de CLaP pour l’ancrage d’une tierce molécule à la membrane plasmique . 52 b) Marquage optique de cellules par des étiquettes multiples ... 54
c) Utilisation de CLaP dans un échantillon tridimensionnel... 58
d) Tri cellulaire par création de liaisons avec le substrat ... 62
e) Discussion ... 63
f) Matériel et méthodes ... 64
ix
ii) Préparation d’échantillons 3-dimentionnels ... 64
iii) Protocole pour délivrer des protéines à la membrane de cellules choisies. ... 65
iv) Protocole pour l’attribution simultanée de trois marques cellulaires. ... 65
v) Utilisation d’une excitation 2-photons pour taguer des cellules en trois dimensions 66 vi) Utilisation de CLaP pour isoler des cellules en les attachant à leur substrat de culture 66 Chapitre 6 : Enrichissement opto-magnétique de cultures cellulaires : article : Opto-magnetic capture of individual cells based on visual phenotypes ... 67
a) Summary ... 67
b) Abstract ... 68
c) Introduction ... 68
d) Results ... 71
i) scMOCa: efficient magnetic sorting of cells using ferromagnetic streptavidin-coated beads ... 71
Cell membrane biotinylation and ferromagnetic functionalization ... 71
Rare cells can be sorted and expanded with high efficiency and specificity ... 72
ii) Cells can be captured based on their ability to resolve ionizing radiation-induced DNA damage foci. ... 80
iii) The ability to quickly resolve 53BP1 foci is transmitted from parental to daughter cells 82 iv) Cells can be purified based on morphology ... 83
e) Discussion ... 86
f) Materials and methods ... 89
i) Key resource table... 89
ii) Cell culture ... 89
iii) 3T3-L1 cell culture and adipogenic differentiation ... 90
iv) Mouse Embryonic Stem cell (mES) culture ... 90
v) PDMS chambers ... 91
vi) scMOCa protocol ... 91
vii) Cell sorting using commercial magnetic cell separation columns ... 93
x
ix) Immunofluorescence and automated detection of nuclear GFP-53BP1 foci ... 94
x) Mitochondria staining and imaging ... 94
xi) Imaging ... 95
xii) Cell cycle analysis... 95
xiii) Conditioned medium ... 95
xiv) Polymerase chain reaction ... 96
xv) Immunoblotting... 96
g) Acknowledgments... 96
h) Competing interests ... 96
Chapitre 8 : Discussion et conclusions ... 97
a) Synthèse des travaux ... 97
b) Travaux futurs ... 101
c) Limites et améliorations ... 104
Références ... i
Annexe 1 : Informations supplémentaires publiées avec l’article Live single cell laser tag .... xv
Annexe 2 : Informations supplémentaires publiées avec l’article Opto-magnetic capture of individual cells based on visual phenotypes ... xxviii
xi
Liste des tableaux
Tableau I. Comparison of different DNA based barcoding techniques for single cell transcriptomics and proteomics. ... 13 Tableau II. Key resource table... 89
xii
Liste des figures
Figure 1. Schematics of the techniques. ... 20
Figure 2. Cell Labeling ... 32
Figure 3. Clap labeled cell viability and proliferation. ... 35
Figure 4. FACS identification of CLaP-labelled cells ... 36
Figure 5. Single-cell CLaP-labeled RNA transcriptome analysis ... 38
Figure 6. Induced transient cell adhesion ... 40
Figure 7. Utilisation de CLaP pour accrocher une molécule d’intérêt à la membrane des cellules cibles... 54
Figure 8. CLaP séquentiel en deux couleurs ... 55
Figure 9. CLaP multicouleur. ... 58
Figure 10. CLaP ex-vivo : marquage d’une rétine de rat ... 59
Figure 11. CLaP en trois dimensions ... 61
Figure 12. Tri cellulaire par attachement au substrat ... 63
Figure 13. Description of the technique ... 72
Figure 14. Images of cells functionalized with magnetic beads ... 74
Figure 15. Evaluation of scMOCA effisciency ... 77
Figure 16. Primary cells and embryonic stem cells survive scMOCA ... 79
Figure 17. Capture and expansion of individual cells that differ in their capacity to resolve ionizing radiation-induced 53BP1 foci ... 81
Figure 18. Examples of sorted multinucleated H226 cells ... 85
Figure 19. Étiquetage de cellules avec des fragments d’ADN ... 103
Supplementary Figure 1 ... xv
Supplementary Figure 2 ... xvi
Supplementary Figure 3 ... xvii
Supplementary Figure 4 ... xviii
Supplementary Figure 5 ... xix
Supplementary Figure 6 ... xx
Supplementary Figure 7 ... xxi
xiii
Supplementary Figure 9 ... xxii
Supplementary Figure 10. ... xxiv
Supplementary Figure 11 ... xxv
Supplementary Figure 12 ... xxvi
Supplementary Figure 13 ... xxviii
Supplementary figure 14. ... xxix
Supplementary figure 15 ... xxx
Supplementary figure 16 ... xxx
Supplementary figure 17 ... xxxi
xiv
Liste des sigles
ADN : acide désoxyribonulcléique ARN : acide ribonucléique
ARPE19 : adult retinal pigment epithelial cells B4F : biotin-4-fluorecéine
CU : cellule unique
CLaP : Cell Labeling via Photobleaching Cy5 : cyanine-5
DIBO : dibenzocyclooctyne
DMEM : Milieu essential minimal de Dulbecco DTT : Dithiothreitol
EDTA : éthylène diamine tétra acétate FACS : fluorescence activated cell sorting
LAPAP : Laser assisted protein adsorption by photobleaching MDCK : Madin-Darby canine kidney
IMCD : Mouse inner medullary collecting duct NA : ouverture numérique (numerical aperture) PDMS : polydimethylsiloxane
SCS : Single cell sequencing
U2OS : Human bone osteosarcoma epithelial cells WGA : wheat germ agglutinin
xv
xvi
Remerciements
Je voudrais commencer par remercier mon directeur de thèse, Santiago Costantino, pour ses conseils, ses enseignements, sa disponibilité.
Je remercie aussi tous les membres du laboratoire pour leur aide et l’ambiance de travail agréable qu’ils ont créée. Merci en particulier à Joannie, pour ces six années passées à servir la science ensemble dans la joie. Merci aussi à Javier pour son aide précieuse.
Je tiens aussi à remercier tous les gens qui ont contribué à ces travaux, les membres d’autres laboratoires du centre de recherche, le personnel du centre Mikhail Sergeev et Martine Dupuy, les stagiaires d’été Jean-Christophe Pelletier de Koninck et Lana Kashino.
Je voudrais aussi remercier mes amis qui m’ont entouré et soutenu pendant ces quelques années à Montréal.
Chapitre 1 : Introduction
Une grande majorité des techniques d’analyse des échantillons biologiques repose sur l’utilisation de marqueurs. En microscopie, par exemple, des molécules fluorescentes sont fréquemment utilisés pour rendre visibles les structures étudiées. De même, les études protéomiques telles FACS1, Cytof2, Abseq3, CITE-seq4, sont basées sur l’interaction entre une
molécule sonde et un récepteur caractéristique présent sur les cellules d’intérêt. Cette sonde aura au préalable été associée à un agent de contraste, typiquement une molécule fluorescente5-6, plus récemment un code barre d’ADN3-4 ou des isotopes métalliques2, 7-8, afin
de permettre sa détection. Cela présuppose d’abord que l’étude porte sur une caractéristique associée à une molécule déjà connue, et ensuite qu’un marqueur ayant une haute affinité chimique pour cette molécule existe et soit connu. Par exemple, aucun identifiant n’est associé à la position de chaque cellule dans l’échantillon, ou au nombre et à la localisation des molécules ou organelles dans la cellule ni même aux contacts entre cellules ou à leur distance par rapport à des sources de signaux moléculaires9-10. De même, le mouvement (la migration)
est un paramètre facilement observable au microscope, sans marqueur, qui est déterminant dans le développement d’un embryon, d’une tumeur, ainsi que des réponses immunitaires11.
De manière similaire, la forme des cellules révèle leur croissance, leur division, leur différenciation et leurs pathologies12 mais aucune molécule ne permet d’identifier
sélectivement toutes les cellules allongées ou ramifiées d’un échantillon. Il apparaît ainsi qu’un défaut de marqueurs biochimiques empêche l’étude de certains paramètres caractéristiques d’un échantillon biologique.
D’autre part, la nature chimique des interactions utilisées empêche l’identification spécifique d’une cellule choisie afin de la suivre dans le temps ou au cours d’expériences subséquentes. Pourtant, depuis quelques années, l’étude de cellules individuelles (CI) permet une meilleure compréhension sur les mécanismes qui assurent l’homéostasie des tissus, et comment celle-ci est rompue dans le cas de maladies. En effet, l’incroyable variabilité cellulaire a jusqu’à récemment été dissimulée dans les travaux réalisées sur des millions de cellules, les grandeurs étant mesurées en moyenne sur tout l’échantillon. Au contraire, l’étude de CI
2
permet de lever le voile sur les interactions entre cellules, d’analyser la progression de maladies provoquées par la présence de cellules rares ainsi que d’étudier les effets du microenvironnement, des niches, sur les phénotypes moléculaires.
Trois situations en particulier bénéficient de l’étude individualisée des cellules. En premier lieu, le séquençage de cellules individuelles a révélé la grande variabilité intercellulaire au sein d’un même échantillon, établissant l’existence de nombreux nouveaux types cellulaires13-14 et états d’activation impliqués dans la plasticité du système immunitaire15. En
second lieu, la considération de chaque cellule par rapport à son environnement immédiat s’est révélée riche en information, allant jusqu’à suggérer que certains types cellulaires devraient en fait être divisés en plusieurs sous types de caractéristiques bien différentes10, 16.
Finalement, les cellules rares nécessitent d’être étudiées individuellement puisque leurs caractéristiques sont effacées par le plus grand nombre de cellules lorsqu’une étude est réalisée en moyenne sur tout un échantillon.
On appelle cellules rares des cellules représentant moins de 0.1% de la population totale de l’échantillon17. Il existe de nombreuses situations dans lesquelles des cellules
présentes en infimes quantités jouent un rôle déterminant dans le maintien ou la rupture de l’homéostasie. Elles sont parfois même présentes dans un tissu auquel elles n’appartiennent normalement pas. Le développement d’un cancer ainsi que la formation des métastases représentent sans doute les situations les plus évidentes dans lesquelles de rares cellules vont avoir un effet dévastateur sur l’organisme. Les tumeurs résultent en effet de la prolifération anarchique d’une seule cellule18. On retrouve d’autre part dans le sang d’un patient atteint
d’un cancer de rares cellules tumorales circulantes. Il s’agit de cellules épithéliales qui ont été libérées à partir de la tumeur d’origine19 avec laquelle elles partagent donc de grandes
similitudes. Certaines de ces cellules vont se fixer à nouveau ailleurs dans l’organisme, provoquant des métastases20-21. L’extraction de ces cellules et leur analyse est nécessaire pour
établir un pronostic et une personnalisation du traitement que le patient doit recevoir. Cependant, leur rareté les rend difficiles à collecter puisqu’on en trouve environ 5 pour 7.5 millilitres de sang22, soit une pour un milliard de cellules sanguines environ23. L’utilisation de
3
techniques de capture traditionnelles basées sur la micro fluidique pour trier ces cellules peut aboutir à des taux de faux positifs de l’ordre de 81%23. De nombreux autres exemples peuvent
être cités tels que des populations de cellules souches rares24-25, des cellules infectées par des
virus ou des parasites, des cellules T anti tumeur26, des cellules inflammatoires27 ou des cellules
fœtales circulant dans le sang maternel28-29. L’extraction de ces dernières permet par exemple
d’établir facilement un diagnostic non invasif et donc sans danger pour le fœtus 29-30. La
médecine personnalisée31 et le dépistage de protéines sur des librairies cellulaires24, 32, qui est
très utilisé dans l’industrie et la recherche académique, sont deux exemples de technologies qui font jouer un rôle déterminant à quelques cellules au sein d’une population.
S’il est aujourd’hui admis que des informations capitales sont perdues lorsque des moyennes sont calculées sur des millions de cellules, étudier efficacement un grand nombre de cellules une à une n’en reste pas moins un défi technologique. Un nombre grandissant de méthodes ont pour objectif la caractérisation des protéines que des CI expriment, l’amplification et le séquençage de leur ADN ou de leurs ARN messagers. Lors de ces analyses, l’échantillon est dissocié pour former une suspension de cellules individuelles. Cette préparation de l’échantillon cause la perte de toute information structurelle, en particulier la position, et donc le proche voisinage, de chaque cellule. Une autre difficulté rencontrée après l’identification des cellules d’intérêt est leur isolation. La majorité des approches utilisant la micro fluidique pour isoler des cellules sélectionnées pour la présence, ou l’absence, de multiples récepteurs à leur surface sont optimisées pour atteindre un haut débit afin d’analyser rapidement des millions de cellules17. Cependant, ce haut débit est obtenu aux
dépens de la sensibilité de ces protocoles, qui sont alors peu efficaces pour détecter des populations de cellules très rares. De plus, même lorsqu’ils atteignent des résultats décents en termes d’efficacité (proportion des cellules ciblées qui sont réellement capturées) et de sélectivité (proportion de cellules capturées qui étaient réellement des cellules d’intérêt), les échantillons qu’ils génèrent sont très dilués à cause du grand volume de fluide utilisé pour créer un flot laminaire17, 33-34.
4
Un encodage efficace de ces indications de position, forme, vitesse et direction de déplacement, ne requérant pas une connaissance préalable des caractéristiques biochimiques propres de la cellule, est nécessaire afin de corréler les données générées par microscopie avec celles obtenues par toute autre technologie d’analyse de l’échantillon impliquant une altération de sa structure tridimensionnelle. Il s’agit là de la problématique traitée dans cette thèse.
L’outil de choix pour la mesure des caractéristiques citées précédemment est la microscopie. Les technologies optiques atteignant sans peine des résolutions inférieures au micromètre, elles sont idéales pour caractériser individuellement des cellules. Néanmoins, l’information spatiale visible au microscope est perdue lorsque les échantillons sont homogénéisés en suspension de CI prêtes à être séquencées.
Aussi, l’objectif de cette thèse est de proposer des solutions optiques pour attribuer des identifiants moléculaires à des cellules vivantes. Ces identifiants ne devront pas dépendre d’une connaissance a priori de la surface des cellules visées, et permettre un suivi des cellules vivantes au cours d’analyses subséquentes.
Ce paragraphe clôt le premier des six chapitres de cette thèse. Il est suivi d’une revue de la littérature des technologies disponibles pour marquer des cellules ou des molécules, publiée sous le titre Exploiting Molecular barcodes in High-Throughput Cellular Assays dans le journal SLAS Technology. Un troisième chapitre présente une revue des techniques qui permettent de conserver l’information spatiale lors de la caractérisation biochimique d’un échantillon. Vient ensuite une partie décrivant le cœur de la méthode développée pour répondre à la problématique. Cette section est constituée de l’article Live single cell laser tag publié en 2016 dans Nature communications. Un cinquième chapitre présente quelques améliorations non publiées qui ont été portées à la technique. S’en suivent deux parties qui détaillent deux technologies issues de ce premier travail, la première publiée en 2019 dans eLife sous le titre Opto-magnetic capture of individual cells based on visual phenotypes et la seconde faisant l’objet d’un brevet. Une discussion termine enfin cette thèse.
5
Chapitre 2 : Revue des approches existantes pour marquer
des cellules ou des molécules : article Exploiting Molecular
barcodes in High-Throughput Cellular assays
L’étude simultanée d’une multitude de paramètres sur un grand nombre de cellules génère un volume de données conséquent. La caractérisation de la présence, l’abondance ou la localisation réalisée simultanément sur plusieurs molécules nécessite de savoir reconnaître à quelle molécule chaque mesure correspond, et, dans certains cas, à quelle cellule elle est associée. L’approche qui est adoptée est d’attribuer une identité, souvent sous la forme d’une étiquette moléculaire, à chacune des molécules et/ou des cellules dont la présence ou l’abondance est mesurée. Cette étiquette assure la traçabilité de la cellule, et de son information génétique, transcriptomique, protéique, tout au long des protocoles qui vont permettre leur étude. Il existe un grand nombre de techniques permettant de générer, puis de lire ces étiquettes. Nous en avons fait une analyse détaillée dans l’article de revue publié dans SLAS technology en janvier 2019 sous le titre « Exploiting Molecular barcodes in High-Throughput Cellular Assays ». Ce chapitre est constitué du texte tel qu’il a été publié, les auteurs de l’article sont Loïc Binan, Elliot A. Drobetsky, Santiago Costantino.
a) Abstract
Multiplexing strategies, which greatly increase the number of simultaneously-measured parameters in single experiments, are now being widely implemented by both the pharmaceutical industry and academic researchers. Color has long been used to identify biological signals and, when combined with molecular barcodes, has substantially enhanced the depth of multiplexed sample characterization. Moreover, the recent advent of DNA barcodes has led to an explosion of innovative cell sequencing approaches. Novel barcoding strategies also show great promise for encoding spatial information in transcriptomic studies,
6
and for precise assessment of molecular abundance. Both color- and DNA-based barcodes can be conveniently analyzed with either a microscope or a cytometer, or via DNA sequencing. Here we review the basic principles of several technologies used to create barcodes and detail the type of samples that can be identified with such tags.
b) Introduction
The widespread implementation of drug screens by both the pharmaceutical industry and academia has triggered the development of barcoding strategies to significantly increase the number of molecules and samples that can be simultaneously characterized. The advent of sophisticated technological hardware for laboratory automation permits highly multiplexed approaches that greatly reduce time and cost. In this context, molecular tags can be used to specifically label, thereby acting as unique identifiers for, a variety of possible entities including individual cells35, pooled samples36-37, macromolecules4, spatial regions38, and cell lineages39.
These molecular tags are designed to label specific cells and molecules and possess biochemical properties that facilitate their identification.
The most widespread labelling approaches use either short oligonucleotides35 or
fluorescent labels40, as these can yield a large number of distinct combinations. Furthermore,
identification of such tags is usually performed with standard equipment where sequencing, or spectral detection, are integrated with high throughput assays. For example, short DNA molecules where each base can take four possible values yield enormous numbers of unique permutations. Indeed a 10-base-pair DNA oligo spans 410 (over a million) different
combinations. On the other hand, simple color barcodes based on only 5 different fluorescence molecules (e.g. DAPI, FITC, cyanine3, cyanine5, cyanine7 or any dye with similar excitation/emission spectra) in on/off states can generate 25 (32) labels. These commonly-used
channels can be detected with standard filters available on most fluorescent microscopes, and their number can be further increased with more specialized hardware as mentioned later in this review. In the case of either short oligonucleotides or fluorescent labels, the number of
7
attributes that can be simultaneously screened increases as a power of the number of channels, thereby generating large numbers of unique barcodes for multiplexing.
For color labels, two additional encoding dimensions can be incorporated to create barcodes. The first relies on different levels of signal intensity7 to yield higher numbers of
combinations. Indeed, while 5 colors used in on/off states generate 32 labels, using a code consisting of three intensities (no signal, low intensity, high intensity) could in principle generate up to 35 (243) labels. The second dimension involves positioning colored molecules
on a carrier structure41, so that their order can be measured. For example, the sequence of
colors along a carrier RNA molecule can be used just like DNA bases to generate a code42. The
use of super resolution microscopy allows precise determination of the position of each fluorescent molecule from which such sequences can be inferred. Instead of RNA carriers, hydrogels have also been used to spatially organize colored molecules, for instance within a bead, to create color barcodes43-44.
For DNA labels, a large number of different strategies has demonstrated the great versatility of this technology. For example, various pipelines developed for single-cell transcriptomics have incorporated different barcoding methods. Currently, the most wide-spread single cell sequencing technology isolates cells in liquid drops, which need to be tagged before being pooled into one sequencing reaction35. Barcoding individual cells is achieved via
inclusion of distinct short DNA oligonucleotides into all cDNA sequences during library preparation. Such DNA labels are used to assign each read to a cell of origin35 during analysis.
Based on a similar approach, cellular samples from different origins can also be barcoded, pooled, and sequenced in a single run. Sequenced DNA molecules include both the genetic information and the barcodes that are used to match sequencing information to a sample36-37. Considering the important cost of reagents in sequencing technologies, pooling
material is crucial towards reducing cost as well as time.
Short DNA molecules are also used to barcode antibodies and proteins, i.e., to combine proteomics and genomics4. This powerful approach permits detection of proteins and epitopes
8
tag the position of cells within a sample prior to tissue digestion45-46. Thus, transcriptomic data
can be matched with spatial tissue organization and cell distribution. Finally, cells can also be barcoded for lineage characterization where a unique identifier is passed to each cell’s progeny, allowing one to track differentiation and migration during developmental studies39.
In this review, we explore how barcodes have recently been exploited in a wide range of applications. We first focus on the use of cellular tags to recognize cells in next generation sequencing pipelines, and then detail how the same techniques are allowing identification of proteins in a sequencing protocol. We also consider how spatial position can be encoded to be paired with a sequencing read of a sample. Finally, we examine how color is being used to barcode various types of probes such as antibodies, proteins, or small ligands used to label cells or DNA fragments.
c) Barcoding for single cell transcriptomics
The use of oligonucleotides as barcodes has been key to the success of next generation sequencing (NGS) techniques35, 47-48. Although details vary among sequencing platforms, short
DNA identification sequences are incorporated into primers used for library preparation. Most of these, including NexteraTM primers, can be purchased in versions that include short
barcodes. Before sequencing, during library preparation, each cDNA molecule is fragmented and extended from both ends with Illumina’s adaptor sequences. When desired, each adaptor sequence can include identifiers that generate up to 384 combinations to identify each well in a plate. After library preparation, the 384 encoded libraries are pooled for sequencing, and resulting reads can still be distinguished49.
More recent single-cell RNA sequencing (scRNAseq) techniques further increase throughput by exploiting microfluidics to encapsulate cells in liquid drops50. These drops are
generated by water in oil emulsion, where each droplet replaces a well in a plate (Figure 1A). This approach dramatically increases the number of cells that can be simultaneously processed, i.e., up to several thousand. Each captured cell is assigned an identity through a
9
randomly generated DNA sequence that is immobilized in a gel bead (or on a solid bead) inside a water droplet (Figure 1B). The size and generation rate of liquid drops are tuned to maximize the number of droplets that contain only one cell and one bead. Barcode synthesis is realized by creating DNA molecules on gel beads one base at a time in a controlled fashion35. Beads are
randomly split into four equal groups, each of which receives one of the four DNA bases. Beads are then pooled and randomly split again into 4 groups for addition of the next base. This process of pooling and splitting is repeated several times, so that each bead carries multiple copies of the same sequence. The huge number of possible combinations obtained with very few bases (16,777,216 for a 12 bp barcode) guaranties a unique code for each bead with very low probability of two beads associated with the same sequence in a sample of a few thousand cells. Since the synthesis of cDNAs from captured single-cells is performed inside the droplet, and all primers in a bead carry the same barcode, cDNA molecules from a single cell share a unique tag.
As an alternative, Ramani et al51 proposed the use of a similar combinatorial barcoding
method on fixed nuclei, without requiring their individual capture. Cells are digested, and nuclei distributed in a 96-well plate with no more than 25 nuclei per well. In each well, DNA within nuclei is tagged by proximity ligation with a first barcode. Nuclei are pooled and split in 96 well plates again, and a second tag is placed at the extremities of the DNA molecules. The grouping of these subsequently added tags creates unique combinations (9,216 combinations in the case of 96 well plates) that can be used to identify individual nuclei.
Single-cell combinatorial indexing RNA sequencing (sci-RNA-seq), a similar method developed by Cao et al. 52, is also based on splitting and pooling fixed cells. Here cells are fixed,
permeabilized, and distributed in multi well plates. Each well is then incubated with a specific poly-T primer that includes a handle (i.e., a sequence common to all primers that enables PCR amplification) and a barcode, and mRNA molecules are reverse transcribed. Cells are then pooled and redistributed in multiwell plates where barcoded cDNA molecules are PCR amplified with primers specific for the handle sequence carried by the poly-T primers from the first step. All PCR primers carry their own barcode. Therefore, all cells carry a combination of
10
two barcodes, one from the primer used in the cDNA synthesis, and one from the primer used for the PCR amplification. Here again, probabilities ensure that they almost all have a different combination of the two barcodes, which allows reliable identification of individual cells.
Most primers used in single-cell NGS studies use barcodes not only to differentiate cells from each other, but also to identify reads originating from single RNA transcripts. Indeed, in the original droplet sequencing (Drop-Seq) paper35, barcoded primers also contained a random
8 base sequence, termed unique molecular identifier (UMI), which was different for each primer of the same bead among 65,536 possibilities. The presence of UMIs allows filtering of noise amplification artifacts from real cellular expression levels.
The main limitation of single cell sequencing is related to noise, as low expression transcripts are rarely captured which yields highly variable measured signals. The strategies for creating barcodes in this area are relatively well established, and efforts now focus primarily on improving sequencing noise, coverage, and tissue preparation. Another serious limitation originating from the use of beads to associate barcoded molecules to each cell is that, in order to guarantee that single (not doublet) barcoded beads are enclosed with unique cells in droplets, it is necessary to dilute beads, resulting in loss of large numbers of cells35. This is not
a problem for cell types that are highly represented in the sample; however, losing the majority of cells from a rare population can become a major hurdle. Other techniques used to associate one cell or one nucleus with one barcode are more limited in their throughput as the number of barcoded cells is then limited by the number of wells in a plaque51-52.
d) Barcoding antibodies for transcriptomics and proteomics
The simultaneous measurement of transcription and translation has represented a technological challenge for decades. Recently, new methods introduced the idea of generating proteins tagged with DNA to convert protein abundance and localisation into data that can be obtained with NGS technologies3-4. This novel use of DNA barcodes brings high throughput to
11
of a cell is of paramount importance; indeed RNA abundance is not always correlated with protein concentration53 due to variations in post transcriptional processing54.
The CITE-seq4 technique achieves simultaneous proteomic and transcriptomic
sequencing using DNA-labeled antibodies (Figure 1C) to tag cell surface proteins. Immunolabeled cells are captured for sequencing and the short DNA barcodes ligated to antibodies are detected as cDNAs originating from individual cells. The manner in which these short DNA barcodes are attached to the immunoglobulins varies between protocols. In CITE-seq, biotin and streptavidin are used, whereas in REAP-Seq55 the barcode is covalently linked
to the antibody to reduce steric hindrance. AbSeq3, 56 relies on a unique molecular identifier
attached to barcoded antibodies, allowing measurement of the abundance of individual proteins in cells. All these approaches are being rapidly accepted and used in various studies on cell surface proteins such as immune receptors18. Barcoded antibodies have been used to
develop a qPCR assay which allows the correlation between numbers of transfected plasmids, transcripts, and barcoded proteins to be evaluated in single cells57. In addition to protein
detection, barcoded antibodies are also used to quantify epitopes. Lee et al58 performed
western blots of cell lysates and used DNA barcoded antibodies to count single molecules. As all antibodies presented an antigen associated code, precise quantification was possible with specificity comparable to that of ELISA plates.
Genshaft et al59 developed a similar technique which employed proteins coupled to
DNA strands that share a short complementary sequence at their 3’ end. When two proteins bind their targets they co-localize sufficiently to allow DNA barcode hybridization. Each probe serves as a primer for extension of the other. This proximity extension assay (PEA, Figure 1D) that requires the tight co-localization of both probes for extension to occur, increases target specificity since remaining non-specific probes do not interact in a way that allows proximity extension. Barcodes are read using the C1 platform from Fluidigm to obtain the full sequence of all tagged antibodies.
Proximity extension assays have also been used to improve signal quality in FISH experiments. Proximity ligation assay for RNA60 (PLAYR) is based on two barcoded DNA probes
12
that hybridize in situ to improve the strength and specificity of the signal. When two of these probes hybridize in contiguous regions, they capture a third barcoded probe that is then circularized. The fact that precise localized hybridization of two different probes is required to capture the barcoded circle template dramatically increases the technique’s specificity. An amplification step is then performed with the circular structure serving as primer. This rolling circle amplification (RCA) of DNA generates a product than contains several repeats of the barcode, thereby generating strong signal amplification. The probed mRNA is converted into a highly repeated barcode compatible with fluorescent and mass cytometry detection. In applying the above technique Frei et al. used DNA barcoded antibodies, and simultaneously detected all barcodes on 14 channels to show strong correlation between RNA and protein localization60. Technologies based on antibody recognition require prior knowledge of protein
expression profiles in cell samples. Indeed, protein levels are critical to an accurate study based on protein-antibody interaction. More straightforward whole transcriptome sequencing experiments are less sensitive to this as they consider all available genetic information. Furthermore, specificity and affinity of antibodies are highly variable and strongly dependent on experimental conditions, rendering these antibody-based techniques largely experimental at present3, 61.
A key practical obstacle for single cell sequencing is cost and barcodes have been used to mitigate this by pooling several samples. Barcoded antibodies against ubiquitously expressed proteins with different DNA sequences were employed to tag individual samples62.
Similarly, Nag et al63 profiled twenty single nucleotide polymorphisms (SNPs) associated with
drug resistance in 463 samples of malaria-infected patients in one sequencing round. This approach reduces the cost by a factor 7, but loses sequencing depth as a trade-off.
An alternative to barcoding antibodies is to use aptamers, which show high specificity for their target molecule. Aptamers consist of RNA, and as such themselves constitute a barcode, i.e., alleviate the need for additional barcoding as in the case of antibodies. Aptamers need only be poly-adenylated to ensure their capture in the next-gen RNAseq workflow64. They
13
are easy to generate using SELEX65-67 and show binding efficiency and specificity at least equal
to that of antibodies68-69
The generation of new barcoding sequences cannot be completely random and as such is not necessarily straightforward. While available techniques for generating acceptable sequences are efficient, some constraints must be respected. Amongst these are GC content, homopolymer length, and certain sequences that must be avoided because of their natural presence in a sample or their recognition by a restriction enzyme70. These limitations imply
that most techniques based on random synthesis of a DNA barcode greatly overestimate the number of useful barcodes that can be generated when groups calculate the theoretical number as an exponential function (4number of bases). Taking into account these considerations,
Lyons et al70 provide a framework for generating billions of acceptable DNA barcodes.
Techniques for efficiently tethering a DNA strand to a protein such as an antibody are also being improved71-72. Table 1 summarizes key characteristics of each sequencing technique
described above. Theoretical # barcodes Tested # barcodes Processing speed
Read depth Doublet rate Capture rate Cost Drop-seq35 16,777,216 45,000 Thousands per hour 737,000 reads per cell
0.36 to 11.3% 12.8% 7 US¢/cell sciHiC51 # wells in a plate 2,000 Not provided 9,274 4% 100% Not provided sciRNAseq52 Not provided 15,997 Not provided 32,951 1.7% 100% 20 US¢/cell Cite-seq4 1,024 13 Same as Drop-seq Same as Drop-seq Same as Drop-seq Same as Drop-seq Not provided Ab-seq3 1,000 2 Same as Drop-seq Same as Drop-seq Same as Drop-seq Same as Drop-seq Not provided REAP-seq55 65,536 82 antibodies Same as
Drop-seq 20,000 Same as Drop-seq Same as Drop-seq Not provided Tableau I. Comparison of different DNA based barcoding techniques for single cell
14
e) Barcoding chemical libraries for interaction screening
High throughput screening requires the identification of target-interacting molecules from large candidate libraries. This is rendered difficult by the very limited number of channels offered by fluorescence73 and mass cytometry74, even when they are used simultaneously. In
theory, DNA barcodes can be employed to easily generate 1010 simultaneously usable
sequences75, each of which opens a new experimental channel in which an additional molecule
can be observed. This is much more than what can be achieved on FACS platforms76. Moreover
this high number of barcodes has been exploited to screen major histocompatibility complex multimers75 and DNA barcoded chemical libraries, where interacting partners can then be
identified by a simple PCR 77-79 .
In a similar manner, Pollock et al80 used phages to carry their barcode. They generated
a phage library with each member exposing an antibody fragment (Fab). The DNA sequence encoding the Fab is used as a barcode. They exposed 44 targets to exclusively capture those phages presenting a Fab that had affinity for the displayed targets, whereas other phages were rinsed away. As the captured phage also carried the DNA encoding the Fab, they could identify each interacting Fab by sequencing the phage.
f) Use of barcodes for lineage studies
Barcodes can be used to identify cellular progeny within an organism during normal development, tumor development, or infectious disease propagation81. Indeed, including a
known short DNA barcode sequence into the genome of a cell of interest ensures that it will be transmitted to progeny, allowing subsequent identification of the latter. As the number of divisions increases, mutations in the genome of the cells appear that create subgroups within the population. It is then possible to establish a genealogy tree of the final population of cells. Bacteria were tagged to study the dynamics of propagation of tuberculosis during the infection of a macaque82. The abundance of the subpopulation carrying any given mutation reflects the
15
the evolution of the relative abundance of 500,000 mutants within a single population83. This
permitted characterization of evolutionary dynamics after the appearance of beneficial mutations. Moreover; barcode-based lineage studies in bacteria can be exploited to characterize the appearance of drug resistance84.
Using a library of lentiviruses39, 85, a number of short DNA sequences can be integrated
into cells within an embryo, with different barcodes encoding different cells. Using NGS, these short sequences can be revealed to deduce cell lineage85. A modified CRISPR approach based
on a homing guide RNA (hgRNA) has also been used to integrate randomly mutating sequences within the genome86-87. This method targets nuclease activity to the locus into which the guide
RNA is integrated. Therefore, cells can cleave the gRNA locus, which is then repaired in an error-prone manner by non-homologous end joining, generating a new guide RNA, and at the same time mutating the sequence used as barcode. Cell phylogeny can then be inferred from the number and localization of mutations86, 88. Interestingly, given the mutation rate, the
inclusion of only 6 of these self-mutating barcodes would suffice to uniquely identify all neurons from a mouse. These lineage tracking techniques were coupled with whole cell sequencing workflows to study expression variation during zebrafish development89. In this
experiment, CRISPR mutations were not random but rather kept under the control of a heat shock-activated Cas9. CRISPR has also been used in Perturb-seq and CROP-seq to introduce changes in selected genes or promoters and characterize their effect on the whole transcriptome. A library of barcoded guide RNAs was used to infect cells. Each guide allowed perturbation of the expression of one gene, which was identified with the barcode carried by the guide RNA90-92. Barcodes have also been integrated within viral genomes to track their
lineage93. Barcoding viruses with 34bp DNA sequences allowed quantification of viral
subgroups, and calculation of the reactivation frequencies of the viruses post-treatment. Finally, color barcodes have also been used for lineage tracing based on Cre-recombinase activity in Brainbow94. Cre is able to excise or invert short DNA sequences that
are flanked by specifically recognized regions (lox regions). Therefore, infecting cells with distinct fluorescent proteins encoded in a single locus, each flanked by incompatible sets of lox
16
regions allows the random induction of one of the fluorescent proteins in the cell94 (Figure 1E).
Cre stochastic recombination has been used in very similar ways by various techniques such as BOINC95 and MultiBow96.
g) Barcoding spatial information for next generation sequencing
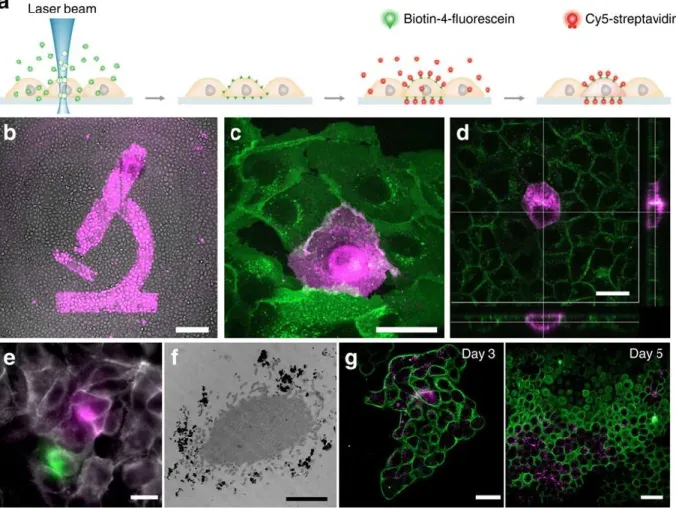
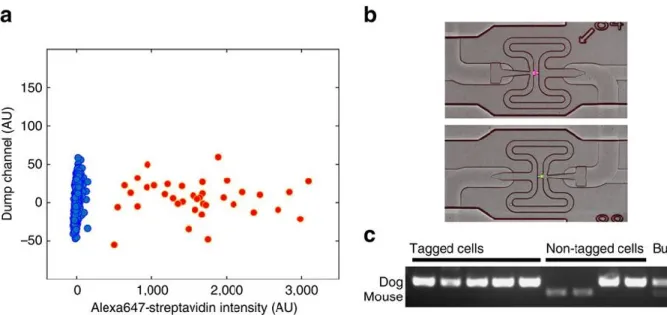
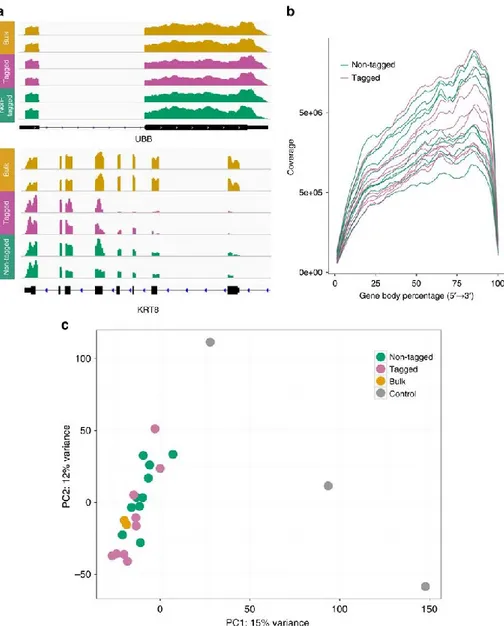
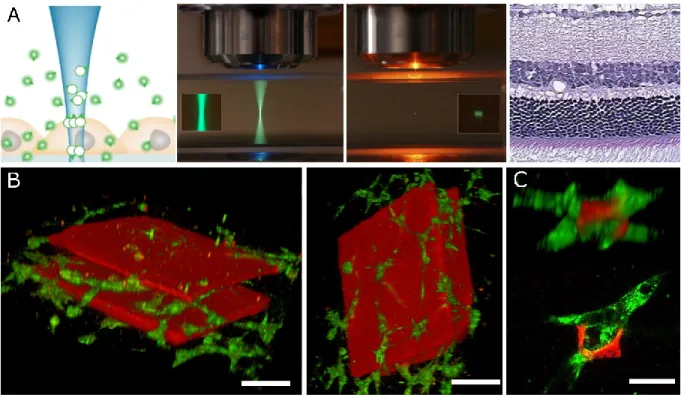
One critical piece of information that can be barcoded, which is otherwise lost in most NGS protocols, is the spatial origin of cells. TIVA45 allows individual selection of cells within alive microscopy image to be sequenced. To attain such precision, Lovatt et al designed a TIVA tag that enters cells and requires photoactivation to hybridize on polyadenylated mRNA. This tag is biotinylated, which allows downstream extraction of the mRNAs of interest with streptavidin beads. Even though this technique does not reach the read depth of scRNAseq, sequenced cells can be chosen, one at a time, and therefore cellular proximity and contact interactions can be studied38. Another method, termed CLaP46, allows pairing the information
generated by single cell sequencing protocols to individual cells in a microscopy image. It uses photobleaching to attach biotin to the membranes of cells that can be chosen based on visible criteria such as shape, migration speed and direction, cell-to-cell contact, or even a characteristic fluorescent signal present within the cell. The biotin can then be targeted with a fluorescent streptavidin. Color tagged cells can be recognized on a Fluidigm C1 sorting chip by epifluorescence imaging, and the whole transcriptome of spatially chosen cells can be evaluated with the typical read depth of NGS techniques.
The other approach for tracking the spatial origin of an mRNA is in situ sequencing, which has the unique capacity to reveal transcript location at the subcellular level. Knowing where transcripts are translated could prove very useful towards understanding functional relationships between genes38. Barcodes can be used to mitigate the major drawback of this
approach, i.e., the limited number of genes that can be simultaneously observed. Barcoding of “padlock probes” is used to increase the number of sequences that can be simultaneously analyzed97. Briefly two 20 base pair DNA probe sequences separated by a 50 bp linker are
17
hybridized with a cDNA target in situ which, after ligation, creates a circular shaped padlock probe. Ke et al.98 exploited this approach for in situ target sequencing using a known barcode
included in the linker region of the padlock probe. In addition to the signal amplification rolling circle products provide, these are also well adapted to in situ sequencing since they remain bound to the target sequence. Each product can be locally interrogated using sequencing by ligation. In their work, Ke et al98 encoded probes with 4 bp long barcodes, generating 256
combinations. They used these to locate 31 known transcripts in a breast cancer tissue section. Genes were detected with 98.6% efficiency, with a maximum of 90 reads per cell. This maximal limit is due to the fact that sequencing by ligation is based on imaging, and therefore requires sufficient spacing for the sequenced strands to be discriminated in the image. This is a very powerful method to detect and localize RNAs of known sequence, and Larsson et al99 used a
similar approach to locate DNA molecules.
FISH probes can also be spectrally encoded and then detected by super resolution microscopy40, 100. Lubeck et al40 simultaneously identified up to 32 different barcodes using 3
fluorophores. In this system the code is composed of intensity levels for each of the 3 color channels used to encode the probes. Super resolution microscopy allows sufficient resolution to fluorescently encode, detect, and localize all transcripts associated with a single gene101.
h) Color barcoding of probes
The number of possible colored probes that can be simultaneously used is restricted, since only a limited number of wavelengths can be detected without spectral crosstalk. To overcome this, several techniques are based on beads that each carry a signal in several color channels. The ratio of intensities in the different detection channels within a bead creates a barcode. Nguyen et al43 used ratiometric loading of gel beads with 5 lanthanide
nanophosphors. These have the advantage of being excited by the same wavelength, do not photobleach, and have narrow emission bands. Different combinations of loading ratios provided 1,101 codes. These beads can be assigned an affinity for a biological receptor by
18
coating them with a probe to use as an alternative to fluorescent antibodies. In a similar approach, Tang et al102 stained nematodes with beads loaded with a BODIPY fluorophore
flanked by two oxazines. The oxazines can be cleaved by simple light excitation, which shifts the fluorescence of the compound to higher wavelengths. The use of different activation times changes the signal ratios between the three emission wavelengths of the compound, as longer illumination increased the ratio of molecules that had their oxazine cleaved, therefore shifting their fluorescence towards longer wavelength. Different regions of the worm were efficiently encoded by simply varying the activation time along its antero-posterior axis. In a similar approach, Han et al103 developed microbeads loaded with quantum dots which allow
excitation of all channels with a single wavelength. In this protocol the code comprises 10 intensity levels in 6 color channels. The gel beads (approx. 1.2 µm diameter) can be loaded with different numbers of quantum dots and conjugated with DNA capture probes.
Alternatively, DNA has been used as carrier of fluorescent dyes for relative intensity barcoding42. Here, the fluorescent molecules are carried by a DNA dendrimer which
constitutes a code-carrying microstructure of reduced size thereby improving usability. Two color encoding of DNA probes has also been used to increase the number of targets simultaneously detected by FISH104.
Another key approach to color coding involves spatially organizing fluorescent molecules on a carrier. This carrier can be a gel bead, within which a barcode can be drawn by photobleaching105. Also, a DNA strand can be used as a carrier on which a sequence of color
tagged RNA hybridizes, creating a colored sequence. This technique, termed nCounter, was used to count mRNA molecules of over 500 genes and shows high sensitivity without amplification106. Each DNA strand is made of a capture sequence specific for the target mRNA,
and for a backbone on which colored RNA will hybridize. Using an electric field, all DNA backbones can be aligned in the same direction. Imaging then reveals the color sequence associated with each capture backbone, as well as their number.
On a similar note, DNA origami have been employed107 to accomplish the same
19
this approach, the DNA-PAINT structure is employed to spatially organize colored probes into as many as 216 barcodes. These probes are used to stain live yeast, and super resolution microscopy allows the spatial detection of up to 823,543 codes. In addition to not requiring alignment with an electric field, these probes have the key advantage of being significantly shorter (400-800 nm) than nCounter probes (2µm). Another approach uses structured metallic particles to create a reflected pattern that can be encoded. The advantage here is that all fluorescence channels are left available for more classical stainings108.
In addition to these approaches using ratios and positions to create codes, Hu et al109
set out to improve the library of available molecules for spectral encoding. They developed a library of polyynes to establish 20 simultaneously detectable light frequencies. These polyynes can be used to tag any protein and detected in 3 states using Raman spectroscopy: absent, low concentration, and high concentration. With this, a theoretical maximal number of barcodes of 59,048 was attained, the highest number for any optical technique to date.
Fixed tissue samples have been stained with up to 66 different antibodies barcoded with DNA and revealed with fluorescence microscopy in a technique termed CO-detection by inDEXing (CODEX)10. Each antibody type is associated with a specific DNA oligo which has a
common sequence for a complementary primer, a distinct length, and a very particular design. Antibodies are identified in pairs during extension of the complementary strands of their respective DNA barcode using standard fluorescence microscopy. A mix of fluorescently labeled U (green) and C (red) bases is added to the sample to only reveal the two antibodies with sequences having A or G as a first base after the primer during the first imaging cycle. After each image, fluorophores are cleaved, the excess of DNA bases removed, and either A or G is added to the polymerizing strand to select the next unique pair of oligos that will fluoresce in each imaging cycle (Figure 1G). Using this approach, Goltsev et al. managed to perform 36 imaging cycles with good signal to noise ratio to detect 31 proteins.
Finally, the use of antibodies tagged with distinct elemental isotopes (mostly metals) offers a comparable number of tags, as available panels consist of close to 40 markers8. In this
20
tagged antibodies. Time of flight measurements allows identification of each element present in the volatized material and their proportion. Mass cytometry can be used either in a configuration where single cells are directed to the plasma one by one, as in a FACS experiment, or with paraffin embedded tissue sections thereby preserving also spatial information110-111. Each different element bound to an antibody thus behaves as a barcode,
and the total number of possible codes is limited by the availability of pure isotopes that can be attached to these proteins. A technology that allows combination of several isotopes on one antibody to create multiple codes has not been developed to date.
Figure 1. Schematics of the techniques. Single cells are encapsulated with beads and also lysed inside droplets in a microfluidic device35. B. Barcoded beads are covered by short
DNA oligos containing: a PCR handle to hybridize primers during library preparation, a randomly polymerized sequence of 10-12 bp to barcode each bead, another random 8 bp sequence different in all oligos of the same bead, and finally a poly T sequence of 30 bases to hybridize the poly-A tails of mRNAs. C. Antibodies can be similarly barcoded; here oligo contains a poly-A tail to hybridize as mRNAs originating from the cells do. D During rolling circle amplification, two different antibodies are tagged with different DNA probes and hybridized with two other short ssDNA molecules. Only if antibodies are colocalized, ssDNA strands can be ligated in situ yielding circular DNA. In a final step, this rolling circle is used to amplify a long DNA product that contains several repeats of the antibody-specific sequence60. E. In one of Brainbow versions, a Cre recombinase is used to stochastically
21
excised pieces from a sequence originally inserted within cells’ genome and encoding for three fluorescent proteins. By design, only the first (downstream of the promoter) is expressed. Cre specific sequences are flanking these regions in a way that renders them mutually exclusive, resulting in the excision of one, the other, or none of the sequences. After Cre recombinase activation, cells are therefore either still red, or became randomly blue or yellow94. F In CODEX, antibodies used to tag cells are barcoded with DNA sequences
and their respective primers. A first amplification step with 3 bases, non-fluorescent G, and fluorescent U and C is performed. Sequences containing A are not extended as it is missing from the mix. After image acquisition and fluorophore removal, a second extension is performed with a mix of bases comprising A, and fluorescent U and C. This time, all template sequences containing A or G can be detected in fluorescence, while those containing a C are not extended since G is missing from the mix10.
i) Conclusions
In this review, we have described many uses for barcodes to identify a variety of objects, from molecules to cells, or even samples. Barcoding offers solutions to many practical problems, including reducing research-associated costs. Moreover, the ability to multiplex allows correlations to be established between biological phenomena in a single run, i.e. obviating the need for separate experiments. From a more academic point of view, although further extensive research is required, barcoding harbours great promise for encoding spatial information and for providing revolutionary methods of precise molecular quantification.
Two main tools are being investigated to barcode information, i.e., the use of synthetic DNA sequences, and fluorescence. Although the former requires sequencing, and therefore sample destruction, DNA tags provide higher numbers of possible combinations, hence more channels that can be simultaneously studied.
Several avenues remain to be explored more deeply. First, even though historically linked with barcode generation, fluorescence suffers from limitations in detection sensitivity. To address this, dyes with sharper excitation/emission need to be synthesized. Also, using colored microstructures to create color sequences that mimic DNA sequences greatly increases the number of barcodes that can be generated with the colors that can already be discriminated with the present technology. A complementary option is to use relative
22
intensities of different dyes carried by these same microstructures. To further empower these two approaches, barcoded microstructures need to be miniaturized to permit their use in biological samples. Additionally, many groups are focused on creating new techniques to place barcodes on the target cell or structure, such as split and pool encoding, DNA ligation, and antibody or microstructure conjugation, each with its own advantages. More work on these approaches should generate new opportunities.
Finally, despite what may be popularly believed, single cell sequencing techniques only provide means to explore the transcriptome of thousands of single cells, and indeed determining the sequence of a specific single cell chosen in its environment remains a challenge. A minor number of approaches are currently tackling this limitation, and once perfected hold great promise for addressing long standing biological questions where one cell is responsible for great changes such as in organism development, tumor progression, or immunity.