HAL Id: hal-00411063
https://hal.archives-ouvertes.fr/hal-00411063
Submitted on 20 Nov 2009
HAL is a multi-disciplinary open access
archive for the deposit and dissemination of
sci-entific research documents, whether they are
pub-lished or not. The documents may come from
teaching and research institutions in France or
abroad, or from public or private research centers.
L’archive ouverte pluridisciplinaire HAL, est
destinée au dépôt et à la diffusion de documents
scientifiques de niveau recherche, publiés ou non,
émanant des établissements d’enseignement et de
recherche français ou étrangers, des laboratoires
publics ou privés.
Call admission algorithms in multi-service and
multi-class ATM Network
Salima Hamma, Gérard Hébuterne
To cite this version:
Salima Hamma, Gérard Hébuterne. Call admission algorithms in multi-service and multi-class ATM
Network. SPIE proceedings series, Aug 2004, philadelphie, United States. pp. 48-59. �hal-00411063�
Call admission algorithms in multi-service and multi-class
ATM Network
S.Hamma
aG.H´
ebuterne
ba
Institut de Recherche en Communications et en Cybern´
etique de Nantes
Rue Christian Pauc BP 50609 44306 Nantes cedex 3 France
[email protected]
bInstitut National des T´
el´
ecommunications
D´
epartement R´
eseaux et Services de T´
el´
ecommunications
9 Rue Charles Fourier 91011 Evry Cedex France
[email protected]
ABSTRACT
The introduction of new ATM service categories increases the benefits of ATM, making the technology suitable for a virtually unlimited range of applications. Connection Admission Control (CAC) is defined as the set of actions taken by the network during the call (virtual connection) set-up phase, or during call re-negotiation phase, to determine whether a connection request can be accepted or rejected. Network resources (port bandwidth and buffer space) are reserved to the incoming connection at each switching element traversed, if so required, by the service category. The major focus of this paper is call admission in the context of multi-service, multi-class ATM networks. Several strategies suggesting rules on bandwidth sharing are found in the litterature. This study investigates particularly the Complete Sharing approach. Two service categories are concerned, namely, Constant Bit rate/Deterministic Bit Rate (CBR/DBR) and Variable Bit Rate/Statistical Bit Rate (VBR/SBR). Each service category is represented by a set of call classes corresponding to different bandwidth needs. We propose two algorithms to solve the underlying Markovian system: Product-form and Recursive solutions. A performance study based on the latter algorithm is implemented. We analyze the results of this very sharing strategy and set the not-to-violate limits for a beneficial use of it.
Keywords: ATM, CAC, Complete Sharing, blocking probability.
1. INTRODUCTION
Asynchronous Transfer Mode (ATM) technology is used in telecommunication networks environnement. It trans-port voice, video and data traffic. So, both utilisation and management of network resources must be studied at different levels. Moreover, ATM used statistical multiplexing which allow sources using the silent period (of inactive sources) to send their traffic. In order to exploit this advantage, it is necessary to know the sources behavior and the traffic they generate. This is relatively easy for the voice sources, a little less for the compressed video sources with random input rate, but that becomes very difficult for the data sources whose incoming rate is very variable.
The traffic in the ATM network is observed on three different levels. The connection level, burst level and cell level which are illustrated by the figure 1:
• Connection level: a connection is the first level of scales of time hierarchy which is of about a minute. Some connections requests (or calls) cannot all be satisfied, they are thus rejected. The calls rejection rate, called Grade of service (GoS) is the principal criterion of performance on connection level.
• burst level: is an intermediate entity between connection and cell level. It characterizes the sporadic nature of the traffic which results in active and silent periods. The cells are sent in bursting form during the active period whereas no cell is sent during the silent period.
• Cell level: is a data unit used to transmit traffic users. The scales of time associated with this level is about millisecond or microsecond. The most important quality of service (QoS) parameters are loss rate, delay and jitter.
connection level
burst level
cell level
Figure 1.the hierarchy of the levels: connection, burst and cell
In this study, we are interested in connection level. The acceptance of a new connection means the establishment of a virtual circuit (VC) on which resources (i.e. bandwidth and memory) are reserved for all the duration of the call. Once the connection is established, the network must respect the contract of quality of service negotiated with the source. According to the type of application, Standardization organizations, both IUT-T and the ATM Forum, have defined traffic contracts that concerns different quality of service needs. The statistical multiplexing allows a better network resources sharing, but requires certainly an efficient management of the bandwidth and traffic control. The CAC (Connection Admission Control) raises great discussions a great interest by network researchers community. The rest of the paper is organized as follows: chapter 2 describes the traffic control in ATM and enumerate various call admission strategies. In chapter 3, we present the context of the study, describe the model and gives a markov chain example. The algorithm we have proposed are described in chapter 4. Some numerical results and analysis are given in chapter 5. At last we conclude this study by giving the perspectives for next work on the subject.
2. TRAFFIC CONTROL
There is no flow control in ATM network, preventive control is thus required. It allows to prevent the deterioration of the quality of service relating to the calls in progress and control that sources respect contracts of traffic they subscribs for. Mechanisms ensuring these two functionalities are the CAC (Connection Admission Control) and the UPC (User Parameter Control). The CAC procedure is carried out during the connection establishment phase which allows to determine if the call can be accepted or not. The UPC procedure operates on the cell level which guarantee the contract of quality of service subscribed by the user. In this paper, we focus on resources sharing problem in a multi-service and multiclasses environment. Two kind of services are considered:
• CBR (Constant Bit Rate)/DBR (Deterministic Bit Rate) : the peak rate determines resources required by sources. The real times applications such as interactives multimedia applications, videoconference or circuit emulation are standard application examples.
• VBR (Variable Bit Rate)/SBR (Statistical Bit Rate) : the parameters identifying this type of service are peak rate (PCR), the sustainable rate (SCR) and the maximum burst size. It allows better resources share compared to CBR (DBR). The network guarantees to the sources the mean input rate or an equivalent
one calculated using an appropriate algorithms.2
2.1. Call admission strategies
The different strategies identify the link bandwidth sharing rules between the sources. Let us assume multi-server link of capacity C shared by K incoming traffic classes, b = {b1, b2, . . . , bK} and n = {n1, n2, . . . , nK}
respectively the required capacity vector number of calls of each class. The strategies of call acceptance given in literature are as follows6:
• The complete sharing method: is the policy which accepts a connection as long as the residual capacity is sufficient. It results in the following condition: bk+PKi=1nibi ≤ C where bk required resource and K is
the number of call classes.
• The complete partitioning method: it is the policy which accepts a call of class k if the residual capacity for this class is sufficient: (nk+ 1) bk≤ Ckwhere Ckis a bandwidth partition of class k calls andPKi=1Ci= C
• The partial partitioning method: is a similar policy with the preceding one except that the number of bandwidth partition is different of that of the number of call classes. A call of class k belonging to the group of classes Pl is accepted if it satisfies the following condition: bk+Pi∈Plnibi≤ Cl
• The threshold policies: this policy limits the number of calls of each class. Contrary to the precedent policy, the sum of the allocated partitions can exceed the total link capacity. A call of class k is accepted if it satisfies the following rule: (nk+ 1) bk ≤ Ck and bk+PKi=1nibi≤ C
• The trunk reservation: allows to overcome possible unfairness induced by the complete sharing strategy, which is the cause of increased blocking rates. After call admission of class k, the residual bandwidth must be equal to θk. The threshold choice makes it possible to control the blocking probabilities: bk+PKi=1nibi ≤
C − θk
• The equalizing policy: is considered as a particular case of precedent policy where θk is such that θk =
max{bk}, 1 ≤ k ≤ K. This choice allows to equalize the blocking probabilities of all the classes.
3. MODEL AND ASSUMPTIONS
Let PCR (resp. SCR) denote the amount of bandwidth consumed by DBR (resp. SBR) traffics.
3.1. The multi-service system
The paper focuses on the evaluation of the blocking probability in a multi-service system. We have considered two kind of services DBR and SBR. Each one is represented by a group of sources with different traffic parameters. The call admission policy we considered is complete sharing strategy. Based on the preliminary studies, the cell level QoS is assured according to the following equations:
X P CR ≤ ρ1C (1) X SCR ≤ ρ2[C − X P CR] (2)
This may delimit an area in which both DBR and SBR traffic are QoS quaranteed. Let us denote the quantity P (P CR + SCR) as the total load. It is kept less than (ρ2+ (1 − ρ2)ρ1) C < 1. Previous studies have shown
3.2. The model description
Let us denote Ω the state space acceptable by resource sharing policy:
Ω = {(n, m) | (0, 0) ≤ (n, m) . (d1, d2) ≤ (C1, C2)}
Where n and m are respectively DBR and SBR call number vectors: n = {n1, n2, . . . , nl} and m = {m1, m2, . . . , mp},
with ni or mi is respectively DBR and SBR call number of class i using bandwidth resource. d1 and d2 are
respectively DBR and SBR required capacity: d1 = {d11, d12, . . . , d1l}, d2 = {d21, d22, . . . , d2p}. We can also
write C1= ρ1 C, C2= ρ2[C − n d1] where C1, C2 gives the maximal capacity respectively of DBR and SBR
traffic. Thus: (n, m).(d1, d2) = ( l X i=1 nid1i, p X j=1 mjd2j)
where l is a number of DBR sources (classes) with offered load ai,D=µλi,Di,D, where λi,Dis incoming call admission
request rate and µ−1i,D is the mean service time of DBR communication of class i. p is a number of SBR sources
(classes) with offered load ai,S = λµi,Si,S, where λi,S is incoming call admission request rate and µ−1i,S is the mean
service time of SBR communication of class i.
The state distribution of Ω set is given by the following product form: P (n, m) = Πli=1 ani i,D ni! Πpj=1a nj j,D nj! G−1(Ω) (3) G(Ω) = X (n,m)∈Ω Πli=1 ani i,D ni! Πpj=1a nj j,D nj! (4)
The major performance parameter is the blocking probability denoted Pb(i,j) which gives the probability that
the DBR or SBR call of class i (needed bi bandwidth units) is blocked. We can write it as follows:
Pb(i,j) = X (n,m)∈Bi,j+ P (n, m) (5) where: B+i,j= {(n, m) ∈ Ω / (n+i , m+j) 6∈ Ω} (6) such as: n+i = {n1, n2, . . . , ni+ 1, . . . , nl} and m+j = {n1, n2, . . . , nj+ 1, . . . , np}
Equation (5) becomes: Pb(i,j) = 1 −
P (n,m)6∈B+ i,jP (n, m) = 1 − G(Bi,j+) G(Ω) with G(Ω) = G(C, T ): Pb(i,j) = 1 − G(C − d, T ) G(C, T ) (7) where: C = (C1, C2), T = (l, p) d = (di, dj) such as: di= ½ d1i si 1 ≤ i ≤ l 0 si i = 0 dj= ½ d1j si 1 ≤ j ≤ p 0 si j = 0
3.3. The Markov Chain example
The markov chain illustrated by the figure 2 shows the multiplexing of DBR and SBR traffic with input rate
requirement d1= d2= 1 unit. The total capacity of the shared link is 9 units. The incoming DBR and SBR call
bit rate are respectively λ1 et λ2. The service bit rate for DBR and SBR traffic is respectively µ1and µ2.
λ1 λ1 λ1 λ2 λ2 λ2 λ2 λ2 µ1 2µ1 3µ1 2µ2 3µ2 µ2 0,0 1,0 2,0 3,0 0,1 1,1 0,2 0,3 0,4 0,5 0,6 1,5 1,4 1,3 2,4 2,5 3,4 3,3 3,2 1,2 2,3 2,2 3,1 2,1 (1) (2)
Figure 2. Markov Chain example, C = 8, ρ1= 0.4, ρ2= 0.8
4. THE PROPOSED ALGORITHMS
We propose two algorithms, one based on a matrix representation of G (product form solution) and the second one is a recursive solution based on the state space reduction.
4.1. The first algorithm
The following algorithm is an extension of the Kaufman-Roberts algorithm.4 It is developped for the
com-plete sharing of the bandwidth between differents classes calls (differents bits rate). It consists of a matrix representation G for dimension 4 of which each element is computed iteratively.
G(J, 11) = v/d11 X nl=0 anl 1,D nl! 11= (1, 0) J = (v, w) v = {0, . . . , ρ1C} w = {0, . . . , ρ2[C − v]} G(J, 12) = w/d12 X np=0 anp 1,S np! 12= (0, 1) G(J, R1) = v/d11 X nl=0 anl 1,D nl! G(J − D1, R1− 11) D1= (nld1l, 0) R1= (x, 0) x = {1, . . . , l} (8)
G(J, R2) = w/d12 X np=0 anp 1,S np! G(J − D2, R2− 12) D2= (0, npd2p) R2= (0, y) y = {1, . . . , p} G(J, R) = v/d11 X nl=0 w/d12 X np=0 anl 1,D nl! G(J − D1, R − 11) anp 1,S np! G(J − D2, R − 12) R = (x, y) x = {1, . . . , l} y = {1, . . . , p} G(J, 01) = 1 01= (0, y) G(J, 02) = 1 02= (x, 0)
The number of combinations in J denoted X is cardinal of state Markov chain number: X = (N + 1) M where :
N = C1max, maximum capacity which can be used by DBR traffic. M = C2max, maximum capacity which can
be used by SBR traffic knowing that DBR traffic null. The number of combinations in T denoted Y is given by: l ∗ p + (l + p)2
Thus, the matrix X*Y element is recursively calculated. However, this leads to accuracy and excessive run time problems when the capacity of the link grows and the number of DBR and SBR sources become considerable. In order to avoid such difficulties, we have developed recursive algorithm with two dimensions instead of four dimensions as in previous solution.
4.2. The second algorithm
The main idea is to use two random variables denoted C1 and C2 where C1 = n d1, is a total number of
bandwidth units occupied by DBR traffic and C2= n d2, is a total number of bandwidth units occupied by SBR
traffic. Let us assume C = (C1, C2). The distribution function of C is given by:
q(c) = X
(n,m)∈S(c)
P (n, m) (9)
Where S(c) = {(n, m) | (n . d1, m . d2) = (c1, c2)}
From equation (9) we can write the following equations:
c q(c) =P (n,m)∈S(c) c P (n, m) =P (n,m)∈S(c)[ Pl i=1nid1i + Pp j=1mj d2j P (n, m) =P (n,m)∈S(c)[ Pl i=1nid1iP (n, m)] + [Ppj=1mjd2jP (n, m)] =Pl i=1d1iP(n,m)∈S(c) ni P (n, m) + Ppj=1d2j P(n,m)∈S(c) mj P (n, m) However,P (n,m)∈S(c) ni P (n, m) =P(n,m)∈S(c) niΠlq=1 anqq,D nq! Π p j=1 anjj,D nj! G −1(Ω) =P (n,m)∈S(c) ni anii,D ni! Π l q=1,q6=i anqq,D nq! Π p j=1 anjj,D nj! G −1(Ω) =P (n,m)∈S(c) ai,D ani−1i,D (ni−1)! Π l q=1,q6=i anqq,D nq! Π p j=1 anjj,D nj! G −1(Ω) =P (n,m)∈S(c) ai,DP (n − 1i, m) = ai,D P(n,m)∈S(c−d1i) P (n, m) = ai,Dq(c − d1i)
In the same way: P (n,m)∈S(c) mjP (n, m) =P(n,m)∈S(c) aj,SP (n, m − 1j) = aj,S P(n,m)∈S(c−d2j) P (n, m) = aj,Sq(c − d2j) Thus, c q(c) = l X i=1 d1iai,Dq(c − d1i) + p X j=1 d2j aj,S q(c − d2j) (10)
The algorithm is as follow:
1. g(0, 0) = 1; g(c1, c2) = 0 si c1< 0 ou c2< 0
2. for c1= 1, . . . , C1max C1max= ρ1C
for c2= 1, . . . , C2max C2max= ρ2[C − c1]
g(c1, c2) =c1+c1 2 [Pli=1d1iai,Dg(c − d(1)i ) + Pp j=1d2jaj,Sg(c − d(2)j )] c = (c1, c2), d(1)i = (d1i, 0), d(2)j = (0, d2j) 3. G =PC1max c1=0 PC2max c2=0 g(c1, c2)
4. for c1= 1, . . . , C1max C1max= ρ1C
for c2= 1, . . . , C2max C2max= ρ2[C − c1]
q(c1, c2) = g(c1G,c2)
5. Compute the blocking probabilities for the two kind of traffic (DBR and SBR).
4.3. Blocking probabilities
The blocking probabilities of DBR calls denoted B1 and SBR calls denoted B2 are given by the following
equations: B1 = Cmax−C1max X c2=0 q(C1max, c2) + C1max−1 X c1=0 C2max X ⌊ρ2[C−(c1+1)]+1⌋ q(c1, c2) (11) B2 = C1max X c1=0 q(c1, C2max) (12)
Where : C1max= ⌊ρ1C⌋, C2max= ⌊ρ2(C − c1)⌋, Cmax= C1max + ⌊ρ2(C − c1max)⌋
The blocking probabilities of respectively DBR and SBR traffic classes is denoted B1i, i = {1, . . . , l} and B2j,
j = {1, . . . , p}. They are calculated as follows:
B1i = Cmax−C1max X c2=0 min(C1max,d1i−1) X j=0 q(C1max− j, c2) + C1max−1 X c1=0 min(c1,d1i−1) X j=0 C2max X ⌊ρ2[C−(c1+1)]+1⌋ q(c1− j, c2) (13) B2j = C1max X c1=0 min(C2max,d2j−1) X i=0 q(c1, C2max− i) (14)
5. RESULTS AND DISCUSSIONS
In this paper, we propose to study the behavior of the system solved by the recursive algorithm describes previously. We consider several system configurations in terms of the total offered load bandwidth requested by each call. We are also interested in the evaluation of the blocking probabilities according to the ratio of the traffic offered DBR and the traffic offered SBR.
Because the analytical solution uses the values of ai,x = λµi,xi,x, x = D, S., and not the individual values, an
important step is to confirm this property. This is done through a simulation study. The performance evaluation carried out are given in the following paragraphs.
The simulation model studied corresponds to a queue MD+ MS/M/c/c. The Poisson arrivals correspond to
DBR and SBR calls. The service time (of the communication) is exponential. The total capacity is given by:
Cmax= C1max+ ⌊ρ2(C − C1max)⌋ where C1max= ⌊ρ1C⌋
C is the total link capacity, ρ1 and ρ2 is respectively DBR traffic load and SBR traffic load
The simulator is developed in C language, it corresponds to events simulation. Each one is described by its arrival date, type of service, class, type of event (Arrival or Departure) and duration. This simulation allows to validate the recursive solution and to evaluate the blocking probabilities according to the ratio of service rates.
5.1. Blocking probabilities evolution
We consider two kinds of services (DBR et SBR) which share the same ATM transmission link with capacity of 25 Mb/s. For each service, we assume two kind of calls. One called class 1 correspond to high incoming bit rate and other called class 2 with low incoming bit rate. These rates are given in unit (1 unit=100Kb/s). The test parameters are given in table 1. The total offered traffic load is 0.7,0.8 and 0.9.
DBR traffic SBR traffic
class 1 5 units 5 units
class 2 1 unit 1 unit
Table 1.input rate of two kind of calls
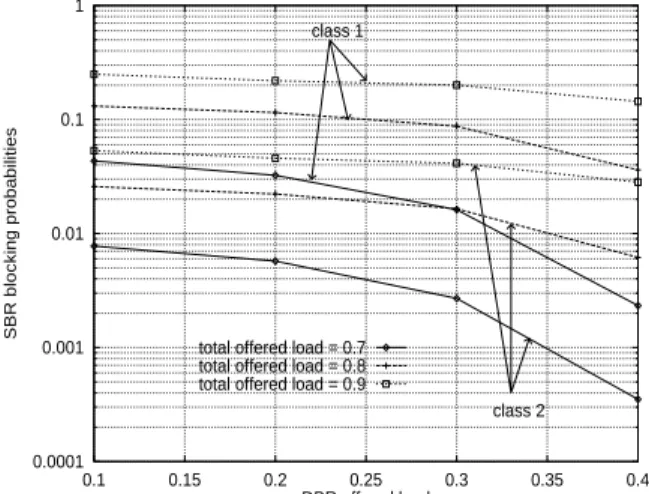
The figures 3 and 4 illustrate the behavior of the blocking probabilities of each call according to the DBR load. A first obvious remark we can made is the increase in the probabilities of call rejection when the total load offered increases. We can also note that the rejection probability is high for calls requiring a greater bandwidth capacity (typically calls of class 1). Moreover, the probability of blocking DBR calls decreases slightly when their offered traffic load is low (figure 3). When the offered traffic load becomes more important, the call rejections are also more important. Maximum rejection probability for DBR sources is reached when offered load is 0.4 for any total load (DBR+SBR) values. Whereas, blocking probability of SBR calls decreases when the DBR offered load increases, i.e. that of SBR decreases. The reduction is more sensitive when DBR load increases.
5.2. Impact of the DBR traffic
The figures 5 and 6 illustrate the impact of traffic DBR (SBR offered load fixed) on respectively DBR and SBR calls rejections. The behavior is studied for two different configurations. The first configuration relates to SBR calls load 0.4 (low). The second relates to SBR calls load 0.8 (high). In the first case, the probability of rejection increases quasi linearly when DBR load increases. The maximum increase reaches at maximum load DBR=0.6. This behavior is identical for two traffic classes. However, blocking probability is higher when the bandwidth capacity requirement is high, i.e. class 1. In the second case, rejection probabilities is higher because it is not consider only the states DBR border as is almost the case in preceding configuration but also probability in SBR borders since load SBR is 0.8 for all test. So, the degradation observed corresponds to the increase of DBR load in the system.
0.001 0.01 0.1 1 0.1 0.15 0.2 0.25 0.3 0.35 0.4 DBR blocking probabilities DBR offered load class 1 class 2
total offered load = 0.7 total offered load = 0.8 total offered load = 0.9
Figure 3. DBR blocking probabilities for different
of-fered traffic load, d1={5, 1}, d2={5, 1}
0.0001 0.001 0.01 0.1 1 0.1 0.15 0.2 0.25 0.3 0.35 0.4 SBR blocking probabilities DBR offered load class 2 class 1
total offered load = 0.7 total offered load = 0.8 total offered load = 0.9
Figure 4. SBR blocking probabilities for different
of-fered traffic load, d1={5, 1}, d2={5, 1}
1e-05 0.0001 0.001 0.01 0.1 1 0.1 0.2 0.3 0.4 0.5 0.6 0.7 0.8 0.9 DBR blocking probabilities DBR offered load class 1 class 2 class 2 class 1 SBR offered load = 0.4 SBR offered load = 0.8
Figure 5.DBR traffic impact, d1={5, 1}, d2={5, 1}
1e-05 0.0001 0.001 0.01 0.1 1 0.1 0.2 0.3 0.4 0.5 0.6 0.7 0.8 0.9 SBR blocking probabilities DBR offered load class 1 class 2 class 2 class 1 SBR offered load = 0.4 SBR offered load = 0.8
Figure 6.DBR traffic impact, d1={5, 1}, d2={5, 1}
5.3. Impact of the SBR traffic
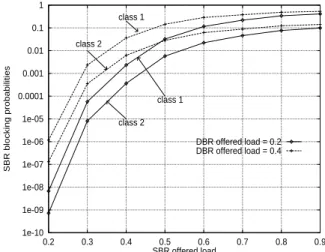
The figures 7 and 8 show the impact of SBR traffic on the rejection probabilities for both DBR and SBR calls. We have assumed a fixed DBR load and a variable SBR load. Two different values of DBR load are used, namely low DBR load (0.2) and high DBR load (0.4). In case of low DBR load, the figure 7 shows the influence of the SBR load on the rejection probabilities of the DBR calls which is effective only when this load is higher than 0.3. For a lower load, this loss is constant since limit SBR not being reached yet. In the second case, the blocking probability of DBR traffic are constant since the SBR load is less than 0.4. The system is then mostly saturated by DBR calls. We achieve the SBR limit gradually with the SBR load increase as shown in figure 8.
5.4. Impact of the traffic ratio
We consider the multiplexing of DBR and SBR sources. Each one requires a capacity of 1 unit (100Kb/s) for a
total capacity of 25Mb/s (250 units). Let us denote A1 the traffic offered by DBR sources and A2, the traffic
offered by SBR sources such as:
A1=Pli=1ai,Dd1i where ai,D= λµi,Di,D l: is a number of DBR sources
1e-05 0.0001 0.001 0.01 0.1 1 0.1 0.2 0.3 0.4 0.5 0.6 0.7 0.8 0.9 DBR blocking probabilies SBR offered load class 2 class 1 class 2 class 1 DBR offered load = 0.2 DBR offered load = 0.4
Figure 7.SBR traffic impact, d1 ={5, 1}, d2={5, 1}
1e-10 1e-09 1e-08 1e-07 1e-06 1e-05 0.0001 0.001 0.01 0.1 1 0.2 0.3 0.4 0.5 0.6 0.7 0.8 0.9 SBR blocking probabilities SBR offered load class 2 class 1 class 2 class 1 DBR offered load = 0.2 DBR offered load = 0.4
Figure 8.SBR traffic impact, d1={5, 1}, d2={5, 1}
We try here to answer (illustrated by a curve) to the following questions: 1. What is the evolution of the losses according to the traffic ratio A1
A2 ?
2. What is the variation of the call rejection related to two types of traffic and according to the ratio A1 A2 and
to the input rate needed by each one ?
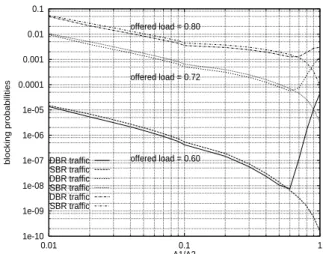
The answer to first question is illustrated through the figure 9 which traces the evolution of the loss for increasing loads. First, we observe that the higher the ratio A1
A2 (i.e. traffic DBR increases and SBR decreases), the lower
the rejections probabilities for the two types of services. This behavior is true as long as the proportion of traffic offered does not exceed 0.6, i.e. when traffic DBR does not exceed 60% of offered traffic SBR. In case of this ratio is higher to 0.6, the blocking probability of DBR sources increases very quickly (due to the limitation of allowed DBR load). If we consider the quality of service for each type of traffic, in a configuration of complete
bandwidth sharing, its maximum is reached when A1
A2 is about 0.6.
In order to answer the second question, we consider multiplexing of DBR and SBR sources with different band-width requirements (in opposite of the preceding case). The figure 10 illustrates the behavior of a system induced by such choices.
When the bandwidth required by DBR traffic is higher than those of SBR (typically d2= 1 and d1= 2, 3, 4, 5),
the ratio of the blocking probabilities is proportional to the number of units required by DBR. On the other hand, when the requirements are higher for SBR (typically d1 = 1 and d2 = 2, 3, 4, 5), the ratio of the blocking
probabilities is inversely proportional to the number of units required by SBR. Moreover, this ratio is constant for any value of ratio A1
A2 ≤ 1.
5.5. Impact of service rate ratio
The product form as well as the recursive solution let suppose that the behavior of the system depends only on
the λ
µ ratio and not of λ and µ separately. In this paragraph, we look at the influence of DBR and SBR service
rates on the system behavior. Four experiences were conducted as resume in table 2. The figures 11 and 12 show respectively results related to test2 and test3. We can draw two conclusions. First, simulations validate the Markovian model given in the previous paragraph, confirming that blocking probabilities do not dependent on the service rate ratio.
1e-10 1e-09 1e-08 1e-07 1e-06 1e-05 0.0001 0.001 0.01 0.1 0.01 0.1 1 blocking probabilities A1/A2 offered load = 0.60 offered load = 0.72 offered load = 0.80 DBR traffic SBR traffic DBR traffic SBR traffic DBR traffic SBR traffic
Figure 9.blocking probabilities as function of A1
A2, d1= 1, d2= 1 0.1 1 10 100 1000 10000 0.01 0.1 1 Pb1/Pb2 A1/A2 d1=1, d2=1 d1=2, d2=1 d1=3, d2=1 d1=4, d2=1 d1=5, d2=1 d1=1, d2=2 d1=1, d2=3 d1=1, d2=4 d1=1, d2=5
Figure 10. rejected calls variation as function of A1
A2 et
des di, i = 1, 2
Parameters test1 test2 test3 test4
λD 30 30 30 60
µD 1 1 1 1
d1 1 2 1 1
λS 20 µS 20 µS 30 µS 120 µS
µS µD/ratio µD/ratio µD/ratio µD/ratio
d2 5 5 5 1
Load 0.56 0.64 0.72 0.76
Table 2. Test parameters
6. CONCLUSIONS AND PERSPECTIVES
This paper deals with calls acceptance problem in multiservices and multiclasses mode in ATM network. Appro-priate algorithms describe how the bandwidth transmission link is shared between various sources. In this study, the focus is restricted to the complete sharing strategy, when two different service levels are mixed, respectively a constant service rate (DBR) and a variable, but controlled, one (SBR). Previous studies at the cell level have defined rules for the simultaneous fulfilment of QoS requirements of both DBR and SBR. Based on these results, we propose two algorithms allowing the resolution of the markovian system managing the various calls. Our proposal take into account the different resources requirements by each type of service. In other words, the model is valid whatever the number of classes associated with each category of service. The second algorithm is easier to implement as it reduces the state space needed for the mathematical resolution. The performance study allows to understand and analyze sharing mechanism, so as to define its limits and optimize its use. Especially, this allows to draw the following broad conclusions:
• when the traffic offered by DBR does not exceed 60% of the traffic offered by SBR, the blocking probability of the calls decreases, if the bandwidth requirements are equal for the two service categories or higher for DBR one.
• when the traffic offered by DBR is maximum equal to traffic offered by SBR, the probability decrease only if SBR traffic requirements are higher than those for DBR.
0.001 0.01 0.1
0.1 1 10 100
blocking probabilities
service rate ratio DBR traffic, simul SBR traffic, simul DBR traffic, exact SBR traffic, exact
Figure 11.call rejection as function of µD
µS, test2 0.001 0.01 0.1 0.1 1 10 100 blocking probabilities
service rate ratio DBR traffic, simul SBR traffic, simul DBR traffic, exact SBR traffic, exact
Figure 12.call rejection as function of µD
µS, test3
However, the sharing policy raises a fairness problem. The calls with higher input rate have a stronger probability of being refused. For this reason, this phenomenon should be controlled. This could be done, using the general approach of6:
• The first approach consists in using threshold algorithms with considering an equalization of the blocking probabilities. This equalization must take into account the asymmetry shown in first two equations given in the beginning of this paper.
• The second approach will consist in maximizing a global factor profit according to the estimated profits of each category as illustrated by the following equation: G(BD, BS) =Pi
λi(1−Bi)di
µi Xi where Xi, i = D, S
are the profit associated to DBR and SBR services.
The question is here in the choice of Bi so that to optimize the global acceptance scheme.
This last approach can be less easy to realize and further studies remain to be lead in order to clarify these points.
REFERENCES
1. S.Chung, K.W.Ross, “Reduced load Approximations for Mutirate Loss Networks”, IEEE Transactions on Communications, Vol.41,N0.8, 1993.
2. M.Ritter, P.Tran-Gia editors, “Multi-Rate Models for dimensioning and Performance Evaluation of ATM Networks”, COST 242, Juin 1994.
3. M.Delaire, G.H/’ebuterne, “Call blocking in multi-services systems on one transmission link”, 5th IFIP Workshop on performance Modelling and Evaluation of ATM networks, Juillet 1997, Illkley (GB).
4. J.Kaufman, “Blocking in Shared Ressource Environnement”, IEEE Transactions on Telecommunications, Vol.com-29, No.10, Octobre 1981.
5. J.Roberts, U.Mocci, J.Virtamo editors, “Performance Evaluation and Design of Broadband Mult-services networks”, Broadband Network Teletraffic, Springer-Verlag, 1995.
6. K.W.Ross, Multiservice Loss Models for Broadband Telecommunication Networks, Springer-Verlag, 1995. 7. A.Ziram, “Aspects multiservices des r´eseaux large bande : application l’´etude des performances au niveau