EFFECT OF SOIL MOISTURE ON TRACE ELEMENTS CONCENTRATIONS USING PORTABLE X-RAY FLUORESCENCE SPECTROMETER
H. Sahraoui* and M. Hachicha
National Institute of research in Rural engineering, Water and Foresty. Hedi Elkarray Street, Elmenzah IV, Tunis, Tunisia
Received: 07 September 2016 / Accepted: 27 December 2016 / Published online: 01 January 2017 ABSTRACT
Portable X-ray fluorescence (PXRF) technology can offer rapid and cost-effective determination of the trace elements concentrations in soils. The aim of this study was to assess the influence of soil moisture content under different condition on PXRF measurement quality. For this purpose, PXRF was used to evaluate the soil elemental concentrations for Ca, Mg, Cd, Cr, Cu, Ni, Zn, P, Fe, Mn and Pb in 60 samples in a perimeter irrigated with treated wastewater (Cebala Borj Touil, North-east Tunisia). Scanning was conducted under four moisture conditions: in-situ, dried soil at 105°C, 40% moisture content soil and saturated soil. All were then compared relatively to dried sample scans. As expected, the relationship between dried vs both in-situ and 40% moisture content elements concentrations were linear. However, PXRF readings from saturated samples were significantly underestimated compared to the measurements on dry samples. Furthermore, soil moisture content caused a significant under-reporting of elemental concentrations compared to the scanning on dry samples. PXRF acted differently for each element following the moisture content of soil. In fact, attenuation coefficient σ of Cr, Fe and Mn were the most affected by saturation of soil samples, whilst Ca, Mg and Ni were more affected for 40% moisture content while Cd, Pb, Zn, Cu and P were affected for in-situ measurements. Correction equations enhanced the error produced by the water influence moisture content and corrected PXRF measurements.
Keywords: PXRF analysis; Soil; moisture content; trace elements.
Author Correspondence, e-mail:[email protected] doi:http://dx.doi.org/10.4314/jfas.v9i1.26
ISSN 1112-9867
Available online at http://www.jfas.info
Journal of Fundamental and Applied Sciences is licensed under aCreative Commons Attribution-NonCommercial 4.0
1. INTRODUCTION
Trace elements in soil can be detected by several conventional laboratory methods such as ICP-AES (inductively coupled plasma atomic emission spectrometry), ICP-OES (inductively coupled plasma optical emission spectrometry), AAS (atomic absorption spectrophotometry) and AFS (atomic fluorescence spectrometry). However, these techniques are severely limited by the high costs of analysis, laboratory consumables and time used in laboratory processing [1-2]. Therefore, there is a need for rapid, cost-effective and accurate analytical methods. The portable X-ray fluorescence (PXRF) can rapidly determine element concentrations on sites of interests directly by in situ measurements and can be used for quick field screening of potential contaminated soil contamination [3-6].
Previous studies indicated that PXRF analysis was capable of detecting soil trace elements similar to those detected by conventional laboratory methods [3,7,8]. Although PXRF will not replace laboratory techniques such as ICP-OES for high precision analyses, but it offers a number of distinct advantages including in situ measurements without pre-treatment and sampling, simultaneous analyses of a wide range of elements, rapid, nondestructive, increased total speed and throughput and accurate identification of many elements simultaneously [3,9,10].
However, several physico-chemical parameters of soil are known to affect the quality and the precision of PXRF reading, essentially sample matrix, surface irregularity, interfering elements, mineralogy, particle size and soil moisture [9,11-18].
Nevertheless in many previous PXRF studies on soil, moisture content has been considered as one of the most influential sources of error, especially when soil moisture content ranges between 40% [19]. Indeed, several authors have shown that water causes an exponential decrease in the intensity of X-rays which lead to a lower precision, poor detection limit and overall lower accuracy [13]. Essentially, water in soil acts as both an absorption layer and a scattering layer, produces an exponential decrease in effective X-ray penetration depth which leads to a lower precision of PXRF scanning [20].
Thus it’s necessary to assessment of precision and accuracy of PXRF for applications to provide results that may be used for a spatial distribution interpretation of trace elements contamination. Therefore certain method has been treated in the literature for correcting the moisture influence on wet soil analysis measured by PXRF [13,21].
Therefore, the aim of this study was to evaluate the influence of soil moisture on the PXRF scanning, in particular Ca, Mg, Cd, Cr, Cu, Ni, Zn, P, Fe, Mn and Pb concentration and apply a moisture correction equations to increase the accuracy of PXRF measurements.
2. MATERIALS AND METHODS 2.1. Field sampling and scanning
Field sampling was conducted from Cebala Borj Touil (North-east Tunisia) (Figure1). The perimeter covers a total area of 3139 ha and irrigated with treated wastewater (TWW) since 1989. The perimeter is irrigated by gravity method witch cause a prolonged stagnation of water in depressions plots, especially in areas where the aquifer flush. In this case, there is a risk of contamination of surface water with TWW.
Fig.1. Location of sampling sites in Cebala Borj Touil- Tunisia (Southwestern Tunisia)
A total of 60 soil samples were collected using a stratified random sampling design, from topsoil horizons (0-20cm) for scanning with PXRF under different moisture content conditions and for physicochemical lab analysis.
The soil samples were air-dried and sieved using a 2 mm mesh stainless steel sieve. Soil pH was determined with a pH electrode (Sen Tix 41 (WTW) PLUS) in 1:2.5 distilled water to soil extracts [22]. Electrical conductivity (EC) was also determined from saturated soil-paste with Therefore, the aim of this study was to evaluate the influence of soil moisture on the PXRF scanning, in particular Ca, Mg, Cd, Cr, Cu, Ni, Zn, P, Fe, Mn and Pb concentration and apply a moisture correction equations to increase the accuracy of PXRF measurements.
2. MATERIALS AND METHODS 2.1. Field sampling and scanning
Field sampling was conducted from Cebala Borj Touil (North-east Tunisia) (Figure1). The perimeter covers a total area of 3139 ha and irrigated with treated wastewater (TWW) since 1989. The perimeter is irrigated by gravity method witch cause a prolonged stagnation of water in depressions plots, especially in areas where the aquifer flush. In this case, there is a risk of contamination of surface water with TWW.
Fig.1. Location of sampling sites in Cebala Borj Touil- Tunisia (Southwestern Tunisia)
A total of 60 soil samples were collected using a stratified random sampling design, from topsoil horizons (0-20cm) for scanning with PXRF under different moisture content conditions and for physicochemical lab analysis.
The soil samples were air-dried and sieved using a 2 mm mesh stainless steel sieve. Soil pH was determined with a pH electrode (Sen Tix 41 (WTW) PLUS) in 1:2.5 distilled water to soil extracts [22]. Electrical conductivity (EC) was also determined from saturated soil-paste with
Tetra 325 electrode (WTW) according to U.S. Salinity Laboratory Staff [23]. Particle size distribution was determined following oxidation of organic matter with hydrogen peroxide, the upper fraction (down to 50 mm) being separated by sieving and the lower one used for subjection to the internationally endorsed procedure [24]. Organic matter (OM) content was determined by soil oxidation with potassium dichromate (K2Cr2O2) and concentrated H2SO4 [25]. Moisture content was determined by trace system soil moisture equipment TDR (Time Domain Reflectometry) with coated sensors (8 Cm).
For determining trace elements concentration in situ, the samples were scanned with PXRF under field moisture conditions. For laboratory analyses, all scannings were performed with PXRF on pressed pellets (Ø: 3cm). A portable Bruker S1 Titan 600 with calibration range of 37 elements, including light elements Mg, Al and Si was used for determining trace elements concentrations in soil samples. The analyser is characterized by fast SDD® detector and ShieldTM detector protecting the sensor window from being punctured by sharp objects under analysis. The analyser was equipped with X-ray tube Rh target operating at a maximum of 50 kV and five position motorized filter changer.
Portable XRF scanning for elemental quantification were chosen for the elements most common on wastewater eventually Ca, Mg, Cd, Cr, Cu, Ni, Zn, P, Fe, Mn and Pb [26]. Scanning was conducted for 30 s per beam, for a total of 60 s per scan.
To assess the influence of soil moisture on XRF signal absorption, the 60 soil samples were analysed by portable XRF with four conditions: in-situ scanning, dried soil at 105°C, 40% moisture content soil and saturated soil with distillated water in the sample cups.
2.2. Statistical analyses
Statistical analyses were performed using the software SPSS® for Windows version 20.0. Different measurements of XRF scanning were compared using simple regression to investigate the relationship between the concentrations obtained on dried soil and those measured on different soil treatments. The regression equation, coefficient of determination (R2), slope and root mean square error (RMSE) were calculated to compare differences between soil treatments. RMSE was calculated by:
Xai and Xbi are the XRF measurements of ith sample with treatments a and b, and n is the total number of XRF measurements on the samples with both treatments.
The X-ray intensities emitted from the elements in the wet samples (dIx) decrease with increasing water content in the soil sample (dw) due to the X-ray absorption effect of the interstitial water. Equation 2 shows the following relation:
d = −μ
Ge et al. [13] proposed a model for the correction of soil moisture on PXRF measurement based on Lambert-Beer law that the reduction in X-ray intensity is proportional to the increment of water content of the sample:
Cwet Cdry =
where Cwet is the PXRF elemental concentration with a water content ω, Cdry is the PXRF elemental concentration in the dry sample, and σ is the attenuation coefficient due to soil moisture.
3. RESULTS AND DISCUSSION
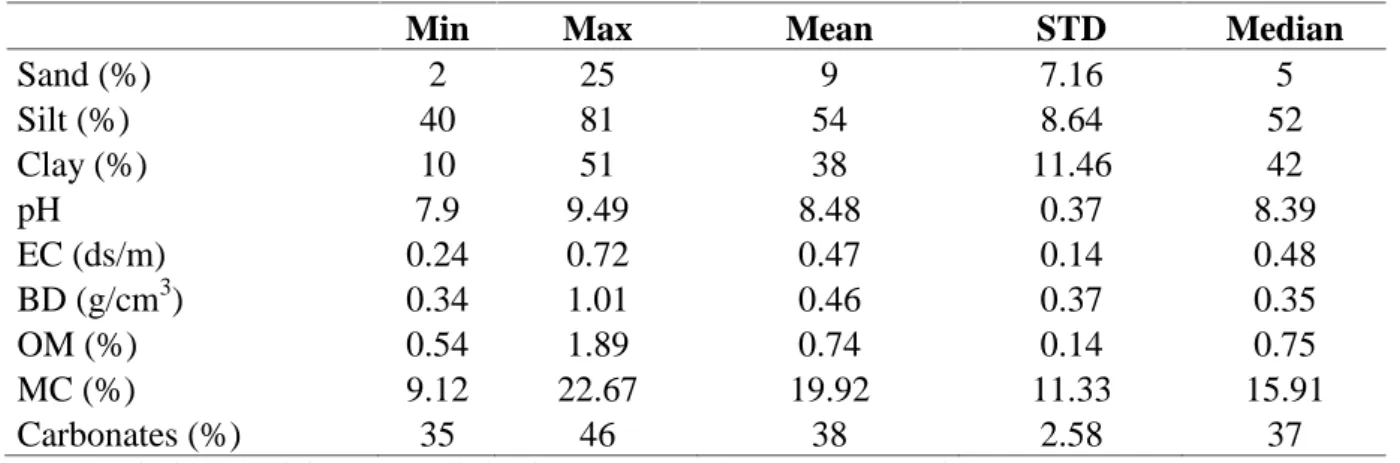
Descriptive statistics for physico-chemical soil characteristics of analyzed samples were summarized in Table 1. Soil texture estimated to be Silty Clay Loam according to soil textural triangle [27]. The pH did not vary much and was basic (7.90–9.49), which suggests alkaline conditions for all the soil samples. Bulk density and EC showed limited variation. Organic matter content in the soils varied slightly from 0.54% to 1.89%. Soil moisture content was highly variable between 9.12% in dry areas and 22.67% in irrigated areas. Carbonates vary slightly between 35 and 46%. Summarily the soil samples possessed a limited range of physicochemical characteristics which minimize their effect on PXRF scanning accuracy. Table 1. Basic statistics of physicochemical properties of Cebala Borj Touil soils
Min Max Mean STD Median
Sand (%) 2 25 9 7.16 5 Silt (%) 40 81 54 8.64 52 Clay (%) 10 51 38 11.46 42 pH 7.9 9.49 8.48 0.37 8.39 EC (ds/m) 0.24 0.72 0.47 0.14 0.48 BD (g/cm3) 0.34 1.01 0.46 0.37 0.35 OM (%) 0.54 1.89 0.74 0.14 0.75 MC (%) 9.12 22.67 19.92 11.33 15.91 Carbonates (%) 35 46 38 2.58 37
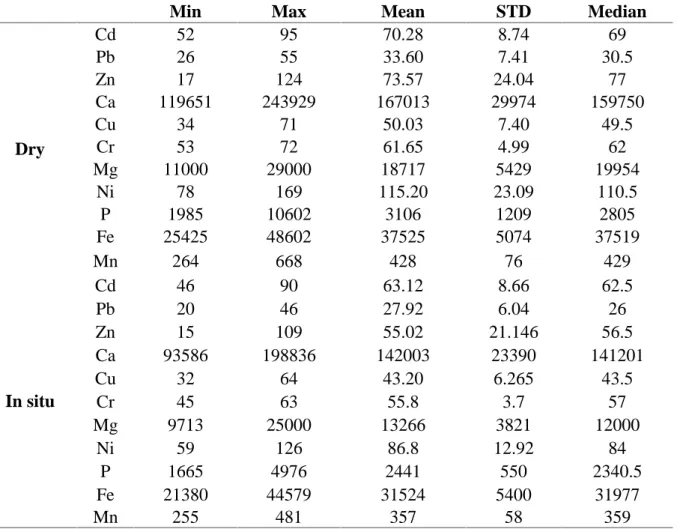
Table 2 summarizes the basic statistics of the investigated trace elements. The PXRF concentrations decreased with increasing water content in soil samples for all studied elements. In fact, standard deviation and CV of the measurements are relatively different particularly between dry soil samples and saturated soil samples for the majority of the elements. Previous researches on the effect of water on XRF scanning have found similar results [9,13-15,18,19].
Variation created an ambiguity in the diagnosis of trace elements concentrations in the studied site between samples of different moisture. For this reason PXRF concentrations in non-dried samples were fitted using the Lambert-Beer equation (Equation 3, Table 3).
Table 2. Basic statistics of trace elements (mg kg-1) in soils of Cebala (n=60)
Min Max Mean STD Median
Dry Cd 52 95 70.28 8.74 69 Pb 26 55 33.60 7.41 30.5 Zn 17 124 73.57 24.04 77 Ca 119651 243929 167013 29974 159750 Cu 34 71 50.03 7.40 49.5 Cr 53 72 61.65 4.99 62 Mg 11000 29000 18717 5429 19954 Ni 78 169 115.20 23.09 110.5 P 1985 10602 3106 1209 2805 Fe 25425 48602 37525 5074 37519 Mn 264 668 428 76 429 In situ Cd 46 90 63.12 8.66 62.5 Pb 20 46 27.92 6.04 26 Zn 15 109 55.02 21.146 56.5 Ca 93586 198836 142003 23390 141201 Cu 32 64 43.20 6.265 43.5 Cr 45 63 55.8 3.7 57 Mg 9713 25000 13266 3821 12000 Ni 59 126 86.8 12.92 84 P 1665 4976 2441 550 2340.5 Fe 21380 44579 31524 5400 31977 Mn 255 481 357 58 359
(Continued) 40% Cd 33 72 53 7 54 Pb 18 42 24 5 23 Zn 15 89 40.17 20 42 Ca 93570 174779 121921 20217 117146 Cu 15 61 37.7 8 38 Cr 43 54 48.7 3 50 Mg 9131 22495 10969 1848 11000 Ni 49 94 70.35 11.8 70 P 1410 3748 2039 424 2015 Fe 17341 38524 26365 4438 25929 Mn 187 432 299 53 293 Saturated Cd 22 67 47.4 7.4 49 Pb 15 33 20.4 3.7 20 Zn 13 80 26 16.1 17 Ca 43387 137697 95103 22128 94568 Cu 13 54 29.4 9.8 31.5 Cr 27 51 41.75 5.1 41.5 Mg 3442 12000 8874 1802 9211 Ni 20 65 41.72 15 48.5 P 781 2406 1552 352 1539 Fe 10260 31472 21448.23 4882 20376 Mn 74 362 235 55 230
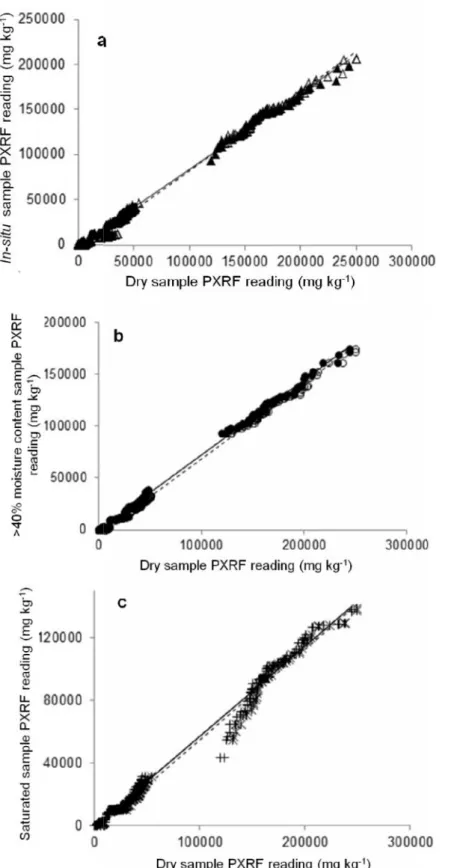
The influence of water content on the PXRF measurements and corrected regression equations were presented in Table 3 and figure 2. The PXRF readings were correlated more closely with in-situ samples and 40% moisture content samples with similar R2 values and thus had nominal effects on PXRF accuracy.
Nevertheless PXRF readings were significantly underestimated with saturated samples compared to the readings on dry samples. Correspondingly, moisture-corrected sample PXRF readings provided better correlation to PXRF scans of the dry soil samples as indicated by higher R2 values, lower RMSE, and slopes closer to 1 in the regression equations for in-situ samples and 40% moisture content samples (Table 3).
Fig. 2. PXRF readings on soil samples from Cebala Borj Touil under different conditions: in-situ vs. dry (a), 40% moisture content sample vs. dry (b) and Saturated vs. dry (c).
Coefficients in this study were slightly higher than those of Radu and Diamond [3] and Laiho and Perämäki [19]. This is mainly because soils in the study area had lower trace elements Fig. 2. PXRF readings on soil samples from Cebala Borj Touil under different conditions: in-situ vs. dry (a), 40% moisture content sample vs. dry (b) and Saturated vs. dry (c).
Coefficients in this study were slightly higher than those of Radu and Diamond [3] and Laiho and Perämäki [19]. This is mainly because soils in the study area had lower trace elements Fig. 2. PXRF readings on soil samples from Cebala Borj Touil under different conditions: in-situ vs. dry (a), 40% moisture content sample vs. dry (b) and Saturated vs. dry (c).
Coefficients in this study were slightly higher than those of Radu and Diamond [3] and Laiho and Perämäki [19]. This is mainly because soils in the study area had lower trace elements
distribution variation. Furthermore, these results are consistent with previous findings of Piorek [28] and Laiho and Peramaki [19] for PXRF analysis in 5%–40% moisture soils and showed that soil moisture of >20% caused nominal errors to PXRF elemental measurements and can safely be neglected. In addition, Weindorf et al. [9] noted that even for soil with < 40% moisture contents caused fluorescence denudation and thus a significant amount of variance in PXRF readings.
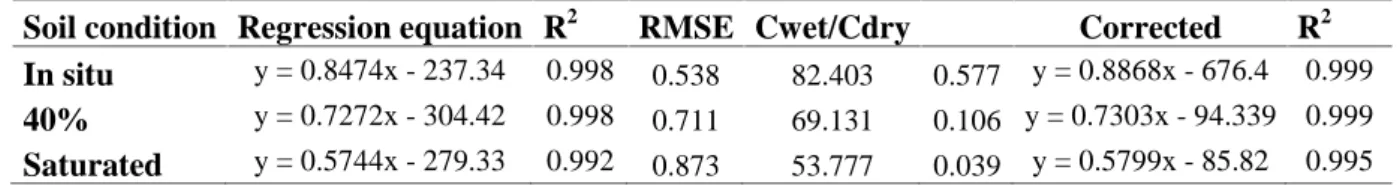
Table 3. Correlation parameters of portable XRF measurements on soil samples under different conditions (Y) with scanning on in-situ samples, 40% moisture content samples, and saturated samples (X) from Cebala Borj Touil
Soil condition Regression equation R2 RMSE Cwet/Cdry σ Corrected R2
In situ y = 0.8474x - 237.34 0.998 0.538 82.403 0.577 y = 0.8868x - 676.4 0.999
40% y = 0.7272x - 304.42 0.998 0.711 69.131 0.106 y = 0.7303x - 94.339 0.999
Saturated y = 0.5744x - 279.33 0.992 0.873 53.777 0.039 y = 0.5799x - 85.82 0.995
As described by Ge et al. [13] the deviations of the PXRF -scan to the dry scan readings are caused by the decreasing of the intensity of characteristic x-rays of analytes as the interstitial water of the sample increases owing to the stronger x-ray absorption by water than by air in fractures and macropores in soil samples.
Also Weindorf et al. [9] noted that when the moisture content of the soil exceeded its field capacity, the pressure inserted by the contact of PXRF during the scanning process could induce the release of interstitial water from macro pores, which might subsequently form a layer of water between the soil and the scanning window of the PXRF. When soil water content was high, a noticeable layer of water covering the window was often observed after the scanning was completed which leads to a lower precision, poorer detection limit and lower accuracy.
In order to further analyze the moisture content effect on PXRF scanning, the measurements under the same scanning conditions of the samples were plotted against scans on dry samples for each element (Table 4, Figure 3). Even at the higher moisture contents in saturated samples, the PXRF was capable of measuring all studied trace elements concentrations in the samples and there is a linear relationship between these concentrations and the moisture content (Figure 3). However, for the scans on the saturated samples, PXRF underestimated almost all the elements owing to moisture, exhibiting a poor relationship with dry scans by the low slopes in the regression equations (ranging from 0.539 for Mg to 0.898 for Cd (Table 4)).
Only Ca, Cr, Fe and Mn showed a significantly close correlation between saturated and dry sample scans (R2≥ 0.905). Furthermore, the RMSE values of the saturated against dry sample scans were always the highest for all elements.
Most elements of the scans in-situ samples acceptably compared to dry sample scans, with R2 values ranging from 0.791 for Mg to 0.984 for Ca. However, underestimation of the scans on 40% moisture content samples was still quite apparent, as the regression slopes varied between 0.621 for Mg and 0.974 for Ca.
The improved quality of the PXRF-scan data, corrected with Equation 2, is clearly expressed by higher correlation coefficients for almost all elements (Table 3, Figure 3). In fact, after moisture correction using Lambert-Beer equation, R2 values increased more or less and the slopes in the regression equations shifted much closer to 1, although the RMSE values of some elements slightly increased.
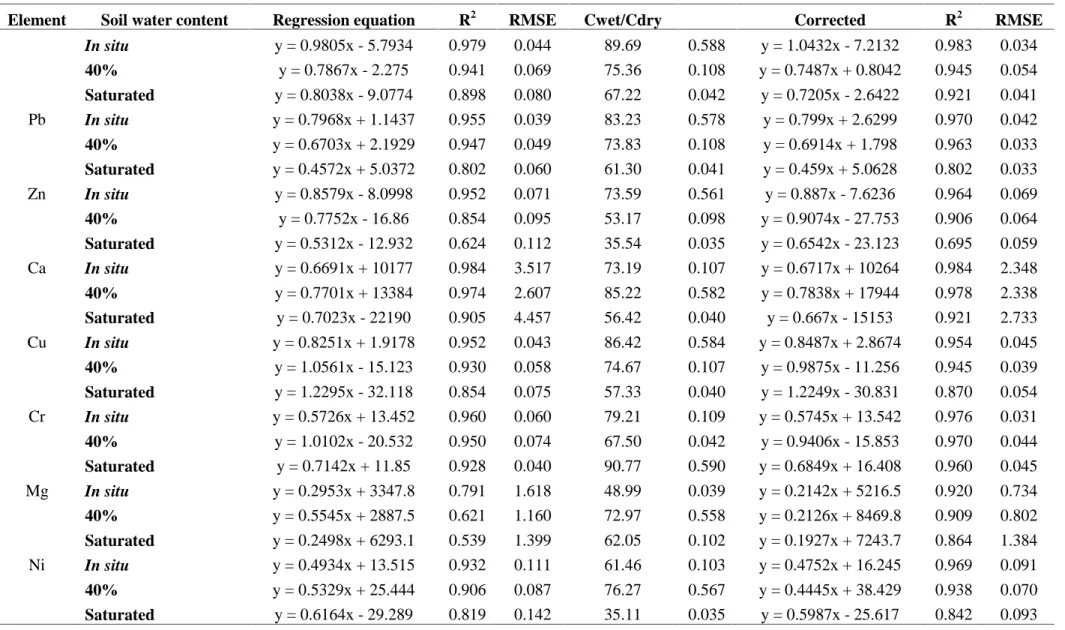
Table 4. PXRF readings of each element under different moisture content conditions vs. readings on dried samples
Element Soil water content Regression equation R2 RMSE Cwet/Cdry σ Corrected R2 RMSE
In situ y = 0.9805x - 5.7934 0.979 0.044 89.69 0.588 y = 1.0432x - 7.2132 0.983 0.034 40% y = 0.7867x - 2.275 0.941 0.069 75.36 0.108 y = 0.7487x + 0.8042 0.945 0.054 Saturated y = 0.8038x - 9.0774 0.898 0.080 67.22 0.042 y = 0.7205x - 2.6422 0.921 0.041 Pb In situ y = 0.7968x + 1.1437 0.955 0.039 83.23 0.578 y = 0.799x + 2.6299 0.970 0.042 40% y = 0.6703x + 2.1929 0.947 0.049 73.83 0.108 y = 0.6914x + 1.798 0.963 0.033 Saturated y = 0.4572x + 5.0372 0.802 0.060 61.30 0.041 y = 0.459x + 5.0628 0.802 0.033 Zn In situ y = 0.8579x - 8.0998 0.952 0.071 73.59 0.561 y = 0.887x - 7.6236 0.964 0.069 40% y = 0.7752x - 16.86 0.854 0.095 53.17 0.098 y = 0.9074x - 27.753 0.906 0.064 Saturated y = 0.5312x - 12.932 0.624 0.112 35.54 0.035 y = 0.6542x - 23.123 0.695 0.059 Ca In situ y = 0.6691x + 10177 0.984 3.517 73.19 0.107 y = 0.6717x + 10264 0.984 2.348 40% y = 0.7701x + 13384 0.974 2.607 85.22 0.582 y = 0.7838x + 17944 0.978 2.338 Saturated y = 0.7023x - 22190 0.905 4.457 56.42 0.040 y = 0.667x - 15153 0.921 2.733 Cu In situ y = 0.8251x + 1.9178 0.952 0.043 86.42 0.584 y = 0.8487x + 2.8674 0.954 0.045 40% y = 1.0561x - 15.123 0.930 0.058 74.67 0.107 y = 0.9875x - 11.256 0.945 0.039 Saturated y = 1.2295x - 32.118 0.854 0.075 57.33 0.040 y = 1.2249x - 30.831 0.870 0.054 Cr In situ y = 0.5726x + 13.452 0.960 0.060 79.21 0.109 y = 0.5745x + 13.542 0.976 0.031 40% y = 1.0102x - 20.532 0.950 0.074 67.50 0.042 y = 0.9406x - 15.853 0.970 0.044 Saturated y = 0.7142x + 11.85 0.928 0.040 90.77 0.590 y = 0.6849x + 16.408 0.960 0.045 Mg In situ y = 0.2953x + 3347.8 0.791 1.618 48.99 0.039 y = 0.2142x + 5216.5 0.920 0.734 40% y = 0.5545x + 2887.5 0.621 1.160 72.97 0.558 y = 0.2126x + 8469.8 0.909 0.802 Saturated y = 0.2498x + 6293.1 0.539 1.399 62.05 0.102 y = 0.1927x + 7243.7 0.864 1.384 Ni In situ y = 0.4934x + 13.515 0.932 0.111 61.46 0.103 y = 0.4752x + 16.245 0.969 0.091 40% y = 0.5329x + 25.444 0.906 0.087 76.27 0.567 y = 0.4445x + 38.429 0.938 0.070 Saturated y = 0.6164x - 29.289 0.819 0.142 35.11 0.035 y = 0.5987x - 25.617 0.842 0.093
(Continued) P In situ y = 0.4255x + 1119.9 0.875 0.405 80.84 0.575 y = 0.6212x + 655.42 0.915 0.372 40% y = 0.315x + 1061.4 0.806 0.526 67.63 0.105 y = 0.4871x + 568.02 0.915 0.335 Saturated y = 0.2257x + 851 0.599 0.643 51.23 0.039 y = 0.5328x - 25.656 0.898 0.386 Fe In situ y = 0.9441x - 13980 0.963 2.112 56.47 0.040 y = 0.9347x - 13583 0.968 1.204 40% y = 0.8556x - 5742.2 0.957 1.758 70.01 0.106 y = 0.8155x - 4242.8 0.964 1.250 Saturated y = 1.0369x - 7387.4 0.949 1.285 83.67 0.579 y = 1.1629x - 10862 0.956 1.188 Mn In situ y = 0.6856x + 5.457 0.963 0.189 69.86 0.106 y = 0.7483x - 18.589 0.974 0.129 40% y = 0.6984x - 63.625 0.936 0.231 54.44 0.040 y = 0.7999x - 104.49 0.972 0.134 Saturated y = 0.7413x + 40 0.934 0.138 83.77 0.580 y = 0.8672x + 4.6192 0.958 0.143
Attenuation coefficient σ for each element was determined using the simple regression equations based on the Lambert-Beer law based on the ratio Cwet/Cdry (Table 4). These coefficients are indicators of the moisture content influence on the PXRF elemental concentrations. A high σ value for a given element indicates that an increase in moisture content produced an underestimation in PXRF measurements.
The PXRF measurements of Cr, Fe and Mn were the most affected by saturation of soil samples (Table 3, Figure 3). Their σ values were highest in saturated samples with 0.590, 0.579 and 0.580, respectively. Whilst the σ values for Ca, Mg and Ni for 40% moisture content samples were 0.582, 0.558 and 0.567 indicating that at such moisture content caused an underestimated scanning for these elements. Notably σ values for Cd, Pb, Zn, Cu and P were highest in less moisture content (in-situ samples) indicating that PXRF scanning were affected even at low water content. Results are not in covenant with previous studies that showed that the attenuation coefficient σ associated with an increase in moisture content was greater for lighter elements and with atomic number below Z=40 or 26 [13-15,19,29]. Indeed, moisture content affected PXRF scanning differently for each element.
S am p le s P X R F r ea d ing (m g kg -1 )
Dry sample PXRF reading (mg kg-1)
Fig.3. PXRF elemental readings for soils samples under different conditions.
S am p le s P X R F r ea d ing (m g kg -1 )
Dry sample PXRF reading (mg kg-1)
Fig.3. PXRF elemental readings for soils samples under different conditions.
S am p le s P X R F r ea d ing (m g kg -1 )
Dry sample PXRF reading (mg kg-1)
4. CONCLUSION
For each element, an increase in soil moisture content caused a significant decrease in FPXRF concentrations. Each applied moisture content, PXRF measurements presented an underestimation scanning for some elements. Cr, Fe and Mn were the most affected by saturation of soil samples, whereas from 40% moisture content Ca, Mg and Ni scanning were underestimated. While the decrease in Cd, Pb, Zn, Cu and P concentrations were more pronounced in the in-situ samples moisture content. Application of Lambert-Beer law significantly improved the error produced by the water influence moisture content and corrected PXRF measurements corresponded much better to the PXRF measurements in dry soils and thus might gradually substitute conventional laboratory methods for the analysis of soil samples. Results of this study could be adopted as a rapid methodology for screening trace elements pollution in irrigated perimeters suffering from water stagnation.
5. ACKNOWLEDGEMENTS
This study was carried out under the INRGREF/ACSADICBA project for the safe reuse of TWW in Arab agriculture and PISEAU II project for TWW and Sludge use in agriculture. 6. REFERENCES
[1] McLaren T I, Guppy C N, Tighe M K, Forster N, Grave P, Lisle L M and Bennett J W. Rapid, nondestructive total elemental analysis of vertisol soils using portable X-ray fluorescence. Soil. Sci. Soc. Am. J., 2012, 76, 1436–1445
[2] Weindorf D C, Zhu Y D, Chakraborty S, Bakr N and Huang B A. Use of portable X-ray fluorescence spectrometry for environmental quality assessment of peri-urban agriculture. Environ. Monit. Assess., 2012, 184, 217–227
[3] Radu T, Diamond D. Comparison of soil pollution concentrations determined using AAS and portable XRF techniques. J. Hazard. Mater., 2009, 171, 1168–1171
[4] Gardner D, Weindorf D C and Flynn M. Presence of chromium, copper, and arsenic in schoolyard soils. Soil. Horiz., 2013, 54, 1–5
[5] Weindorf D C, Paulette L and Man T. In-situ assessment of metal contamination via portable x-ray fluorescence spectroscopy: Zlatna, Romania. Environ. Pollut., 2013, 182, 92– 100
[6] Hu W, Huang B, Weindorf D C and Chen, Y. Metals analysis of agricultural soils via portable x-ray fluorescence spectrometry, B. Environ. Contam. Tox., 2014, 92, 420–426
[7] Kilbride C, Poole J and Hutchings T. A comparison of Cu, Pb, As, Cd, Zn, Fe, Ni and Mn determined by acid extraction/ICP-OES and ex situ field portable X-ray fluorescence analyses. Environ. Pollut., 2006, 143, 16–23
[8] Laperche V, Billaud P. The use of portable fluorescence X for the environmental hazard assessment of mining sites: example on the lead mining site at Pont-Péant France, in Post-Mining Symposium, Nancy, France, 2008
[9] Weindorf D C, Bakr N, Zhu Y, Mcwhirt A, Ping C L, Michaelson G, Nelson C, Shook K and Nuss S. Influence of ice on soil elemental characterization via portable X-ray fluorescence spectrometry. Pedosphere., 2014, 24, 1–12
[10] Ulmanu M, Anger I, Gament E, Mihalache M, Plopeanu G and Ilie L. Rapid determination of some heavy metals in soil using an x-ray fluorescence portable instrument. Res. J. Agric. Sci., 2011, 43, 235–241
[11] Kalnicky D J, Singhvi R. Field portable XRF analysis of environmental samples. J. Hazard. Mater., 2001, 83, 93–122
[12] Laperche V. Evaluation des performances du spectromètre portable de fluorescence X Niton XL723S (au laboratoire et sur le terrain), BRGM Report 53377-FR, Orléans, 2005 [13] Ge L, Lai W and Lin Y. Influence of and correction for moisture in rocks, soils and sediments on in situ XRF analysis. X-Ray. Spectrom., 2005, 34, 28–34
[14] Kido Y, Koshikawa T and Tada R. Rapid and quantitative major element analysis method for wet fin-grained sediments using an XRF microscanner. Mar. Geol., 2006, 229, 209–225
[15] Tjallingii R, Röhl U, Kölling M and Bickert T. Influence of the water content on X‐ray fluorescence core‐scanning measurements in soft marine sediments. Geochem. Geophys. Geosyst., 2007, 8, 1-12
[16] Binstock D A, Gutknecht W and McWilliams A. Lead in soil by field portable X-ray fluorescence spectrometry, an examination of paired in situ and laboratory ICPAES results. Remediat. J., 2008, 18, 55–61
[17] Markowicz A A. Quantification and correction procedures. In: Potts PJ, West M (eds) Portable X-ray fluorescence spectrometry: capabilities for in situ analysis. The Royal Society of Chemistry, Cambridge, 2008, 13–38
[18] Parsons C, Grabulosa E M, Pili E, Floor G H, Roman-Ross G and Charlet L. Quantification of trace arsenic in soils by field-portable X-ray fluorescence spectrometry:
considerations for sample preparation and measurement conditions. J. Hazard. Mater., 2013, 262, 1213–1222
[19] Laiho J V P, Peramaki P. Evaluation of portable Xray fluorescence (PXRF) sample preparation methods. Geol. Surv. Finland. Spec. Pap., 2005, 38, 73–82
[20] Palmer P T, Jacobs R, Baker P E, Ferguson K and Webber S. Use of field-portable XRF analyzers for rapid screening of toxic elements in FDA-regulated products. J. Agr. Food. Chem., 2009, 57, 2605–2613
[21] Bastos R O, Melquiades F L and Biasi G E V. Correction for the effect of soil moisture on in situ XRF analysis using low-energy background. X-Ray. Spectrom., 2012, 41, 304–307
[22] Guitian F, Carballas T. Técnicas de Análisis de Suelos. (In Spanish)., Ed. Pico Sacro, Santiago de Compostela, Spain, 1976
[23] US Salinity Laboratory Staff. Diagnosis and improvement of saline and alkaline soils. USDA Handbook 60. U.S. Government Printing Office, Washington DC, USA., 1954, 1–160 [24] Kroetsch D, Wang C. Particle size distribution. In: Carter MR, Gregorich EG. Soil Sampling and Methods of Analysis (2nd ed.). Canadian Society of Soil Science, CRC Press, Boca Raton, FL., 2008, 713–726
[25] Walkley A, Black I A. An examination of Degtjareff method for determining soil organic matter and a proposed modification of the chromic titration method. Soil. Science., 1934, 34, 29–38
[26] Wang Z, Chang A C, Wu L and Crowley D. Assessing the soil quality of long-term reclaimed wastewater-irrigated cropland. Geoderma., 2003, 114, 261-278
[27] Folk R L. Petrology of sedimentary rocks. Hemphill Publishing Co., Texas, 1980 [28] Piorek S. Determination of metals in soils by field-portable XRF spectrometry. In Lopez-Avila, V. et al. (eds.) Current Protocols in Field Analytical Chemistry. John Wiley and Sons, Hoboken, USA., 1998, 3B.1.1–3B.1.18
[29] Ge L, Zhang Y, Cheng Y S, Zhou S C, Xie T Z and Hou S L. Proposed correction and influence of drilling fluids in X-ray fluorescence logging. X-ray. Spectrom., 1997, 26, 303–308.
How to cite this article:
Sahraoui H, Hachicha M. Effect of soil moisture on trace elements concentrations using portable x-ray fluorescence spectrometer .J. Fundam. Appl. Sci., 2017, 9(1), 468-484.