Titre:
Title:
Stability Evaluation of Overtopped Concrete Hydraulic Structures Using Computational Fluid Dynamics
Auteurs:
Authors: Mario Freitas, Etienne Favre, Pierre Léger et Lineu José Pedroso
Date: 2020
Type: Article de revue / Journal article
Référence:
Citation:
Freitas, M., Favre, E., Léger, P. & Pedroso, L. J. (2020). Stability Evaluation of Overtopped Concrete Hydraulic Structures Using Computational Fluid Dynamics. Canadian Journal of Civil Engineering. doi:10.1139/cjce-2019-0287
Document en libre accès dans PolyPublie
Open Access document in PolyPublie
URL de PolyPublie:
PolyPublie URL: https://publications.polymtl.ca/4209/
Version: Version finale avant publication / Accepted version Révisé par les pairs / Refereed Conditions d’utilisation:
Terms of Use: Tous droits réservés / All rights reserved Document publié chez l’éditeur officiel
Document issued by the official publisher
Titre de la revue:
Journal Title: Canadian Journal of Civil Engineering Maison d’édition:
Publisher: Sciences Canada URL officiel:
Official URL: https://doi.org/10.1139/cjce-2019-0287 Mention légale:
Legal notice:
Ce fichier a été téléchargé à partir de PolyPublie, le dépôt institutionnel de Polytechnique Montréal
This file has been downloaded from PolyPublie, the institutional repository of Polytechnique Montréal
Stability Evaluation of Overtopped Hydraulic Structures using CFD
Mario Freitas1, Étienne Favre2, Pierre Léger3, Lineu José Pedroso4
Abstract: A particularly challenging aspect in gravity dam stability assessment is the estimation of the induced hydrodynamic water pressure when water with significant velocity is overtopping gravity dams and flowing in or over spillway components. The water flow conditions, including the related pressure fields and resultant forces, are difficult to quantify accurately. Herein, existing dam safety guidelines to estimate the weight of the overflowing water nappe on gravity dams with rectangular crests are first reviewed. Then, a CFD methodology is developed to improve the simplified estimation of hydrodynamic pressure fields acting on the rectangular crests of submerged gravity dams. The CFD pressures are used as input data to classical structural stability analyses based on the gravity method to more adequately quantify the dam stability during overtopping. A back analysis is also performed on the stability of an existing gated spillway that was overtopped during the 1996 Saguenay flood in Québec.
Keywords: CFD, Overtopping, Stability, Gravity dam, Gated Spillways
Résumé : L’estimation des pressions hydrodynamiques induites lorsque l’eau à grande vitesse submerge les barrages-poids et les évacuateurs de crues constitue un aspect particulièrement difficile de l’évaluation de la stabilité de ces ouvrages. La dynamique des fluides numérique (CFD) est une alternative attrayante aux modèles physiques pour quantifier les forces hydrodynamiques agissant sur les ouvrages-poids. Dans cet article, les ligne directrices sur la sécurité des barrages pour estimer le poids de la nappe d’eau submergeant les barrages-poids à crête rectangulaire sont tout d’abord examinées. Ensuite, une méthodologie CFD est développée pour améliorer l'estimation simplifiée des champs de pression hydrodynamiques agissant sur les crêtes rectangulaires des ouvrages soumis à la submersion. Les pressions CFD sont utilisées comme données d'entrée dans les analyses de stabilité structurales classiques, basées sur la méthode de la gravité, afin de quantifier de manière plus adéquate la stabilité au glissement des barrages lors d'une submersion. Un retour d’expérience est également effectué sur la stabilité d'un évacuateur vanné, qui a été submergé lors de la crue du Saguenay en 1996.
Mots clés : CFD, Submersion, Stabilité, barrage-poids, évacuateurs de crues
1Graduate Student, Department of Civil and Environmental Engineering, University of Brasília, Campus Darcy Ribeiro, Brasília-DF, 70919-970, Brazil. Email: [email protected]
2Graduate Student, Dept. of Civil, Geological, and Mining Engineering, École Polytechnique, P.O. Box 6079, Station CV, Montréal, Québec, Canada, H3C 3A7. E-mail: [email protected]
3Professor, Dept. of Civil, Geological, and Mining Engineering, École Polytechnique, P.O. Box 6079, Station CV, Montréal, Québec, Canada, H3C 3A7 (corresponding author). E-mail:
[email protected], Phone: (514) 340-4711 (ext. 3712), Fax: (514) 340-588
4Professor, Department of Civil and Environmental Engineering, University of Brasília, Campus Darcy Ribeiro, Brasília-DF, 70919-970, Brazil. Email: [email protected]
1. Introduction
Extreme floods are one of the most significant threats to dam structural stability. During a major flood or an unexpected hydrologic event, dam overtopping may occur (Fig. 1). The increase in extreme floods experienced worldwide, influenced by global warming and the growing demand from societies regarding the reduction of imposed risks require improving the structural stability predictions for gravity dams and spillways during major floods. Overtopping increases the hydrodynamic thrust on structural components and causes erosion, possibly leading to failure, posing a risk of loss of life and extensively damaging downstream structures (Vogel et al. 2015). ICOLD (1995) indicates that overtopping is one of the main causes of failure for gravity dams, more precisely, 43% of masonry dams and 20% of concrete dams.
Overtopping could also affect non-overflow gravity dam sections with flat crests that will then be subjected to stabilizing or destabilizing forces of unknown magnitude and for which there is no validated or verified guidance in the existing dam safety guidelines (USBR 1987; USACE 1995; CDA 2013; FERC 2016). FERC (1991) presented a computational stability example in the Appendix of an overtopped gravity dam which estimates the stabilizing vertical nappe pressure field on the crest as being trapezoidal. However, it was also noted in FERC (1991) that "the
pressure distribution on the crest has been assumed, actual distribution may vary". This last
comment motivated our research to use CFD to provide validated recommendations to the profession to define the magnitude of the vertical nappe force resultant and its location on the crest of typical gravity dams.
Dam stability evaluation is based on identifying failure mechanisms. For gravity dams, several failure modes can occur in the case of overtopping during extreme floods (Fig. 1a). To evaluate structural stability with confidence, the accurate determination of water flow velocity, related
pressure fields and force resultants acting on concrete dams and spillways poses major challenges. For example, Fig. 1b illustrates a spillway overtopping during the 1996 Saguenay flood in Quebec (Canada), which, as well as several other cases, has highlighted the need for a better estimation of the stabilizing and destabilizing forces acting on gravity dams and spillways during flood overtopping (Léger et al. 1998).
In recent years, CFD (Computational Fluid Dynamics), which allows the numerical computation of fluid flow characteristics around structures, has become more common in various fields of engineering. Advances in CFD have made it an attractive alternative in terms of cost and time to physical models that were, until recently, the only tools available to study the hydrodynamic effects on overtopped structures. Spillways are essential for safety and to provide sufficient flow discharge capacity during floods; water flows over many standard types of spillway sections have been widely modelled by CFD (Olsen and Kjellesvig 1998; Haun et al. 2011). Numerical results have shown good agreement with experimental data. Moreover, CFD simulations have been performed to model water flow on specific spillways with complex geometries (Ho and Riddette 2010; Willey et al. 2012; Naderi Rad 2016). CFD has also been used to determine, with improved accuracy, the pressures and forces acting on the Wanapum spillway to perform structural stability calculations (Griffith et al. 2007). The authors concluded that the standard stability analysis approach may underestimate the sliding safety factor (SSF) by 40-50% in comparison to the stability results based on CFD water pressures. In the present paper, ANSYS Fluent (ANSYS 2018), a CFD software, is used to estimate the hydrodynamic forces on hydraulic structures. Then, stability analyses are performed with the gravity method. The software CADAM3D (Leclerc and Léger, 2017), a 3D version of CADAM (Leclerc et al, 2003) is used to perform the stability analyses.
2. CFD Modelling and Simulation
2.1. Governing Equations and Computational Tools
Computational fluid dynamics (CFD) consists of a series of methods and techniques used to solve fluid flow problems numerically. Fluid flow problems are governed by Navier-Stokes and continuity equations. Assuming an incompressible and isothermal fluid, these equations can be written as (Jasak 1996):
∇ ⋅ 𝒖 = 0 (1)
∂𝒖
∂𝑡 + ∇ ⋅ (𝒖𝒖) = ―∇𝑝 + ∇ ⋅ (𝜈∇𝒖) + 𝒈 (2)
where is the fluid velocity vector, is the pressure, is the kinematic viscosity, is the 𝑢 𝑝 𝜈 𝑔 gravitational acceleration and is the time.𝑡
The continuity and Navier-Stokes equations are enough to describe single-phase flows, but for biphasic flows (air-water), a multiphase model is also needed to locate the interface position. The Volume of Fluid model (VOF), introduced by Hirt and Nichols (1981) is used herein. The VOF model works by tracking the motion of fluid masses and determining the water volume fraction in each mesh cell. By calculating the volume fractions, it is possible to compute the percentages 𝛼𝑤
of air and water in each cell. These values are used to perform a weighted average of the fluid properties, such as density and viscosity. Those averages are used in formulation and solution of the Navier-Stokes equations.
In flows over dams and spillways, the vertical fluid acceleration on the downstream section and the possible hydraulic jump formation generates a significant amount of turbulence. Therefore, in addition to governing equations and the VOF model, a turbulence model is needed to determine the complex and erratic changes in pressures and velocities in open-channel flow systems. The shear stress transport (SST) k- model, developed by Menter (1993), is selected because of its 𝜔
efficiency in the freestream region and in the boundary layer region, achieving a good level of accuracy with relatively small computational cost.
2.2. Boundary Conditions
The selection of the boundary conditions in a CFD problem is a challenging step that deserves some discussion. In our CFD modelling and simulation of overtopped hydraulic structures, the upstream boundary is set as a mass-flow inlet, and the downstream and upper boundaries are set as pressure outlets. The boundaries corresponding to the floor and structures are set as no-slip walls. All studied 3D models are symmetrical, so only half of the geometry is modelled, and a symmetry boundary condition is set in the symmetry plane. The vertical boundaries parallel to the symmetry plane are set as slip walls. This is necessary because the downstream portion of the domain is broadened to allow for aeration of the overflowing nappe.
In addition, the open channel option present in Fluent is enabled. This option allows the specification of the inlet water level. Fluent then computes the related inlet pressure. With this option enabled, the pressure in the outlets can be determined (i) by specifying the tailwater level, (ii) by interpolation from the neighbouring cells, or (iii) by specifying a gauge pressure. On the downstream boundary, the pressure is computed from the neighbouring cells; along the upper boundary, it is set to the atmospheric pressure. An extensive validation study of the computer models used in this work, including domain and mesh convergence studies and aeration strategies for open-channel flow, are presented in Freitas (2019).
3. Evaluation of Overtopping on Rectangular Crests
3.1. Rectangular Crest Analysed
The overtopping of rectangular sections is considered to represent the crest of a gravity dam and to study the vertical force on the crest using CFD models. Figure 2a shows the computational model used in this section. To quantify the overtopping pressure acting on gravity dam rectangular crests, three CFD models are developed with a 5 m height and 2.5 m, 3.75 m and 5 m crest widths B and mesh size of 0.1 m. Three overtopping levels are modelled for each crest width. Using the computed CFD pressures, the resultant vertical force magnitude and position are evaluated. The results are summarized in Table 1.
3.2. CFD Comparisons with Dam Safety Guidelines
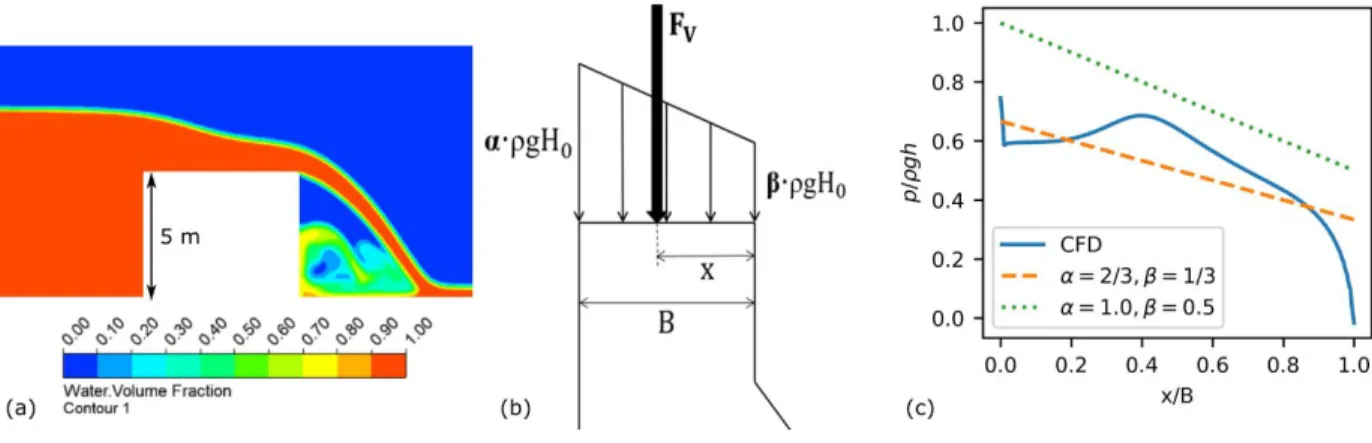
In dam stability assessment, water pressures on gravity dam crests are usually neglected because of their small magnitude for small overtopping heights (USACE 1995; FERC 2016). This assumption is conservative due to the stabilizing effect of the positive vertical pressure on the crest, as shown in Fig. 2c. A common rule of thumb used to estimate the overtopping pressure is shown in Fig. 2b (FERC 1991 Appendix - sample calculation of overtopped gravity dam). The pressure field is estimated to be trapezoidal. The magnitude of the upstream pressure is taken as 𝛼𝜌𝑔𝐻0, while the downstream pressure is 𝛽𝜌𝑔𝐻0. Usually, the coefficients and are considered equal 𝛼 𝛽
to 1.0 and 0.5, respectively. However, this rule of thumb is not supported by experimentation or numerical analysis. The literature does not provide simplified practical guidelines that have been validated or verified to account for the fluid flow pressures on overtopped rectangular crests of typical of gravity dams.
Using the trapezoidal pressure field hypothesis, the resultant vertical force on the crest and its 𝐹𝑣
position are given by:𝑥
𝐹𝑣= 0.5(𝛼 + 𝛽)𝜌𝑔𝐵𝐻𝑜 (3)
𝑥 = 𝛼 + 2𝛽
3(𝛼 + 𝛽)𝐵 (4)
The vertical forces on the crest are computed using CFD (𝐹𝐶𝐹𝐷𝑣 ) using the rule of thumb with
and ( ), and with and ( ), which are
𝛼 = 1.0 𝛽 = 0.5 𝐹𝛼 = 1.0,𝛽 = 0.5𝑣 𝛼 = 2/3 𝛽 = 1/3 𝐹𝛼 = 2/3,𝛽 = 1/3𝑣
presented in Table 1. The coefficients 𝛼𝐶𝐹𝐷 and 𝛽𝐶𝐹𝐷 that result in equivalent force and moment and the position 𝑥/𝐵𝐶𝐹𝐷 for each CFD simulation are indicated in Table 1. The position of the
resultant force obtained with the rule of thumb with both sets of coefficients is always equal to . The rule of thumb estimates the position of with a high level of accuracy, but
𝑥 = 0.56𝐵 𝐹𝐶𝐹𝐷𝑣
the force magnitude using 𝛼 = 1.0 and 𝛽 = 0.5 is overestimated by an average of 43%. This leads to an overestimation of the structure stability (sliding and overturning) because the force on the crest is a stabilizing force. However, the average equivalent coefficients 𝛼𝐶𝐹𝐷 and 𝛽𝐶𝐹𝐷, obtained with CFD, are 0.69 and 0.36, respectively. Therefore, using approximate values 𝛼 = 2/3 and estimates the vertical force on the crest with much better accuracy, underestimating it by 𝛽 = 1/3
only 5% on average, which is on the safe side. These values of 𝛼 = 2/3 and 𝛽 = 1/3 are recommended for practical use.
4. Case Study: Existing Gated Spillway
One of the main advantages of CFD is that it can model overtopping flow on structures with complex geometries to obtain the corresponding pressure fields and perform structural stability assessments. The purpose of this section is to model the overtopping responses of an existing
4.1. Spillway Description
In 1996, a major flood occurred in the Saguenay region (Québec, Canada). The rain-induced flow was much greater than the spillway capacity of the several gravity structures located in this area. During this flood, the gravity dams and spillways were subjected to intense hydrodynamic loading conditions, which resulted in overtopping of more than 2 m in some cases (Léger et al. 1998). One of the structures affected by this flood was the Chute Garneau spillway, which is studied herein. This spillway is made of a series of piers that support a concrete bridge. It is 6.30 m high from the bottom to the top of the slab. Figure 1b shows a photo of the spillway during the flood. Despite considerable overtopping, the structure resisted the flood, and its hydroelectric powerplant was later rehabilitated. During the event, there was an important accumulation of floating debris.
4.2. CFD-Structural Modelling and Simulation
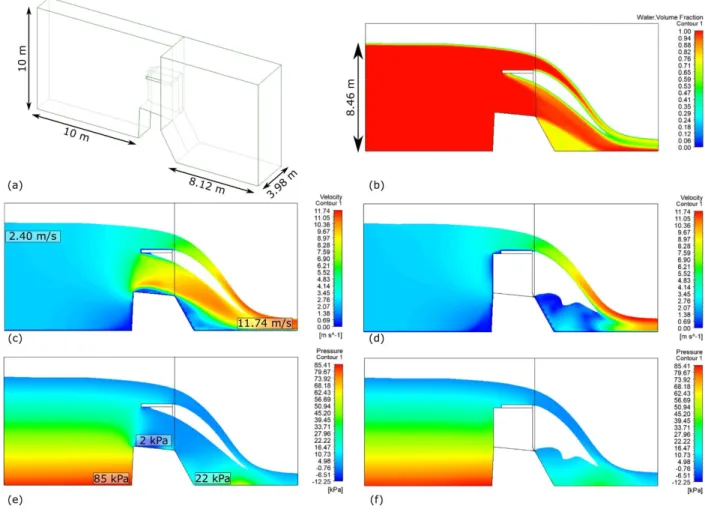
A 3D symmetrical CFD model is developed to analyse the stability of this structure during the flood. The CFD model is limited to one section with a symmetry plane across one of the piers, as presented in Fig. 3a, with no normal flow along the lateral boundaries. Figure 3b shows the profile and the water volume fractions on a cross-section at the middle of the spillway chute. Figures 3c, d show the velocity contour plots at the middle of the spillway chute and at the middle of the pier, respectively, while Figs. 3e,f show the pressure contour plots in the same sections. All these results correspond to an overtopping height of 2.16 m.
From Fig. 3c, the velocity of the flow between the piers and under the slab significantly increases due to a jet effect. This effect creates a small negative pressure on the spillway crest, as noted in Fig. 3e. Full aeration was only obtained in the areas under the slab and downstream of the pier. The region downstream of the spillway chute was not fully aerated. The water volume fraction is
approximately 0.75, indicating partial aeration. This is only possible because the domain was broadened to allow for aeration.
4.3. Parametric Analyses
The Chute Garneau spillway stability is evaluated under two scenarios: (i) with the gates completely opened, and (ii) completely closed. The structure-foundation interface is considered bonded, initially uncracked, and it is assumed that no sliding occurs. With gates open and 2.16 m of overtopping, considering no cohesion or tensile strength and with a 55𝑐 𝜎 o peak friction angle,
𝑡
the sliding safety factor (SSF) computed using the forces obtained with CFD was 0.96. That means that the structure should have failed under these conditions. Moreover, the stability calculation indicated that the entire width of the structure would crack in a brittle manner along the interface with the foundation. However, the real structure survived the flood, making the hypothesis that a minimum tensile strength of 70 kPa could be mobilised, and cracking could be avoided. A cohesion of 8 kPa is then necessary to increase the SSF to 1.00.
A closed gates scenario with similar flow conditions was also studied. With an overtopping height of 2.18 m and the same tensile strength and cohesion considered for the opened gates scenario, the structure is again unstable. A brittle base crack would be formed and the SSF would fall to 0.99. The required tensile strength to avoid cracking is now 147 kPa, while a cohesion of 52 kPa, is required such that the SSF becomes 1.00. The selected concrete-rock tensile and shear strength parameters, subjected to significant uncertainties, are thus determinant.
Looking in the literature, Lo and Grass (1994) evaluated, from in situ testing, the rock-concrete tensile strength, , in multiple dams in Ontario, Canada. The average tensile strength along the 𝜎𝑡
0.18 MPa. EPRI (1992) also presented data indicating that for the peak shear strength in concrete-granite-gneiss foundations, the best fit cohesion is 1.30 MPa, the friction angle is 𝑐 𝜙 57° and the tensile strength is 𝜎𝑡 0.83 MPa. The lower bound cohesion is 0.48 MPa, the friction angle is 57°,
and the tensile strength is 0.31 MPa. Based on these data, using a peak friction angle 𝜙 = 55°, the computed the required tensile strength and cohesion in the opened and closed gates scenarios to justify the observed stability condition during the 1996 flood are within the plausible range presented by these authors.
5. Conclusions and Recommendations
This paper presented an original study to assess the hydrodynamic forces on an overtopped spillway in Québec using CFD and perform a stability analysis. An improved estimation method for the pressure on the crest of an overtopped structure is proposed. A back analysis of the Chute Garneau spillway under the Saguenay flood conditions was performed to study the mechanisms that granted stability to the structure.
For gravity dams with rectangular crests, the evaluation of the weight of the overflowing nappe with upstream height 𝐻0 showed that the pressure head values 𝛼 = 1 at the upstream edge and
at the downstream edge often used to estimate the vertical force overestimate its magnitude 𝛽 = 0.5
by approximately 43%, on average. Using CFD modelling and simulation, we recommend the use of 𝛼 = 2/3 and 𝛽 = 1/3 instead. The resulting pressure field predicts the vertical force magnitude with much better accuracy, underestimating it by only 5% on average. These results are on the safe side if compared to the guidelines and will result in more precise and conservative safety factors. A CFD analysis, producing accurate hydrodynamic loads, and the subsequent structural stability assessment was done for Chute Garneau spillway subjected to a severe flood. Results indicated
that for both opened and closed gates scenarios, a sliding safety factor of 1, justifying the observed stability during the 1996 flood was met when a 147 kPa tensile strength and a 52 kPa cohesion were assumed to be mobilised at the rock-concrete interface. These values are within experimentally reported lower bounds for rock-concrete mechanical strength parameters. This shows that although guidelines do not recommend reliance on rock-concrete tensile strength to ensure stability, it may contribute significantly to stability during an extreme flood.
Acknowledgements
This study was financed in part for the first author by the Coordenação de Aperfeiçoamento de Pessoal de Nível Superior - Brasil (CAPES) - Finance Code 001. The authors also acknowledge that this study was made possible with the support of Global Affairs Canada and the NSERC (National Science and Engineering Research Council of Canada).
References
ANSYS. 2018. Release 19.2. Available from http://ansys.com [accessed 12 March 2019] CDA. 2013. Dam Safety Guidelines. Canadian Dam Association, Edmonton, Alberta, Canada.
EPRI. 1992. Uplift pressures, shear strengths, and tensile strengths for stability analysis of concrete gravity dams. Palo Alto, California.
FERC. 1991. Engineering guidelines for evaluation of hydropower projects—Chapter III Gravity Dams. Federal Energy Regulatory Commission, Office of Hydropower Licensing, Report No. FERC 0119-2, Washington DC, USA.
FERC. 2016. Engineering guidelines for the evaluation of hydropower projects - Draft chapter III: Gravity Dams. Federal Energy Regulatory Commission, Office of Energy Projects, Division of Dam Safety and Inspections, Washington D.C., USA.
Freitas, M.R. CFD Modelling for the Study of Structural Stability of Dams and Spillways Subject to Overtopping. M.Sc. thesis, Department of Civil and Environmental Engineering, University of Brasília, Brasília, Brazil . Griffith, R.A., Rutherford, J.H., Alavi, A., Moore, D., Groeneveld, J. 2007. Stability review of the Wanapum
spillway using CFD analysis. Canadian Dam Association, Bulletin, Fall 2007, 16–26.
Haun, S., Olsen, N. R. B., Feurich, R. 2011. Numerical modeling of flow over trapezoidal broad-crested weir. Engineering Applications of Computational Fluid Mechanics, 5(3): 397–405.
doi:10.1080/19942060.2011.11015381
Hirt, C., Nichols, B. 1981. Volume of fluid (VOF) method for the dynamics of free boundary, Journal of Computational Physics 39(1), 201-225. doi:10.1016/0021-9991(81)90145-5
Ho, D.K.H., Riddette, K.R. 2010. Application of computational fluid dynamics to evaluate performance of spillways in Australia hydraulic. Australian Journal of Civil Engineering, 6(1), 81-104.
doi:10.1080/14488353.2010.11463946
ICOLD. 1995. Dam failures statistical analysis, Bulletin 99. International Commission on Large Dams, Paris. Jasak, H. 1996. Error Analysis and Estimation for the Finite Volume Method with Applications to Fluid Flows.
Ph.D. Thesis, Department of Mechanical Engineering, Imperial College, London, UK.
Leclerc, M., Léger, P. 2017. Computer aided analysis of concrete gravity dams, gated spillways and water intake structures - CADAM3D User Manual, Version 2.4, Polytechnique Montreal, Canada.
Leclerc, M., Léger, P., Tinawi, R. 2003. Computer aided stability analysis of gravity dams - CADAM, International Journal Advances in Engineering Software, 34(7), 403-420. doi:10.1016/S0965-9978(03)00040-1
Léger, P., Tinawi, R., Larivière, R. 1998. The behaviour of Gravity Dams and Spillways in Extreme Floods: Canadian Experience. Journal Hydropower and Dams, 5(3), 73-77.
Lo, K., Grass, J. 1994 Recent experience with safety assessment of concrete dams on rock foundations. In Dam Safety, Canadian Dam Association Annual Conference, Winnipeg, Manitoba, 20 pp.
Menter, F.R. 1993. Zonal two equation k-ω turbulence models for aerodynamic flows. In 24th Fluid Dynamics Conference, Orlando, Florida, USA, 6–9 July 1993, AIAA, 93-2906.
Olsen, N.B.R., Kjellesvig, H. M. 1998. Three-dimensional numerical flow modeling for estimation of spillway capacity. Journal of the Hydraulic Research 36(5), 775-784. doi:10.1080/00221689809498602
USACE. 1995. Engineering and design: Gravity dam design. US Army Corps of Engineers. Report EM 1110-2-2000, Washington, D.C.
USBR. 1987. Design of small dams. United States Bureau of Reclamation. Denver, Colorado.
Vogel, A., Laugier, F., Bourdarot, E. 2015 Failures of masonry or concrete dams by overtopping. In Dam Protections against Overtopping and Accidental Leakage. Edited by Toledo, M., Oñate, E., Oñate, E. London: CRC Press. doi:10.1201/b18292
Willey, J., Ewing, T., Wark, B., Lesleighter, E. 2012. Complementary Use of Physical and Numerical Modelling Technique in Spillway Design Refinement. In ICOLD, 24th Congress of Large Dams, Q. 94 – R. 5, Kyoto, Japan.
List of Figure Captions
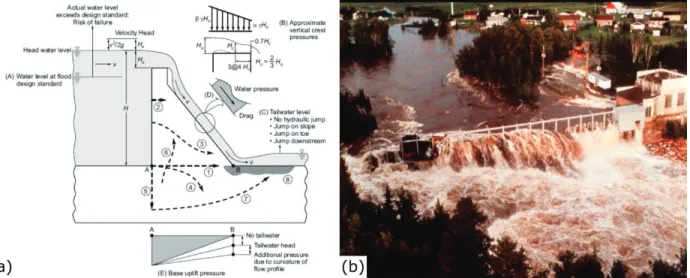
Figure 1. Overtopping of gravity dams: (a) failure modes of gravity dams as a result of floods (1-7 potential crack propagation trajectories and development of failure mechanisms, 8 foundation erosion and buckling of thinly bedded strata) and (b) example of overtopping of a hydraulic structure during the 1996 Saguenay flood.
Figure 2. Dam rectangular crest: (a) computational model, (b) simplified pressure field on crest subject to overtopping, (c) comparison between pressure field using CFD and simplified method with 𝜶 = 𝟏.𝟎 and 𝜷 = 𝟎.𝟓, and with 𝜶 = 𝟐/𝟑 and 𝜷 = 𝟏/𝟑.
Figure 3. Chute Garneau spillway CFD model for 𝑯𝟎 = 𝟐.𝟏𝟔 𝒎: (a) geometric model, (b) water volume fraction at spillway section, velocity contours at (c) spillway section and (d) pier section, pressure contours at (e) spillway section and (f) pier section.
List of Tables
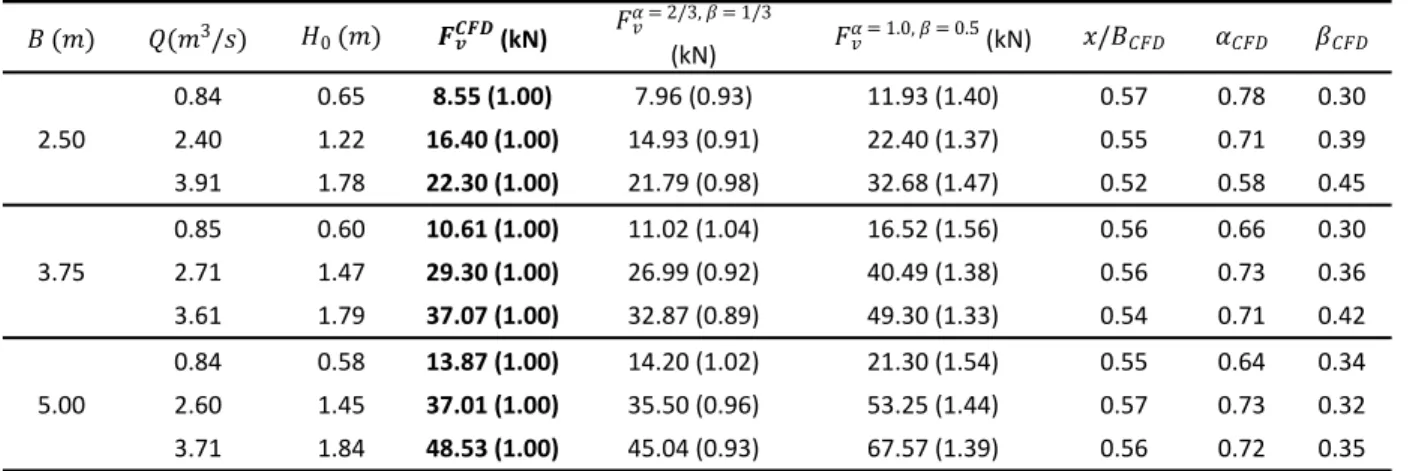
Table 1 Crest pressure coefficients obtained from the simplified methods and CFD. 𝐵 (𝑚) 𝑄(𝑚3/𝑠) 𝐻 0 (𝑚) 𝑭𝑪𝑭𝑫𝒗 (kN) 𝐹 𝛼 = 2/3, 𝛽 = 1/3 𝑣 (kN) 𝐹𝛼 = 1.0, 𝛽 = 0.5𝑣 (kN) 𝑥/𝐵𝐶𝐹𝐷 𝛼𝐶𝐹𝐷 𝛽𝐶𝐹𝐷 0.84 0.65 8.55 (1.00) 7.96 (0.93) 11.93 (1.40) 0.57 0.78 0.30 2.40 1.22 16.40 (1.00) 14.93 (0.91) 22.40 (1.37) 0.55 0.71 0.39 2.50 3.91 1.78 22.30 (1.00) 21.79 (0.98) 32.68 (1.47) 0.52 0.58 0.45 0.85 0.60 10.61 (1.00) 11.02 (1.04) 16.52 (1.56) 0.56 0.66 0.30 2.71 1.47 29.30 (1.00) 26.99 (0.92) 40.49 (1.38) 0.56 0.73 0.36 3.75 3.61 1.79 37.07 (1.00) 32.87 (0.89) 49.30 (1.33) 0.54 0.71 0.42 0.84 0.58 13.87 (1.00) 14.20 (1.02) 21.30 (1.54) 0.55 0.64 0.34 2.60 1.45 37.01 (1.00) 35.50 (0.96) 53.25 (1.44) 0.57 0.73 0.32 5.00 3.71 1.84 48.53 (1.00) 45.04 (0.93) 67.57 (1.39) 0.56 0.72 0.35
Note: Values in parenthesis represent the ratio between the vertical forces obtained using the simplified method and CFD, taken as reference.
Figure 1. Overtopping of gravity dams: (a) failure modes of gravity dams as a result of floods (1-7 potential crack
propagation trajectories and development of failure mechanisms, 8 foundation erosion and buckling of thinly bedded strata) and (b) example of overtopping of a hydraulic structure during the 1996 Saguenay flood.
Figure 2. Dam rectangular crest: (a) computational model, (b) simplified pressure field on crest subject to overtopping,
(c) comparison between pressure field using CFD and simplified method with 𝜶 = 𝟏.𝟎 and 𝜷 = 𝟎.𝟓, and with 𝜶 = 𝟐/𝟑 and 𝜷 = 𝟏/𝟑.
Figure 3. Chute Garneau spillway CFD model for 𝑯𝟎= 𝟐.𝟏𝟔 𝒎: (a) geometric model, (b) water volume fraction at spillway section, velocity contours at (c) spillway section and (d) pier section, pressure contours at (e) spillway section and (f) pier section.