Titre:
Title
: Wait analysis of virtual machines using host kernel tracing
Auteurs:
Authors
: Hani Nemati, Geneviève Bastien et Michel R. Dagenais
Date: 2018
Type:
Communication de conférence / Conference or workshop itemRéférence:
Citation
:
Nemati, H., Bastien, G. & Dagenais, M. R. (2018, janvier). Wait analysis of virtual machines using host kernel tracing. Communication écrite présentée à IEEE International Conference on Consumer Electronics (ICCE 2018), Las Vegas, États-Unis (6 pages). doi:10.1109/icce.2018.8510984
Document en libre accès dans PolyPublie
Open Access document in PolyPublieURL de PolyPublie:
PolyPublie URL: https://publications.polymtl.ca/4205/
Version: Version finale avant publication / Accepted versionRévisé par les pairs / Refereed Conditions d’utilisation:
Terms of Use: Tous droits réservés / All rights reserved
Document publié chez l’éditeur officiel
Document issued by the official publisher
Nom de la conférence:
Conference Name: IEEE International Conference on Consumer Electronics (ICCE 2018)
Date et lieu:
Date and Location: 12-14 janvier 2018, Las Vegas, États-Unis
Maison d’édition:
Publisher: IEEE
URL officiel:
Official URL: https://doi.org/10.1109/icce.2018.8510984
Mention légale:
Legal notice:
© 2018 IEEE. Personal use of this material is permitted. Permission from IEEE must be obtained for all other uses, in any current or future media, including
reprinting/republishing this material for advertising or promotional purposes, creating new collective works, for resale or redistribution to servers or lists, or reuse of any copyrighted component of this work in other works.
Ce fichier a été téléchargé à partir de PolyPublie, le dépôt institutionnel de Polytechnique Montréal
This file has been downloaded from PolyPublie, the institutional repository of Polytechnique Montréal
Wait analysis of Virtual Machines using host kernel tracing
Hani Nemati∗, Genevi`eve Bastien†, and Michel R. Dagenais‡ Department of Computer and Software Engineering,
Polytechnique Montreal, Quebec, Canada
Email:{∗hani.nemati,†genevieve.bastien,‡michel.dagenais}@polymtl.ca
Abstract—An agent-less method to understand virtual ma-chines (VMs) behavior its evolution during the VM life-cycle is an essential task for IaaS provider. It allows the IaaS provider to better scale the VMs resources by properly allocating the physical resources. On the other hand, because of privacy, security, ease of deployment and execution overhead issues, the method presented limits its data collection to the physical host level, without internal access to the VMs.
We propose a host-based, precise method to recover wait states for the virtual CPUs (vCPUs) of a given VM. The Wait Analysis Algorithm (W2A) computes the state of vCPUs through the host kernel trace. The state of vCPUs is displayed in an interactive trace viewer (TraceCompass) for further inspection. Our proposed VM trace analysis algorithm has been open-sourced for further enhancements and to the benefit of other developers. Our new technique is being evaluated with representative workloads, generated by different benchmarking tools. These approaches are based on host hypervisor tracing, which brings a lower overhead (around 0.03%) as compared to other approaches.
Keywords-Virtual Machine; Performance Analysis; Wait Analysis; Elasticity;
I. INTRODUCTION
Cloud computing is one of the latest revolution in com-puting, where many computer services move from local physical servers to the cloud environment. The diagnosis of performance problems for the cloud environment is a challenging problem, due to the different virtual layers and the variety of applications. The isolation offered by VMs provides some security benefits, such as reducing the threats from buggy application to infect the system underneath. Similarly, the system underneath also should not be able to access the VMs because of safety and confidentiality issues. As a result, for analyzing and debugging VMs, an agentless mechanism is needed.
Agentless VM tracing, collects traces from the host hy-pervisor without installing any tracing agent on each VM - which makes the agentless approach easier to manage than agent-based VM tracing. Tracing software installation is only required on the host hypervisor. It also avoids the additional overhead caused by each tracing agent in the VMs. Anyway, most of the time, the cloud provider does not have access to VMs internally due to user privacy. Therefore, it cannot easily obtain any useful information for debugging and troubleshooting.
Moreover, most applications need to dynamically adjust the resource capacity based on their demand, and therefore the Infrastructure as a Service (IaaS) provider should provi-sion resources based on the VMs needs. Accordingly, there is a need for a technique to understand the reasons for waiting within VMs. Thus, the technique should do the analysis from the host hypervisor, to be able to provision adequately resources for the VMs. Scaling up or scaling down should not be premature. The IaaS should be able to anticipate the service needs.
The best way to anticipate the needed resources is to investigate wait states for the VMs. The IaaS provider could detect when and why a VM is waiting. A VM mainly waits for four reasons. If the VM vCPU is woken up by a timer interrupt, it indicates that a timer fired inside the VM. It could be because of scheduler ticks, which means the VM does not have anything to run. It also could be because of a timer that an application sets. If the vCPU is woken up by another vCPU, it indicates that a process was waiting for another process. A vCPU could be woken up by network interrupts. It shows that the VM is waiting for an incoming packet. The VM could also wait for disk, when the vCPU is woken up by a disk interrupt.
It is a difficult task to analyze a wait state that occurred inside a VM. The reasons are multi-fold. First, in most cases, the cloud provider does not have access to the VMs due to high monitoring overhead costs and user privacy. Secondly, the overhead of tracing inside VMs may cause conflicts with applications.
Our main goal in this paper is to understand the wait time for the vCPUs of a given VM, to investigate performance is-sues and to provision resources capacity, in order to improve response time. Our technique is mainly being developed for IaaS providers that do not have access to the VM internally. Host kernel tracing allows to find out the wait states for the vCPUs. There is no need to modify the hypervisor in order to get wait states. Since our technique only needs a few tracepoints to be enabled, a low overhead can be achieved. The contributions are as follows: First, An algorithm based on host hypervisor tracing to detect wait states for vCPUs. Second, A graphical view for vCPUs to display the states of vCPUs, which can be used to study the behavior of the VMs. Third, Experiments on actual software to study the behavior of VMs, according to the waits for resources.
Forth, Agentless Performance Analysis method that adds less overhead as compared to existing methods.
The rest of this paper is organized as follows: Section II presents a summary of other existing approaches for analyzing and debugging VMs. Section III explains the algorithm used to detect wait states for the VMs from vCPU threads of the VM. It also explains how we can find the different states of the vCPUs of the VMs. Section IV states our experimental results along with the architecture used in our paper. We compare our approach with the existing approach in terms of overhead in section V. Section VI concludes the paper with directions for future investigations.
II. RELATEDWORK
In this section, we survey the available techniques for monitoring and debugging VMs.
Virtual Machine introspection (VMI) is a fine-grained technique to analyze the running state of a VM from outside of the VM. This technique has been used for security threat analysis or simply to monitor VMs. VMI techniques scan the VM memory space to extract useful information. For example, they can parse kernel space memory to build a process table map and combine it with the VMCS structure to analyze the VM. LibVMI [1] is an open source library that provides APIs for analyzing the memory space of the VMs. Several VMI tools like [2][3] have been developed to detect malware and security threats. The memory space analysis is a time-consuming task and the overhead of analysis increases when the VM memory space is large. On the other hand, none of the VMI tools target performance analysis of the VM in terms of resource usage and resource contention. A technique to detect VM faults has been proposed in [4]. They could investigate the local and global impact of faults by tracing each and every VM with LTTng [5]. Their approach, however, needs to trace each VM, which significantly increases the overhead on the VMs. Indeed, as we will see in subsection V, the overhead of tracing VMs is much larger than with our proposed method.
Performance counters and Linux tools like iostat have been used in Novakovic et al. [6]. Linux provides some performance monitoring tools, such as vmstat and iostat, which gather statistics by reading proc files. Parsing and analysing the output of these tools bring overhead to the VMs.
A vCPU state detection algorithm based on host hyper-visor is proposed in [7],[8], and [9]. They built different states for the running processes and threads. Their technique can investigate the root cause of latency for application executions. In their approach, they do not provide any additional information when the VM is Idle. In [10], a multi-layers vCPU state detection has been proposed. Biancheri et al.in [11] extended this to multi-layer VM analysis. In their approach, VMs and the Host hypervisor should be traced, which adds more overhead.
Table I
EVENTS AND THEIR PAYLOAD BASED ONHOST KERNEL TRACING
# Events # Events 1 wake_up(disk_thread) 10 sched_in(vCPU0) 2 sched_out(vCPU0) 11 sched_out(vCPU1) 3 sched_out(vCPU1) 12 inj_virq(vec2) 4 inj_virq(vec1) 13 sched_out(vCPU0) 5 sched_in(vCPU0) 14 inj_virq(vec3) 6 inj_virq(vec1) 15 sched_in(vCPU0) 7 sched_in(vCPU1) 16 inj_virq(vec3) 8 sched_out(vCPU0) 17 sched_in(vCPU1) 9 inj_virq(vec2) 18 inj_virq(vec4)
An adaptive SLA-based elasticity method has been pro-posed in [12]. In their method, an end-to-end metric is used to scale up and scale down the resources. Their method is based on CPU scaling and does not provide any information about the disks or the network.
The work closest to ours, which motivated the current research, is presented in [13]. They proposed a technique to find the active path for the threads along different machines. The authors could refine the state for a preempted thread into the wait for disk, wait for timer, wait for task or wait for network states. In their case, they traced each VM. After tracing, they synchronize the traces from each VM. Then, they search through all threads to find the active path.
To the best of our knowledge, there is no pre-existing efficient technique to analyze the state of the vCPUs. Our technique can uncover many issues inside VMs without internal access. Moreover, compared to other solutions, our method offers less overhead and ease of deployment, in terms of tracing, since it limits its data collection to the host hypervisor level.
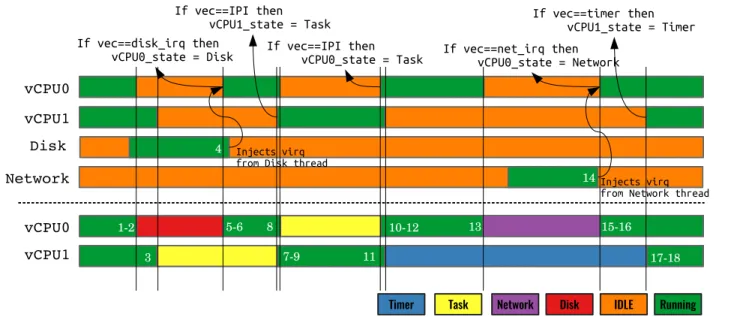
III. WAITANALYSISALGORITHM(W2A) In this section, we propose an algorithm to understand the wait states for the VMs using the host trace. Before introducing the Wait Analysis Algorithm (W2A), we explain a very simple algorithm to detect the running state for vCPUs of a VM. This algorithm uses sched_out and sched_in events to find out whether the VM is in the Running or Idle State. Figure 1 ( top ) shows an exam-ple of this algorithm using the events from Table I. The sched_out event shows that the vCPU is scheduled out from the physical CPU (pCPU) and goes into the Idle State. The next sched_in event shows that the vCPU is being scheduled in and the state changes from Idle to Running. This algorithm is simplistic that cannot detect the reason of Idle state for a specific VM.
Using the W2A algorithm, the exact reason for the Idle state can be detected. W2A is illustrated with an example in Figure 1. When receiving the sched_out event, the vCPU sate goes to unknown. The key idea is that the event indicating the cause of the Idle state is unknown a priori. The interrupt later injected into the VM reveals the reason for
Figure 1. vCPU states using W2A algorithm
the Idle state. The vCPU can be woken up for the following reasons. First, a process inside the VM sets a timer and the time-out occurred (Timer Interrupt). Second, a process inside the VM wakes up by another process (IPI Interrupt). Third, a process inside the VM is woken up by a remote task over a socket (Network Interrupt). Fourth, a process inside the VM is waiting for the disk (Disk Interrupt). The sched_in(vCPU0)event shows that vCPU0 is scheduled in but the reason for being idle is still unknown. With the inj_virq(vec1)event (the 6th event), the unknown state changes to the Disk state, since vec1 is the irq vector for the disk interrupt. The sched_in(vCPU1) scheduled in the vCPU1 and the reason for being idle is unveiled when receiving inj_vriq(vec2). As vec2 is irq the vector for IPI interrupts, the unknown state changes to the Task state. Other states are built by examining the injected interrupt, when execution resumes (running state) for each vCPU.
The pseudocode for the W2A algorithm is depicted in Algorithm 1. The W2A algorithm receives a sequence of events as input and updates the vCPU state for each VM. Event sched_in shows when a vCPU is ruuning on a pCPU. When a vCPU is scheduled in, its state changes to running (Line 2). In contrast, when a vCPU is scheduled out, it goes to the unknown state (Line 4) which will be updated later with the waiting cause. In case the event is inj_virq, the vec field in this event is compared with the Task, Timer, Disk, and Network interrupt number. The unknown state is updated based on the vec number.
IV. USE-CASES
In this section, we evaluate our wait analysis technique for analyzing the behavior of VMs and detecting related issues.
Algorithm 1: Wait Analysis Algorithm (W2A) 1 if event == sched in then
2 vCP Uj = Running;
3 else if event == sched out then 4 vCP Uj = Unknown ;
5 else if event == inj virq then 6 if vec == Task Interrupt then
7 Update Unknown State for vCP Uj to Task; 8 else if vec == Timer Interrupt then
9 Update Unknown State for vCP Uj to Timer; 10 else if vec == Disk Interrupt then
11 Update Unknown State for vCP Uj to Disk; 12 else if vec == Network Interrupt then
13 Update Unknown State for vCP Uj to Network;
A. Analysis Architecture
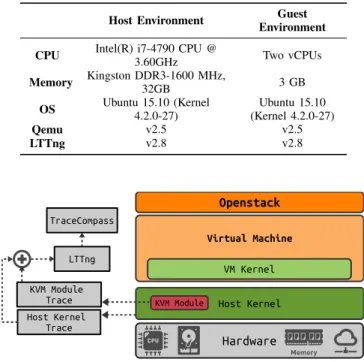
We have chosen the Kernel-based Virtual Machine (KVM), under the control of OpenStack, as experimental setup. KVM is the most commonly used hypervisor for Openstack[14]. For the userspace part of the hypervisor, we installed QEMU to execute the OS support for the VM. Our architecture is shown in Figure 2. As we can see, events are gathered by our tracer (LTTng) from the host hypervisor first, and then the events are sent to the trace analyzer (TraceCompass). For the prototype implementation on Linux, we used LTTng as the tracer. The host kernel and KVM module are instrumented by different static trace-points. LTTng gathers the events from the KVM module and kernel space, and sends them to the analyzer. Trace Compass is an open source software for analysing traces and logs.
It has some pre-built views, especially for LTTng [15]. We prototyped our wait analysis tool as a separate view in Trace Compass.
For our analysis, two events should be enabled in LT-Tng: sched_switch to find out the running states and kvm_inj_virqto update the wait states. Our experimen-tal setup is described in Table II. The analysis is performed according to the following steps: 1) Start LTTng on the host. 2) Run the VMs of interest. 3) Stop LTTng. 4) Run the analyses. 5) Display the results in Trace Compass.
Table II
EXPERIMENTALENVIRONMENT OFHOST,ANDGUEST
Host Environment Guest Environment CPU Intel(R) i7-4790 CPU @
3.60GHz Two vCPUs Memory Kingston DDR3-1600 MHz,32GB 3 GB
OS Ubuntu 15.10 (Kernel4.2.0-27) (Kernel 4.2.0-27)Ubuntu 15.10
Qemu v2.5 v2.5
LTTng v2.8 v2.8
Figure 2. Architecture of our implementation
B. Use-Case 1
In the first experiment, a Remote Procedure Call (RPC) server and client are written to experiment the effect of waiting for network for a RPC server and client. The RPC client sends a command to the RPC server to calculate 1000 Fibonacci numbers and executes every 10 ms. We use the tc traffic shaper to manipulate the traffic control settings. The traffic shaper is applied to the virtual network interface to increase the network latency by 5 ms. Figure 3 shows the graphical representation of the vCPU state. The green intervals indicate the running state for vCPUs and the purple intervals are network waits. Our vCPU view also depicts that, after receiving the response from the RPC server, the RPC client sets a timer for 10 ms.
We also observed the effect of the network delay on the RPC server and client. The RPC client waits for 10 ms for the network to receive the response (5 ms delay of RPC
client network + 5 ms delay of RPC server network). The RPC server waits for 20 ms to receive the new request from the RPC client (5 ms delay of RPC client network + 5 ms delay of RPC server network + 10 ms timer between each request).
In another experiment, the RPC server and RPC client are executed when there is natural network latency. Since both VMs are on the same host, the latency between the two VMs is less than 1 ms. Figure 4 depicts the state of vCPUs for both VMs. As shown, the RPC client receives the response from the RPC server immediately and does not wait for the network. The RPC server waits for 10 ms to receive the new request, since the RPC client sends a new request every 10 ms.
Figure 3. Wait analysis of vCPU with network issue
Figure 4. Wait analysis of vCPU without network issue
C. Use-Case 2
Most Cloud providers like Amazon limit the resource us-age for each VM in order to prevent important performance reductions due to sharing resources. For example, the I/O size is capped at 256 KiB for SSD volumes and 1024 KiB for HDD volumes in Amazon EC2 instances, with a certain number of I/O operations per second allowed [16]. There is a trade-off between setting resource limits too low and too high. When the resource limit is too low, the VM waits for the resource most of the time. By contrast, setting a high
resource cap could cause resource contention with other VM instances. In this subsection, we analyze these two cases and present how our technique could detect these issues.
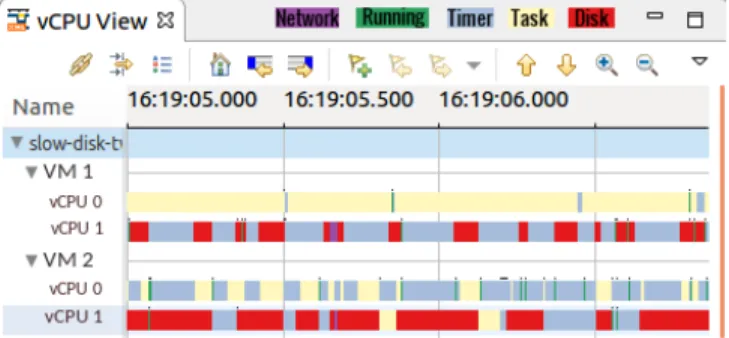
In the first experiment, the Linux dd command has been used to write a random file to the disk. The host is traced by LTTng and our technique is used to detect the wait time for the vCPU. The results showed that vCPU of the VM is waiting all the time for the disk. In this case, the disk I/O was limited to read and write 2048 kB/s. Figure 5 shows that the vCPU is waiting for the disk to finish. In another experiment, the Linux dd command is executed in two VMs at the same time to write a random file to the disk. The host is being traced and the result is shown in Figure 6. As the graphical view shows, the two VMs are waiting for disk and there is contention between the two VMs in order to use the shared disk.
Figure 5. Wait analysis of vCPU for a slow disk
Figure 6. Wait analysis of vCPU when there is resource contention between two VMs
D. Use-Case 3
In this subsection, Linux kernel 4.13 is being compiled with different make targets and the VMs boot-up is being analysed. We have added two vCPUs to our VMs (4 vCPUs) in order to better show the effect of waiting for resources. In the first experiment, the Linux kernel is being compiled with the allmodconfig target. The allmodconfig target creates a kernel configuration with all possible modules. It builds a heavyweight Linux kernel and the boot-up time increases significantly. As Figure 7 shows, the total boot-up time for this non-optimized kernel is 50.15 sec. Since the kernel is very large, the vCPU waits for the disk for 13.51 sec and
also waits for other tasks to finish their job for 49.55 sec (for 4 vCPUs). Moreover, waiting for the timer consumes 69.74 seconds, since nothing is executed and scheduling-clock ticks are needed. There are some unknown states for the vCPUs that our technique could not detect because it is in the early stage of boot-up (before launching the init process). In this boot-up step, there is no device assigned to the VM. As a result, our technique could not detect the vCPU state.
In another experiment, the Linux kernel was compiled with the localmodconfig target. The localmodconfig target usually discovers the kernel minimal useful configuration and disables any module that is not being loaded. In this case, the Linux kernel is lighter (semi-optimized) and it boots up faster. As shown in Figure 7, the boot-up time, wait for disk and wait for task are 15.6 sec, 7.07 sec and 16.66 sec, respectively.
In another experiment, the VM with optimized kernel is moved to a Solid-State Drive (SSD). As expected, on a SSD drive, the VM boots up faster (5.22 sec) because of the shorter disk wait. As the results show, the larger kernel increases the boot-up time mostly because of waiting for I/O. Figure 7 depicts that more I/O waiting implies more waiting for task, and as a result more waiting for timer.
Using W2A, the IaaS provider could tune the allocated resources based on VM needs. They could find out the reason for waiting and solve the issue by provisioning that specific resource. 0 5 10 15 20 25 30 35 40 45 50 55 60 65 70
Non-Op timized-H DD Optimized-H DD Optimized-S SD Different C onfigurations Time (sec) Disk Running Task Timer Total Unknown
Figure 7. Wait analysis of VM boot-up
V. ANALYSISCOST
In this section, the overhead of W2A is compared with the Critical Path Analysis (CPA) as proposed in [13]. In order to compare the two approaches, we enabled the tracepoints that were needed for the CPA approach, and we traced the VMs. Also, it is worth mentioning that our new W2A algorithm needs only to trace the host. As shown in Table III, the
Table III MY CAPTION
Benchmark Baseline CPA W2A Overhead CPA W2A File I/O (ms) 450.92 480.38 451.08 6.13% 0.03% Memory (ms) 612.27 615.23 614.66 4.81% 0.01% CPU (ms) 324.92 337.26 325.91 3.65% 0.30%
critical path analysis approach adds more overhead in all tests, since it needs to trace the VMs. We used the Sysbench benchmarks to reveal the overhead of both approaches, since sysbench is configured for Memory, Disk I/O and CPU intensive evaluations. Our approach has negligible overhead for CPU and Memory intensive tasks at 0.3% or less.
VI. CONCLUSION
Widespread study and deployment of performance anal-ysis for VMs has led to the deployment of different ap-proaches to debug and troubleshoot the VMs. However, for the wait analysis in the context of VMs, the current moni-toring and analysis tools do not provide enough information about VMs for effective debugging and troubleshooting. In this paper, we address the issue of efficiently analyzing the behavior of such VMs. Our technique can detect different wait states along with their root causes. Our approach is based exclusively on host hypervisor tracing, which adds less overhead as compared to other approaches. Our benchmarks show that the added overhead in our approach was around 0.3%. In contrast, the overhead of other approaches ranged from 3.65 to 6.13%. We also proposed a way to effectively visualize the different states of vCPUs for the VMs. This graphical view shows the timing at high-resolution for all the VM executions. Our technique has been tested for different types of workload to investigate performance issues. As future work, our current technique can be enhanced to further investigate interferences between VMs and predict the exact amount of desirable scale up or scale down for the resources.
REFERENCES
[1] “Libvmi, virtual machine introspection library, howpublished = http://libvmi.com/, note = Accessed: 2017-08-03.” [2] S. T. Jones, A. C. Arpaci-Dusseau, and R. H. Arpaci-Dusseau,
“Vmm-based hidden process detection and identification using lycosid,” in Proceedings of the Fourth ACM SIGPLAN/SIGOPS International Conference on Virtual Execution Environments, ser. VEE ’08. New York, NY, USA: ACM, 2008, pp. 91–100. [Online]. Available: http://doi.acm.org/10.1145/1346256.1346269
[3] L. Litty and D. Lie, “Manitou: A layer-below approach to fighting malware,” in Proceedings of the 1st Workshop on Architectural and System Support for Improving Software Dependability, ser. ASID ’06. New York, NY, USA: ACM, 2006, pp. 6–11. [Online]. Available: http://doi.acm.org/10.1145/1181309.1181311
[4] D. Dean, H. Nguyen, P. Wang, X. Gu, A. Sailer, and A. Kochut, “Perfcompass: Online performance anomaly fault localization and inference in infrastructure-as-a-service clouds,” IEEE Transactions on Parallel and Distributed Sys-tems, vol. PP, no. 99, pp. 1–1, 2015.
[5] M. Desnoyers and M. R. Dagenais, “The lttng tracer: A low impact performance and behavior monitor for gnu/linux,” in OLS (Ottawa Linux Symposium) 2006, 2006, pp. 209–224. [6] D. Novakovi´c, N. Vasi´c, S. Novakovi´c, D. Kosti´c, and
R. Bianchini, “Deepdive: Transparently identifying and man-aging performance interference in virtualized environments,” in USENIX Conference on Annual Technical Conference. USENIX Association, 2013, pp. 219–230.
[7] H. Nemati, S. D. Sharma, and M. R. Dagenais, “Fine-grained nested virtual machine performance analysis through first level hypervisor tracing,” in Proceedings of the 17th IEEE/ACM International Symposium on Cluster, Cloud and Grid Computing, ser. CCGrid ’17. Piscataway, NJ, USA: IEEE Press, 2017, pp. 84–89. [Online]. Available: https://doi.org/10.1109/CCGRID.2017.20
[8] H. Nemati and M. R. Dagenais, “Virtual cpu state detection and execution flow analysis by host tracing,” in 2016 IEEE International Conferences on Big Data and Cloud Computing (BDCloud), Social Computing and Networking (SocialCom), Sustainable Computing and Communications (SustainCom) (BDCloud-SocialCom-SustainCom), Oct 2016, pp. 7–14. [9] M. D. S Sharma, H Nemati, “Low overhead hardware assisted
virtual machine analysis and profiling,” in IEEE Globecom Workshops (GC Workshops), 2016.
[10] M. Gebai, F. Giraldeau, and M. R. Dagenais, “Fine-grained preemption analysis for latency investigation across virtual machines,” in Journal of Cloud Computing, December 2014, pp. 1–15.
[11] C. Biancheri, N. Eezzati-Jivan, and M. R. Dagenais, “Mul-tilayer virtualized systems analysis with kernel tracing,” in 2016 IEEE 4th International Conference on Future Internet of Things and Cloud Workshops (FiCloudW), Aug 2016, pp. 1–6.
[12] H. Nemati, A. Singhvi, N. Kara, and M. E. Barachi, “Adaptive sla-based elasticity management algorithms for a virtualized ip multimedia subsystem,” in 2014 IEEE Globecom Work-shops (GC Wkshps), Dec 2014, pp. 7–11.
[13] F. Giraldeau and M. Dagenais, “Wait analysis of distributed systems using kernel tracing,” IEEE Transactions on Parallel and Distributed Systems, vol. 27, no. 8, pp. 2450–2461, Aug 2016.
[14] “Open source software for creating clouds ,” https://www.openstack.org/, accessed: 2016-11-16.
[15] “Trace compass,” https://projects.eclipse.org/projects/tools. tracecompass, accessed: 2016-11-16.
[16] “Amazon i/o characteristics and monitoring, howpublished = http://docs.aws.amazon.com/awsec2/latest/userguide/ebs-io-characteristics.html, note = Accessed: 2017-08-03.”