Titre: Title:
Numerical and analytical solutions for the pore water pressures within barricades made of waste rocks
Auteurs:
Authors: Li Li et Michel Aubertin Date: 2011
Type: Rapport / Report Référence:
Citation:
Li, Li et Aubertin, Michel (2011). Numerical and analytical solutions for the pore water pressures within barricades made of waste rocks. Rapport technique. EPM-RT-2011-02
Document en libre accès dans PolyPublie Open Access document in PolyPublie
URL de PolyPublie:
PolyPublie URL: http://publications.polymtl.ca/2639/
Version: Version officielle de l'éditeur / Published versionNon révisé par les pairs / Unrefereed Conditions d’utilisation:
Terms of Use: Autre / Other
Document publié chez l’éditeur officiel Document issued by the official publisher
Maison d’édition:
Publisher: École Polytechnique de Montréal URL officiel:
Official URL: http://publications.polymtl.ca/2639/ Mention légale:
Legal notice: Tous droits réservés / All rights reserved
Ce fichier a été téléchargé à partir de PolyPublie, le dépôt institutionnel de Polytechnique Montréal
This file has been downloaded from PolyPublie, the institutional repository of Polytechnique Montréal
EPM–RT–2011-02
NUMERICAL AND ANALYTICAL SOLUTIONS FOR THE PORE WATER PRESSURES WITHIN BARRICADES
MADE OF WASTE ROCKS Li Li
Département de génie de la construction École de technologie supérieure
Michel Aubertin
Département des génies civil, géologique et des mines École polytechnique de Montréal
EPM-RT-2011-02
Numerical and analytical solutions for the pore water
pressures within barricades made of waste rocks
Li Li
Département de génie de la construction
École de technologie supérieure
Michel Aubertin
Département des génies civil, géologique et des mines
École Polytechnique de Montréal
2011
Li Li, Michel Aubertin
Tous droits réservés
Dépôt légal :
Bibliothèque nationale du Québec, 2011 Bibliothèque nationale du Canada, 2011 EPM-RT-2011-02
Numerical and analytical solutions for the pore water pressures within barricades made of waste rocks par : Li Li1, Michel Aubertin2
1Département de génie de la construction
École de technologie supérieure
2Département des génies civil, géologique et des mines
École Polytechnique de Montréal
Toute reproduction de ce document à des fins d'étude personnelle ou de recherche est autorisée à la condition que la citation ci-dessus y soit mentionnée.
Tout autre usage doit faire l'objet d'une autorisation écrite des auteurs. Les demandes peuvent être adressées directement aux auteurs (consulter le bottin sur le site http://www.polymtl.ca/) ou par l'entremise de la Bibliothèque :
École Polytechnique de Montréal
Bibliothèque – Service de fourniture de documents Case postale 6079, Succursale «Centre-Ville» Montréal (Québec)
Canada H3C 3A7
Téléphone : (514) 340-4846
Télécopie : (514) 340-4026
Courrier électronique : biblio.sfd@courriel.polymtl.ca
Ce rapport technique peut-être repéré par auteur et par titre dans le catalogue de la Bibliothèque :
ABSTRACT
Stope backfilling is a commonly used in underground mines. In many cases, the backfill is initially saturated with water to facilitate transportation from the surface to the underground openings. A barricade is required at the base of the stope, near the drift entrance, to retain the backfill in place. An increasingly popular practice is to use waste rocks to construct the barricade. Additional work is however needed to investigate the hydro-geomechanical behaviour of such type of barricade. In this report, the distribution of pore water pressure in barricades made of waste rocks is analysed. An analytical solution, based on a combined artesian-gravity steady-state flow condition, is introduced and applied to estimate the pore water pressure along the base of the barricade. Results from numerical simulations are then used to assess the validity of the analytical solution and to evaluate the effect of various influence factors. The results show that the proposed solution generally predicts well the distribution of pore water pressure obtained from the numerical calculations. This analytical solution is extended to evaluate the pressure along the full height of the barricade.
Key words: Mine backfill; Barricade; Analytical solution; Numerical simulations; Seepage; Pore water
pressure.
RÉSUMÉ
Le remblayage des chantiers est une opération courante dans les mines souterraines. Dans la plupart des cas, le remblai est initialement saturé en eau pour faciliter le transport de la surface vers les ouvertures souterraines. La mise en place d’une barricade à la base du chantier est requise pour maintenir le remblai en place. Une pratique de plus en plus populaire est d’utiliser les roches stériles pour construire la barricade. Des travaux sont cependant nécessaires pour évaluer le comportement hydro-géomécanique des barricades construites avec des roches stériles. Dans ce rapport, la distribution des pressions interstitielles dans de telles barricades est analysée. Une solution analytique, basée sur une condition d’écoulement stationnaire artésien et gravitaire, est introduite et appliquée afin d’estimer la pression interstitielle le long de la base de la barricade. Des résultats de simulations numériques sont ensuite utilisés pour évaluer la validité de cette solution analytique et l’effet de divers facteurs d’influence. Les résultats montrent que la solution proposée prédit généralement bien la distribution des pressions interstitielles obtenue par les simulations numériques. La solution analytique est généralisée pour évaluer la pression interstitielle sur toute la hauteur de la barricade.
Mots clés: Remblai minier; Barricade; Solution analytique; Simulations numériques; Écoulement
TABLE OF CONTENTS
ABSTRACT ... ii
RÉSUMÉ... ii
TABLE OF CONTENTS... iii
LIST OF FIGURES ... ………..iv
LIST OF TABLES ... ………..vi
1. INTRODUCTION... 1
2. PORE WATER PRESSURE IN BARRICADES ... 2
2.1 Analytical solution for the pore water pressure along the base of the barricade ... 4
2.2 Numerical modelling of pore water pressure in barricades ... 7
2.3 Comparison between numerical and analytical solutions ... 9
3. PORE WATER PRESSURE WITHIN THE BARRICADE ... 10
3.1 Parametric Analyses of Pore Pressure Distribution ... 11
3.1.1 Effect of boundary conditions ... 13
3.1.2 Size of the barricade ... 15
3.1.3 Hydraulic conductivity ... 19
4. DISCUSSION ... 20
5. CONCLUSION ... 23
ACKNOWLEDGEMENT ... 23
LIST OF FIGURES
Figure 1 A backfilled stope with an access drift and a waste rock barricade.
Figure 2 Simplified representation of the pore water pressure head on the upstream and downstream sides of the barricade.
Figure 3 Two dimensional view of the confined and gravity flow model.
Figure 4 Distribution of pore water pressure in a barricade calculated with the proposed analytical solution. The pressure is given along the floor of the drift for different k (hydraulic conductivity) values. The parameters used in the calculations are: LB = 6 m, Hd = 5 m, h1 =
30 m, and h2 = 1 m (with LG = 0.53 m).
Figure 5 A clayey vertical dam core, with k = 2.5×10⁻⁸ m/s (adapted from Vukovic and Soro 1997).
Figure 6 Comparison between the stationary pore water pressure heads calculated with a finite element code (data from Vukovic and Soro 1997) and with the finite difference method (FLAC3D), for the clay core problem defined in Fig. 5.
Figure 7 Pore water pressure distribution along the base of the barricade obtained from the analytical solution (Eqs. [1] to [5]) and numerical modeling results (with FLAC3D), for different upstream water height h1; the other parameters are: Ld = 5 m, LB = 6 m, Hd = 5 m, h2 = 0 m,
k = 10-4 m/s.
Figure 8 Comparison between the pore water pressures calculated with the proposed analytical solution (Eq. [6]) and with FLAC3D (in symbols) along different vertical profiles within the barricade, for different upstream water height, h1; the other parameters are: Ld = 5 m, LB
= 6 m, Hd = 5 m, h2 = 0 m, k = 10-4 m/s.
Figure 9 Pore water distribution in the barricade for different upstream water pressure head, h1: (a)
Figure 10 Pore water pressure distribution for different upstream water height: a) h1 = 5 m; b) h1 = 10
m; c) h1 = 20 m; d) h1 = 30 m (other parameters are given in Table 2).
Figure 11 Pore water pressure distribution in the barricade with different water height on the downstream side h2: (a) along vertical profiles; (b) along the floor (other parameters are
given in Table 2).
Figure 12 Pore water pressure distribution in the barricade for different downstream water height: (a)
h2 = 0 m; (b) h2 = 3 m (other parameters are given in Table 2).
Figure 13 Pore water distribution in the barricade with different width, Ld: (a) along vertical profiles;
(b) along the floor (other parameters are given in Table 2).
Figure 14 Pore water distribution in the barricade with different height, Hd: (a) along vertical profiles;
(b) along the floor (other parameters are given in Table 2).
Figure 15 Pore water distribution in the barricade with different length, LB: (a) along vertical profiles;
(b) along the floor (other parameters are given in Table 2).
Figure 16 Pore water distribution in the barricade with different saturated hydraulic conductivity, k: (a) along vertical profiles; (b) along the floor (other parameters are given in Table 2). Figure 17 A representative piezometric surface; s is the height of the free surface above the water.
LIST OF TABLES
Table 1 Flow rates Q calculated with the analytical solution and obtained with FLAC3D (see Fig. 7 for details).
Table 2 Characteristics of the numerical simulations of steady-state flow in waste rock barricades performed with FLAC3D.
Table 3 Flow rates Q calculated with the analytical solution and with FLAC3D for different downstream water head h2
Table 4 Flow rates Q calculated with analytical solution and numerical modeling FLAC3D with different barricade width Ld
Table 5 Flow rates Q calculated with analytical solution and numerical modeling FLAC3D with different barricade height Hd
Table 6 Flow rates Q calculated with analytical solution and numerical modeling FLAC3D with different barricade length LB
Table 7 Flow rates Q calculated with analytical solution and numerical modeling FLAC3D with varying hydraulic property of the barricade material k.
1. INTRODUCTION
Backfilling is commonly used in underground mines all over the world. More and more, the backfill is made from waste rocks or tailings, as this practice can significantly reduce surface disposal of waste materials and the related impact to local ecosystems (Aubertin et al. 2002; Bussière 2007; Benzaazoua et al. 2008). This environmental advantage is complementary to the main purpose of stope backfilling, which is to improve rock mass stability and reduce ore dilution (e.g., Hassani and Archibald 1998; Kump 2001; Jung and Biswas 2002).
In many cases, the backfill is initially saturated with water to facilitate its transport to the underground stopes. Construction of a barricade in the drift, near the base of the stope, is then required to retain the backfill in place. Over the years, a number of barricade failures have been reported (Soderberg and Busch 1985; Grice 1998, 2001; Kuganathan 2001, 2002; Sivakugan et al. 2006a, 2006b; Helinski and Grice 2007; Yumlu and Guresci 2007); some of these can be attributed to a limited understanding of the loads involved. Such failures can lead to serious consequences such as flooding of the drifts, damage to equipment, and personnel injury or fatality. Thus, more attention must be paid to the barricade analysis and design.
Typical barricades are constructed with wood, bricks, concrete or shotcrete mesh (e.g., Sivakugan et al. 2006a, 2006b; Grabinsky et al. 2008; Grabinsky 2010; Hughes et al. 2010). These techniques are usually expensive and time consuming. In Canada, an increasingly popular practice is to use waste rock to construct the barricade. Compared with other traditional methods, the advantages of waste rock barricades include:
The barricade material (waste rock) is available at little cost;
The time for barricade construction is reduced, as the technique is simple and easy to implement; The environmental impact of waste rock can be lowered by further reducing the amount disposed
However, there are presently few solutions available for defining the size of barricades made of waste rock. Ongoing investigations indicate that barricade design requires the determination of several parameters, including the backfill pressure in the stope, the forces applied to the barricade, and the corresponding effective and total stresses distributions (e.g., Li et al. 2009; Li and Aubertin 2011). In recent years, methods have been developed to assess the stress state in backfilled stopes (Aubertin et al. 2003; Li et al. 2003, 2005; Pirapakaran and Sivakugan 2007; Fahey et al. 2009; Li and Aubertin 2009a). Water flow in stopes has also been investigated (Traves and Isaacs 1991; Bloss and Chen 1998). A few studies have also been devoted to the stress distribution in the backfilled portion of the drift near the base of the stopes (Ouellet et al. 1995; Li and Aubertin 2009b, 2009c; Thompson et al. 2009; Grabsinky 2010). Despite the progress, there is still a need to develop an engineering approach to evaluate the distribution of pore water pressure within barricades, especially for those made of waste rock. This topic is the focus of this report. In the following, the emphasis is placed on the typical response of saturated backfill (such as paste backfill made with tailings) during the first few days after filling of the stope, when water pressure has not yet dissipated.
2. PORE WATER PRESSURE IN BARRICADES
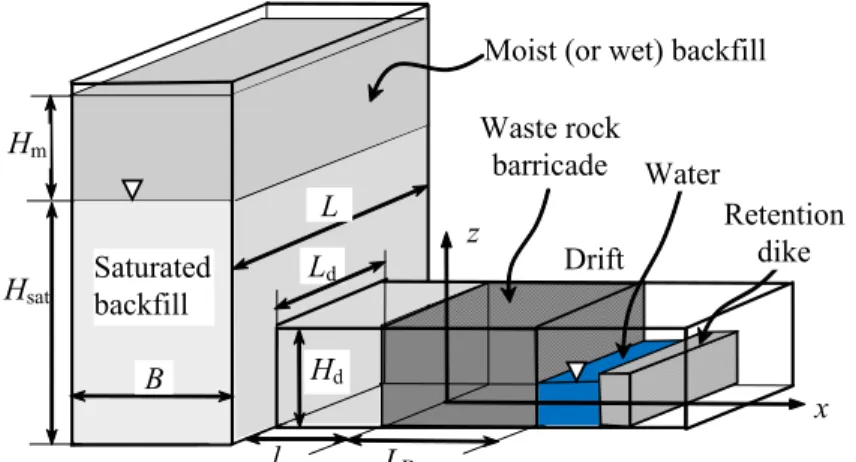
Figure 1 is a schematic view of a backfilled stope with a barricade in the drift, showing the various dimensions. When analysing the pressure induced by the backfill on the barricade, the most critical time is usually during and just after placement of the saturated fill, when it is still in a quasi-liquid state, without cohesion. In these early times, before consolidation and excess pore water pressure (∆u) dissipation can occur, the effective vertical stress in the stope can be very low (σv' ≅ 0) as the pore
water pressure u may be close to the total vertical stress (u ≅ σv). After a certain period of time, pore
water pressure dissipation leads to ∆u ≅ 0, and u may reach a pseudo-equilibrium condition (neglecting head loss due to seepage) with u ≅ γwz (γw is the unit weight of water, z is the water table height). The
pore water pressure in the stope then decreases with the progressive lowering of the phreatic surface during drainage of the backfill. Depending on the filling sequence, the pressure head h can thus exceed, temporarily, the height of the drift before drainage diminishes the water pressure.
l LB
Hsat
Hm Waste rock barricade
Ld B
Moist (or wet) backfill
L Saturated backfill Hd Drift x z Water Retention dike
Figure 1. A backfilled stope with an access drift and a waste rock barricade.
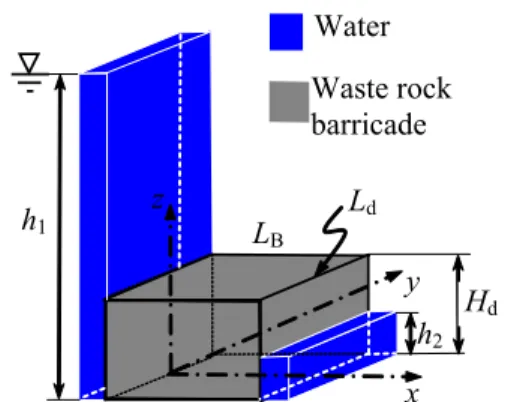
Figure 2 shows a simplified representation of water pressure head on both sides of the barricade (shown here with an idealized geometry). On the upstream side, the pressure head h1 corresponds to the
pore water pressure in the saturated backfill, without considering the effect of seepage in the fill material. On the downstream side, the head h2 can vary from 0 to Hd (the height of the drift), depending
on the geometry of the barricade and presence of a downstream reservoir with a retention dike – see Fig. 1). The pore water pressure conditions inside the barricade share some similarities with those in dams and dikes, for which the seepage has been widely investigated (e.g., Casagrande 1961; Polubarinova-Kochina 1962; Bowles 1984; Cedergren 1997; Chapuis and Aubertin 2001). However, there are two important distinctions between barricades and hydraulic dams:
[1] The barricade has a limited width, Ld (Figs. 1 and 2), so seepage through the barricade must be
[2] The pore water pressure head may be higher than the barricade height on the upstream side (Figs. 1 and 2); this means that seepage may need to be treated as a confined flow in (part of) the barricade.
The seepage in a barricade made of waste rock is assessed in the following by adapting a solution developed for the two dimensional stationary seepage in an aquifer with combined artesian-gravity flow. LB h1 Waste rock barricade Water Hd x z h2 Ld y
Figure 2. Simplified representation of the pore water pressure head on the upstream and downstream sides of the barricade.
2.1 Analytical solution for the pore water pressure along the base of the barricade
The flow in the barricade shown in Fig. 1 and 2 is analysed using a solution applied to combined confined (artesian) and unconfined (gravity) steady-state flow (e.g., Vukovic and Soro 1997; Reddi 2003). The seepage rate through the barricade is expressed as (see Fig. 2 and 3):
[1] d B 2 2 2 d 1 d 2 2 L L h H h H k Q= − − ×
where Q is the (pseudo) stationary flow rate (m3/s) through the barricade, k is the saturated hydraulic
conductivity (m/s) of the waste rock, h1 is the hydraulic head (m) on the upstream side of the barricade,
h2 is the hydraulic head (m) on the downstream side of the barricade, Hd is the barricade height (m), LB
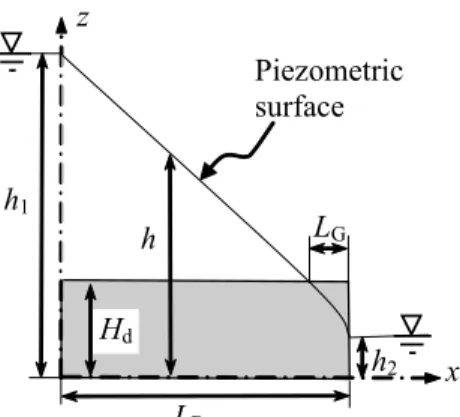
LB h1 Piezometric surface Hd x z h2 LG h
Figure 3. Two dimensional view of the confined and gravity flow model.
By considering the flow rate across the vertical section within the confined (artesian) and unconfined (gravity) flow portions of the barricade, the hydraulic head along its base can be expressed as follows: [2a]
(
1 d)
for B G G B 1 L xL h H x L L h h − ≤ − − − = [2b](
d2 22)
G G B 2 2 xLL H h for x L L h h= − − − ≥ B −where x is the distance from the upstream side of the barricade to the calculation point; LG is the
distance from the downstream side to the location where the flow changes from artesian to gravity (Fig. 3). This length is given by:
[3]
(
)
2 2 2 d 1 d 2 2 2 d B G 2HLhH H h h L − − − =As illustrated schematically in Fig. 3, Eq. [2a] represents the linear decline of the pressure head along the confined flow portion, and Eq. [2b] gives the non-linear head variation in the unconfined flow portion of the barricade. This latter component follows the typical trend (known as the Dupuit
parabola) obtained from analytical solutions developed for the steady-state flow in water retaining structures such as dams and walls (Vukovic and Soro 1997).
From Eq. [1], the seepage velocity v (in m/s) across the barricade can be expressed from Darcy’s law as follows: [4a] d B 2 2 2 d 1 d 2 2 H L h H h H k v= − − for x ≤ LB - LG [4b] h L h H h H k v B 2 2 2 d 1 d 2 2 − − = for x ≥ LB - LG
The Bernoulli equation can then be used to relate the pore water pressure, u, to the head h as follows:
[5] u = γw (h – z)
where γw is the unit weight of water in N/m3, z is the elevation in m.
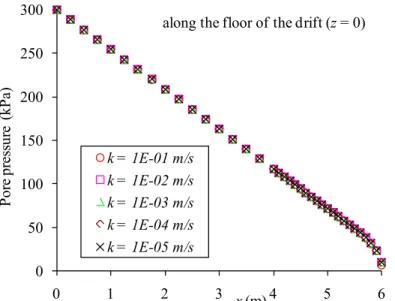
Equations [2] to [5] constitute the analytical solution proposed here for evaluating the pore water pressure u along the base of a barricade (z = 0) made of waste rock. This solution indicates that the pore water pressure distribution at the base of the barricade depends on the pressure head on both sides (which are considered constant), and the barricade characteristics. A sample application of this solution is presented in Figure 4. This figure illustrates how the pore pressure at the base of the barricade drops along the direction of the flow, in the confined (linear distribution) and unconfined (non linear distribution) portions. The calculations have been performed with the parameters given in the figure caption. Various values of the saturated hydraulic conductivity k have been used; the results indicate that the pressure head distribution does not depend on k.
2.2 Numerical modelling of pore water pressure in barricades
To further analyse seepage, the water flow through three dimensional barricades is modelled in the following using the finite difference code FLAC3D (Itasca 2006). Again, a steady flow is assumed (which is usually a conservative assumption – see discussion below). A somewhat similar problem has been solved numerically, with the finite element method, by Vukovic and Soro (1997), who simulated the 2D unconfined flow through a thick wall (or vertical core in a dam). Their results are used below to validate (in part) calculations performed with FLAC3D.
0 50 100 150 200 250 300 0 1 2 3 4 5 6 Po re p re ss ur e (k Pa ) x (m) k = 1E-01 m/s k = 1E-02 m/s k = 1E-03 m/s k = 1E-04 m/s k = 1E-05 m/s
along the floor of the drift (z = 0)
Figure 4. Distribution of pore water pressure in a barricade calculated with the proposed analytical solution. The pressure is given along the floor of the drift for different k (hydraulic conductivity) values. The parameters used in the calculations are: LB = 6 m, Hd = 5 m, h1 = 30 m, and h2 = 1 m (with
LG = 0.53 m).
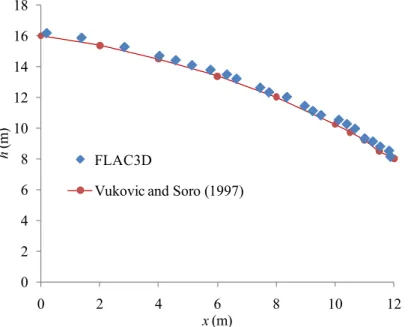
Figure 5 shows a clayey dam core seated on an impervious basis, with a hydraulic conductivity k of 2.5×10⁻⁸ m/s. Figure 6 shows the comparison between the pore water pressure heads calculated by
Vukovic and Soro (1997), with a finite element code, and those obtained with FLAC3D. It is seen that the two simulations give almost identical results. It is interesting to note here that the calculated head at the downstream boundary (i.e. piezometric line at the seepage face along the core), is higher (h ≅ 8 m)
than the value imposed as a boundary condition outside the core (h2 = 2 m); this aspect, which is
relevant for the analytical solution presented above, will be discussed further below.
12 m 16 m Water table x z 2 m Seep ag e fac e 17.5 m
Figure 5. A clayey vertical dam core, with k = 2.5×10⁻⁸ m/s (adapted from Vukovic and Soro 1997).
0 2 4 6 8 10 12 14 16 18 0 2 4 6 8 10 12 h (m) x(m) FLAC3D
Vukovic and Soro (1997)
Figure 6. Comparison between the stationary pore water pressure heads calculated with a finite element code (data from Vukovic and Soro 1997) and with the finite difference method (FLAC3D), for
the clay core problem defined in Fig. 5.
The flow rate has also been calculated with FLAC3D. A value of Q = 2.62×10⁻⁷ m3/s/m (given per
meter of drift width), while Vukovic and Soro (1997) arrived at a value of 2.6×10⁻⁷ m3/s/m for the two
These results (and others) tend to demonstrate that FLAC3D is well adapted to simulate the steady-state flow across such type of water retaining structures. In the following, a series of simulations are performed to help validate the analytical solution proposed above and to evaluate the seepage characteristics across three dimensional barricades for different conditions. The selected reference geometry is: Ld = 5 m, LB = 6 m, Hd = 5 m, h1 = 30 m, h2 = 0 m, while the properties of the waste rocks
are: k = 10-4 m/s and porosity n = 0.3. Additional model parameters, including the water bulk modulus
and waste rock dry density were also introduced into FLAC3D, but these do not influence the results (see details in the manual from Itasca 2006).
2.3 Comparison between numerical and analytical solutions
The FLAC3D numerical model is used to assess the validity of the solution given by Eqs. [1] to [5], by evaluating if the latter correctly predicts the pore water pressure distribution and flow rate in barricades.
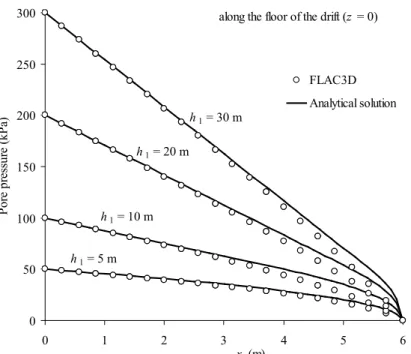
Comparisons of pore pressure distributions at the base of barricades are shown in Figure 7 (for the conditions given in the caption). It is seen that the correlation is very good for the entire barricade length, except for a relatively small difference (~15%) downstream where the analytical solution tends to overestimate somewhat the pore water pressure. This solution becomes more conservative (i.e. with higher u values) when the upstream head h1 is increased.
Comparisons are also made between the flow rates calculated with the analytical solution and the numerical simulations performed with FLAC3D. Results in Table 1 show the flow rate Q for the 4 cases described in Fig. 7; it is seen that the values are very close in all cases.
0 50 100 150 200 250 300 0 1 2 3 4 5 6 x (m) Po re p re ss ure (k Pa ) FLAC3D Analytical solution along the floor of the drift (z = 0)
h1 = 30 m
h1 = 20 m
h1 = 10 m
h1 = 5 m
Figure 7. Pore water pressure distribution along the base of the barricade obtained from the analytical solution (Eqs. [1] to [5]) and numerical modeling results (with FLAC3D), for different upstream water
height h1; the other parameters are: Ld = 5 m, LB = 6 m, Hd = 5 m, h2 = 0 m, k = 10-4 m/s.
Table 1. Flow rates Q calculated with the analytical solution and obtained with FLAC3D (see Fig. 7 for details).
Analytical solution (Eq. [1]) FLAC3D
h1 (m) --- Q3D (m3/s) Q3D (m3/day) Q3D (m3/s) Q3D (m3/day) 5 1.04E-03 90 1.04E-03 90 10 3.13E-03 270 3.12E-03 270 20 7.29E-03 630 7.30E-03 631 30 1.15E-02 990 1.15E-02 990
3. PORE WATER PRESSURE WITHIN THE BARRICADE
The comparison between the analytical and numerical solutions showed above indicates that the proposed solution (Eqs. [1] to [5]) predicts quite well the flow rate and pore water pressure along the base of the drift (at z = 0).
Additional results obtained with the numerical simulations (presented below) also indicate that the pore water pressure distribution in barricades made of waste rock varies almost linearly along the
vertical profiles on the upstream portion (when x ≤ LB – LG). Near the downstream part, the pore water
pressure is better represented by a nonlinear distribution along the vertical axis. Based on the analytical solutions presented above for the pore water pressure at the base of the barricade, the following relationships are proposed:
[6a]
(
1 d)
for B G G B 1 w h L xL h H z x L L u ≤ − − − − − =γ [6b](
)
G 2 / 1 2 2 2 d G B 2 2 w h xLL H h z for x L L u ≥ B − − − − − =γComparisons of pore water pressures calculated with the proposed solution (Eq. [6]) and obtained from modelling for three vertical profiles are shown in Figure 8 (where pressure decreases from left to right, due to seepage head loss). It can be seen that the correlation is very good in the upstream region of the barricade, but that some differences exist in the downstream part, especially for a large head upstream. Despite these (relatively small) discrepancies, the proposed solution is deemed satisfactory for most purposes, and can thus be used to estimate the pore water pressure distribution in barricades made of waste rock.
3.1 Parametric Analyses of Pore Pressure Distribution
In the following, various influencing factors that affect the pore water pressure distribution within the barricade (over the full height of the drift) are investigated using simulations performed with FLAC3D. Table 2 presents the details with the specific conditions and properties used, together with the corresponding figures.
0 1 2 3 4 5 0 50 100 150 200 250 z( m) Pressure (kPa) h1 = 5 m h1 = 10 m h1 = 20 m h1 = 30 m Eq. [6] at x = LB/4 (a) 0 1 2 3 4 5 0 50 100 150 200 z( m) Pressure (kPa) h1 = 5 m h1 = 10 m h1 = 20 m h1 = 30 m Eq. [6] at x = LB/2 (b) 0 1 2 3 4 5 0 20 40 60 80 100 z( m) Pressure (kPa) h1 = 5 m h1 = 10 m h1 = 20 m h1 = 30 m Eq. [6] at x = 3LB/4 (c)
Figure 8. Comparison between the pore water pressures calculated with the proposed analytical solution (Eq. [6]) and with FLAC3D (in symbols) along different vertical profiles within the barricade,
for different upstream water height, h1; the other parameters are: Ld = 5 m, LB = 6 m, Hd = 5 m, h2 = 0
m, k = 10-4 m/s.
Table 2. Characteristics of the numerical simulations of steady-state flow in waste rock barricades performed with FLAC3D.
Figures h1 (m) h2 (m) Ld (m) Hd (m) LB (m) k (m/s) 9 and 10 var 0 5 5 6 1×10⁻⁴ 11 and 12 30 var 5 5 6 1×10⁻⁴ 13 30 0 var 5 6 1×10⁻⁴ 14 30 0 5 var 6 1×10⁻⁴ 15 30 0 5 5 var 1×10⁻⁴ 16 30 0 5 5 6 var
3.1.1 Effect of boundary conditions
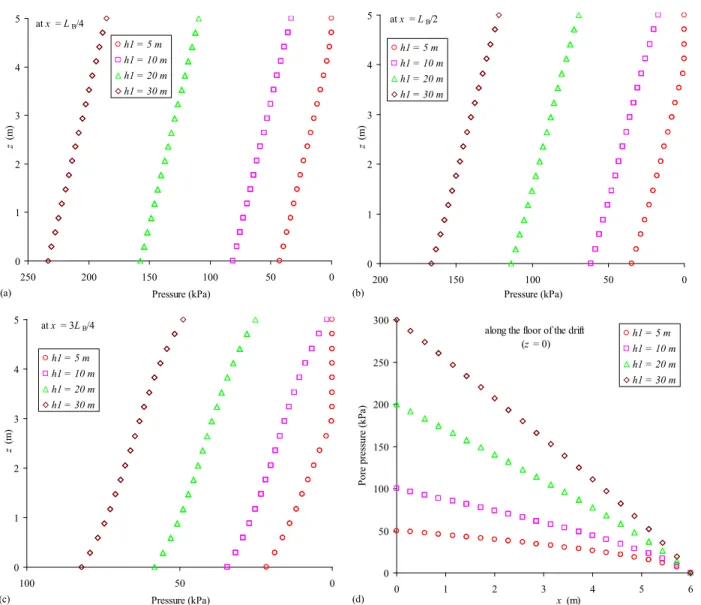
Figures 9 and 10 show the pore water pressure distributions obtained with FLAC3D when the water pressure head on the upstream side, h1, varies from 5 to 30 m (other conditions remain
unchanged; see Table 2). Again on this (and other) figure, the pore water pressure along the x axis decreases from left to right, according to the direction of the flow (due to head loss). It is seen that an increase in upstream head increases the pore water pressure across the vertical profiles (Figs. 9a-c) and along the floor of the drift (Fig. 9d). It is seen also that the water pressure distribution along the floor is nonlinear when the upstream water pressure head h1 is small. The results also show that the rate of
pressure drop along the barricade rises with an increase of the h1 value (Fig. 9d). When the upstream
water pressure head, h1, is equal to the height of the barricade, i.e. h1 = Hd (= 5 m), most of the upper
part of the barricade become unsaturated, or ‘dry’ in this case (Fig. 10a). It should be recalled here that unsaturated water flow is not taken into account in these calculations (i.e. v = 0 and u = 0 above the phreatic surface); available methods to incorporate unsaturated flow conditions in numerical simulations have been described elsewhere (e.g., Chapuis et al. 2001; Chapuis and Aubertin 2001) and will not be addressed here.
The numerical results also show that when the upstream water pressure head h1 increases (> Hd),
the artesian pressure head rises in the barricade, as shown in Figure 10; this corresponds to a decrease of the length LG.
Table 1 already showed that the flow rate through the barricade increases significantly with a rise in the upstream head h1.
The influence of the downstream water height, h2, on the pore water pressure distribution is shown
in Figures 11 and 12. It is seen that the pore water pressure near the base of the barricade is affected (Fig. 11) only slightly when the downstream head h2 increases (from 0 to 3 m); this is accompanied by
addition of a retention dike downstream from the barricade does not affect its response (and design) significantly. Nonetheless, an increase of the water head on the downstream side tends to decrease the flow rate Q across the barricade, as indicated in Table 3. This table also shows that the analytical and numerical values of Q are quite close to each other.
0 1 2 3 4 5 0 50 100 150 200 250 Pressure (kPa) z (m) h1 = 5 m h1 = 10 m h1 = 20 m h1 = 30 m at x = LB/4 (a) 0 1 2 3 4 5 0 50 100 150 200 Pressure (kPa) z (m) h1 = 5 m h1 = 10 m h1 = 20 m h1 = 30 m at x = LB/2 (b) 0 1 2 3 4 5 0 50 100 Pressure (kPa) z (m) h1 = 5 m h1 = 10 m h1 = 20 m h1 = 30 m at x = 3LB/4 (c) 0 50 100 150 200 250 300 0 1 2 3 4 5 6 x (m) Po re p re ss ure (k Pa ) h1 = 5 m h1 = 10 m h1 = 20 m h1 = 30 m along the floor of the drift
(z = 0)
(d)
Figure 9. Pore water distribution in the barricade for different upstream water pressure head, h1: (a) to
Table 3. Flow rates Q calculated with the analytical solution and with FLAC3D for different downstream water head h2
Analytical solution (Eq. [1]) FLAC3D
h2 (m) --- Q3D (m3/s) Q3D (m3/day) Q3D (m3/s) Q3D (m3/day) 0 1.15E-02 990 1.15E-02 990 1 1.14E-02 986 1.14E-02 987 2 1.13E-02 976 1.13E-02 976 3 1.11E-02 958 1.11E-02 957
3.1.2 Size of the barricade
Figure 13 shows the influence of the barricade width, Ld, on the distribution of pore water pressure
along vertical profiles along its length (Fig. 13a), as well as on the floor along the drift axis (Fig. 13b). It can be seen that, for the conditions imposed (i.e. constant pressure head and hydraulic gradient), the drift width does not influence the pore water pressure distribution in the barricade. However, the flow rate (see Table 4) directly depends on the width of the drift (as expected from Eq. [1]).
Figure 10. Pore water pressure distribution for different upstream water height: a) h1 = 5 m; b) h1 = 10
Table 4. Flow rates Q calculated with analytical solution and numerical modeling FLAC3D with different barricade width Ld
Analytical solution (Eq. [1]) FLAC3D
Ld (m) --- Q3D (m3/s) Q3D (m3/day) Q3D (m3/s) Q3D (m3/day) 5 1.15E-02 990 1.15E-02 990 10 2.29E-02 1980 2.30E-02 1987 20 4.58E-02 3960 4.58E-02 3957 40 9.17E-02 7920 9.18E-02 7932 0 1 2 3 4 5 0 50 100 150 200 250 Pressure (kPa) z (m) h2 = 0 m h2 = 1 m h2 = 2 m h2 = 3 m at x = L B /2 at x = L B /4 at x = 3 L B /4 (a) 0 50 100 150 200 250 300 0 1 2 3 4 5 6 x (m) Po re p re ss ure (k Pa ) h2 = 0 m h2 = 1 m h2 = 2 m h2 = 3 m along the floor of the drift
(z = 0)
(b)
Figure 11. Pore water pressure distribution in the barricade with different water height on the downstream side h2: (a) along vertical profiles; (b) along the floor (other parameters are given in Table
2).
Figure 12. Pore water pressure distribution in the barricade for different downstream water height: (a)
0 1 2 3 4 5 0 50 100 150 200 250 Pressure (kPa) z (m) Ld = 5 m Ld = 10 m Ld = 20 m Ld = 40 m at x = L B /2 at x = L B /4 at x = 3 L B /4 (a) 0 50 100 150 200 250 300 0 1 2 3 4 5 6 x (m) Po re p re ss ure (k Pa ) Ld = 5 m Ld = 10 m Ld = 20 m Ld = 40 m along the floor of the drift
(z = 0)
(b)
Figure 13. Pore water distribution in the barricade with different width, Ld: (a) along vertical profiles;
(b) along the floor (other parameters are given in Table 2).
Figure 14 shows how the barricade height, Hd, affects the pore water pressure distribution. It is
seen that u is not much affected by the height near the upstream boundary and along the floor of the barricade (Fig. 14b). However, in the downstream portion, the pore water pressure in the barricade at a given elevation z tends to increase with the barricade height (Fig. 14a). Also, other conditions being equal, the pore water pressure at the top of the barricade decreases with an increase of its height (Fig. 14a). With a higher barricade, the drainage condition can be improved because the flow rate increases with an increase in height Hd, as shown in Table 5.
Table 5. Flow rates Q calculated with analytical solution and numerical modeling FLAC3D with different barricade height Hd
Analytical solution (Eq. [1]) FLAC3D
Hd (m) --- Q3D (m3/s) Q3D (m3/day) Q3D (m3/s) Q3D (m3/day) 3 7.13E-03 616 7.12E-03 615 4 9.33E-03 806 9.34E-03 807 5 1.15E-02 990 1.15E-02 990 6 1.35E-02 1166 1.35E-02 1166
0 1 2 3 4 5 6 0 50 100 150 200 250 Pressure (kPa) z (m) Hd = 3 m Hd = 4 m Hd = 5 m Hd = 6 m at x = L B /2 at x = L B /4 at x = 3 L B /4 (a) 0 50 100 150 200 250 300 0 1 2 3 4 5 6 x (m) Po re p re ss ure (k Pa ) Hd = 3 m Hd = 4 m Hd = 5 m Hd = 6 m along the floor of the drift
(z = 0)
(b)
Figure 14. Pore water distribution in the barricade with different height, Hd: (a) along vertical profiles;
(b) along the floor (other parameters are given in Table 2).
The influence of the barricade length, LB, on the distribution of pore water pressure is shown in
Figure 15. It is seen that the shape of the pore water pressure distribution along the floor remains unchanged (Fig. 15b). However, there is no clear tendency regarding the effect of LB on the vertical
profiles (Fig. 15a). For example, the pore water pressure along the vertical profile at x = LB/2 tends to
increase when the barricade length LB goes from 2 m to 6 m, but u seems to decreases when LB exceeds
6 m. On the other hand, the flow rate decreases linearly with the barricade length LB (Table 6; see also
Eq. [1]). Thus, a longer barricade may slow down drainage of the stope.
Table 6. Flow rates Q calculated with analytical solution and numerical modeling FLAC3D with different barricade length LB
Analytical solution (Eq. [1]) FLAC3D
LB (m) --- Q3D (m3/s) Q3D (m3/day) Q3D (m3/s) Q3D (m3/day) 2 3.44E-02 2970 3.44E-02 2972 4 1.72E-02 1485 1.72E-02 1486 6 1.15E-02 990 1.15E-02 990 8 8.59E-03 743 8.60E-03 743
3.1.3 Hydraulic conductivity
Figure 16 shows the pore water pressure distributions when the saturated hydraulic conductivity k is increased from 10-5 m/s to 10-1 m/s. It is seen that varying the k value does not affect the distribution.
It does however affect the flow rate Q through the barricade; this rate increases from 1.15×10⁻³ m3/s to
11.5 m3/s when k goes from 10-5 m/s to 10-1 m/s (see Table 7) - the change is thus directly proportional
as expected from Eq. [1].
Table 7. Flow rates Q calculated with analytical solution and numerical modeling FLAC3D with varying hydraulic property of the barricade material k
Analytical solution (Eq. [1]) FLAC3D
k (m/s) --- Q3D (m3/s) Q3D (m3/day) Q3D (m3/s) Q3D (m3/day) 10-5 1.15E-03 99 1.15E-03 99 10-4 1.15E-02 990 1.15E-02 990 10-3 1.15E-01 9900 1.15E-01 9901 10-2 1.15E+00 99000 1.15E+00 99014 10-1 1.15E+01 990000 1.15E+01 990144 0 1 2 3 4 5 0 50 100 150 200 250 Pressure (kPa) z (m) LB = 2 m LB = 4 m LB = 6 m LB = 8 m at x = L B /2 at x = L B /4 at x = 3 L B /4 (a) 0 50 100 150 200 250 300 0 0.2 0.4 0.6 0.8 1 x /LB Po re p re ss ure (k Pa ) LB = 2 m LB = 4 m LB = 6 m LB = 8 m along the floor of the drift
(z = 0)
(b)
Figure 15. Pore water distribution in the barricade with different length, LB: (a) along vertical profiles;
In this case, as in all the other cases analysed here, the flow rate calculated with the analytical solution (Eq. [1]) correlates very well with the value obtained from FLAC3D (see Tables 1, 3 to 7). This good agreement further confirms the validity of the calculation approaches adopted here (considering the assumptions presented above and discussed further below).
4. DISCUSSION
The 3D analytical solution presented above was obtained by adapting a two dimensional steady-state flow solution developed for aquifers with both confined and unconfined conditions (e.g., Vukovic and Soro 1997; Reddi 2003). This solution can be applied for assessing the pore water pressure, which is a requirement for the design of barricade made of waste rock (as shown in Li and Aubertin 2011).
0 1 2 3 4 5 0 50 100 150 200 250 Pressure (kPa) z (m) k = 1E-05 m/s k = 1E-04 m/s k = 1E-03 m/s k = 1E-02 m /s k = 1E-01 m/s at x = L B /2 at x = L B /4 at x = 3 L B /4 (a) 0 50 100 150 200 250 300 0 1 2 3 4 5 6 x (m) Po re p re ss ure (k Pa ) k = 1E-05 m/s k = 1E-04 m/s k = 1E-03 m/s k = 1E-02 m/s k = 1E-01 m/s along the floor of the drift
(z = 0)
(b)
Figure 16. Pore water distribution in the barricade with different saturated hydraulic conductivity, k: (a) along vertical profiles; (b) along the floor (other parameters are given in Table 2).
In the sample calculations presented above, the analytical solution was applied for constant water pressure head (h1 and h2) on the upstream and downstream sides. In practice, h1 is expected to change
deposition sequence, when the fill is initially placed in the stope, addition of ‘layers’ of saturated backfill usually leads to a temporary build up of excess pore pressure, which in turn leads to very small effective stresses (σv' ≅ 0 as u ≅ σv ). There is no arching effect in the stope and drift under these
conditions, at these early times, as the backfill behaves like a viscous liquid. In such cases, the pore water pressure head on the upstream side of the barricade can be calculated as (for z =0):
[7] h1 Hsat w sat γ γ =
Once consolidation has progressed enough, the excess pore water pressure, ∆u, in the backfill becomes nil. The backfill then gains its frictional shear strength (as σ'v> 0), while the water pressure
head h1 tends toward Hsat. But the water pressure head h1 continues to decrease over time due to further
water drainage from the stope, across the barricade. This type of behaviour, which has been observed in the field (Grabinsky 2010), has recently been assessed using numerical simulations (El Mkadmi et al. 2011a,b) that illustrate how pressures evolve during and after fill placement in stopes. The solutions proposed above can be used to estimate the pore water for these different conditions (or difference stages) during consolidation and drainage. The analytical solution can thus be quite useful to assess, in a preliminary manner, seepage in the barricade.
Some additional works are nonetheless required to further improve the solutions. For instance, in the downstream part of the barricade, comparisons between analytical and numerical results have shown that the pore water pressure could be better evaluated with the former. This could be accomplished by considering the true seepage free surface, which is higher than the water pressure head h2 on the downstream side of the barricade, as shown schematically in Figure 17. Similar
reservations have been raised for unconfined flow conditions associated with seepage in clay core of dams and in a vertical-wall partition (e.g., Vukovic and Soro 1997). The need to make such a correction was addressed by Chapman (1956), Polubarinova-Kochina (1962) and Reddi (2003).
Another correction that could help improve the analytical solution would be to consider the nonlinearity of the vertical pore water pressure distribution within the barricades. Unsaturated flow conditions (i.e. Chapuis et al. 2001; Chapuis and Aubertin 2001) could also be taken into account, although this is not expected to be a major factor for seepage in coarse-grained waste rock (but it is certainly a key aspect for the fine-grained backfill response – as will be shown elsewhere). And because barricades made of waste rock are usually trapezoidal, instead of rectangular, the solution could be adapted to a more realistic geometry. These aspects, and others, are part of the ongoing investigation being conducted by the Authors (and co-workers) on the development of simple and practical analytical solutions. The present study also includes simulations of the transient behaviour of backfilled stopes and drift, considering the effect of filling rate, consolidation, drainage, and cementation on the evolution of pore water pressure and stress state near and inside the barricade; these results will also be presented elsewhere. Nonetheless, despite these limitations, the solutions presented here are deemed satisfactory (i.e. conservative) for most engineering applications on the analysis and design of backfilled stopes and barricades.
LB h1 Piezometric surface Hd x z h2 LG h s
5. CONCLUSION
A steady-state solution has been proposed for estimating the flow rate in barricades made of waste rock and the pore water pressure distribution at the base and within the barricade. The results from sample calculations with the analytical solution show that the pore water pressure varies linearly with the distance from the upstream side, at a given elevation, in the confined (artesian) flow part of the barricade. The variation becomes nonlinear in the unconfined (gravity) flow section, near the downstream face of the barricade. These results are confirmed by those obtained from numerical calculations performed with FLAC3D. The results further show that the hydraulic conductivity of the waste rock does not influence the pore water pressure distribution, but it affects (linearly) the flow rate in the barricade. The various comparisons between results obtained with the analytical solution and from the numerical simulations further demonstrate that the proposed solution can be used to assess the pore water pressure distribution and flow rate in barricades.
ACKNOWLEDGEMENT
The simulations with FLAC3D were performed when the first author was working for GENIVAR LP. The first author acknowledges the financial support from École de technologie supérieure de l’Université du Québec. The authors also received financial support from the Industrial NSERC Polytechnique-UQAT Chair on Environment and Mine Wastes Management (http://www.polymtl.ca/enviro-geremi/).
REFERENCES
Aubertin, M., Bussière, B., and Bernier, L. 2002. Environnement et gestion des rejets miniers. Manual on CD-ROM, Presses Internationales Polytechniques.
Aubertin M., Li, L., Arnoldi, S., Belem, T., Bussière, B., Benzaazoua, M., and Simon, R. 2003. Interaction between backfill and rock mass in narrow stopes. In Soil and Rock America 2003, Cambridge, Mass., 22-26
June 2003. Edited by P.J. Culligan, H.H. Einstein, A.J. Whittle. VERLAG GÜCKAUF GMBH (VGE), ESSEN. Vol. 1, pp. 1157-1164.
Benzaazoua, M., Bussière, B., Demers, I., Aubertin, M., Fried, É., and Blier, A. 2008. Integrated mine tailings management by combining environmental desulphurization and cemented paste backfill: Application to mine Doyon, Quebec, Canada. Minerals Engineering, 21: 330–340.
Bloss, M.L., and Chen, J. 1998. Drainage research at Mount Isa Mines limited 1992–1997. In Proceedings of 6th International Symposium on Mining with Backfill: Minefill ’98, Australia Edited by M. Bloss. AusIMM, pp. 111–116.
Bowles, J.E. 1984. Physical and geotechnical properties of soils. 2nd ed. McGraw-Hill, New York.
Bussière, B. 2007. Colloquium 2004: Hydro-geotechnical properties of hard rock tailings from metal mines and emerging geo-environmental disposal approaches. Canadian Geotechnical Journal, 44(9): 1019–1052.
Casagrande, A. 1961. Control of seepage through foundations and abutments of dams. Géotechnique, 11:
161-181.
Cedergren, H.R. 1997. Seepage, drainage and flow nets. 3rd ed., John Wiley & Sons, New York.
Chapman, T.G. 1956. Ground water flow to trenches and well points. Journal of the Institution of Engineers, Australia, 28: 275-280.
Chapuis, R.P., and Aubertin, M. 2001. A simplified method to estimate saturated and unsaturated seepage through dikes under steadystate conditions. Canadian Geotechnical Journal, 38: 1321–1328.
Chapuis, R.P., Chenaf, D., C., Bussière, B., Aubertin, M., and Crespo, R. 2001. A user's approach to assess numerical codes for saturated and unsaturated seepage conditions. Canadian Geotechnical Journal, 38(5):
1113-1126.
El Mkadmi, N., Aubertin, M., and Li, L. 2011a. The effect of transient drainage on the stress state in backfilled mine stopes. In Proceeding of the 2011 Pan-Am CGS Geotechnical Conference, 2-6 October 2011, Toronto, Ontario, Canada.
El Mkadmi, N., Aubertin, M., and Li, L. 2011b. Numerical analysis of the early response of paste backfill in a vertical stope. In Mines without borders, CIM Conference & Exhibition, 22-25 May 2011, Montreal, Quebec, Canada.
Fahey, M., Helinski, M., and Fourie, A. 2009. Some aspects of the mechanics of arching in backfilled stopes. Canadian Geotechnical Journal, 46: 1322-1336.
Grabinsky, M.W. 2010. Keynote address - In situ monitoring for groundtruthing paste backfill designs. In Proceedings of the 13th International Seminar on Paste and Thickened Tailings Toronto, Canada, May 3-6, 2010.
Grabinsky, M.W., Bawden, W.F., and Thompson, B. 2008. Back-analysis of barricade performance for a paste filled stope. In Proceedings of Symposium on Mines and the Environment, Rouyn-Noranda. CIM, pp. 162-174.
Grice, T. 1998. Stability of hydraulic backfill barricades. In MineFill'98: Proceedings of the 6th International Symposium on Mining and Backfill, Brisbane, Australia. Edited by M. Bloss. AusIMM, pp. 117-120. Grice, T. 2001. Recent mine developments in Australia. In MineFill'2001: Proceedings of the 7th International
Symposium on Mining with Backfill, Seattle, Wash., 17-19 September 2001. Edited by D. Stone. Society for Mining, Metallurgy and Exploration, Littleton, Colo., pp. 351-357.
Hassani, F., and Archibald, J.F. 1998. Mine backfill. CIM, CD-ROM.
Helinski, M., and Grice, A.G. 2007. Water management in hydraulic fill operations. In Proceedings of the 9th International Symposium in Mining with Backfill, Montreal, Que., 29 April - 2 May 2007. [CD-ROM]. Canadian Institute of Mining, Metallurgy and Petroleum (CIM), Montreal, Que.
Hughes, P.B., Pakalnis, R., Hitch, M., and Corey, G. 2010. Composite paste barricade performance at Goldcorp Inc. Red Lake Mine, Ontario, Canada. International Journal of Mining, Reclamation and Environment,
24(2): 138-150.
Itasca 2006. FLAC3D: Fast Lagrangian Analysis of Continua in 3 Dimensions. Itasca Consulting Group, Inc. Minneapolis.
Jung, S.J., and Biswas, K. 2002. Review of current high density paste fill and its technology. Mineral Resources Engineering, 11(2): 165-182.
Kuganathan, K. 2001. Mine backfilling, backfill drainage and bulkhead construction - a safety first approach. Australia’s Mining Monthly, February, 58-64.
Kuganathan, K. 2002. A method to design efficient mine backfill drainage systems to improve safety and stability of backfill bulkheads and fills. In Proceedings of the 8th AusIMM Underground Operators Conference: Growing our Underground Operations, Townville, QLD, Australia, 29-31 July 2002, Australasian Institute of Mining and Metallurgy Publication Series, No. 5, pp. 181-188. Australasian Institute of Mining and Metallurgy, Carleton, Victoria, Australia.
Li, L., and Aubertin, M. 2009a. A three-dimensional analysis of the total and effective stresses in submerged backfilled stopes. Geotechnical and Geological Engineering: An International Journal, 27(4): 559–569.
Li, L., and Aubertin, M. 2009b. Horizontal pressure on barricades for backfilled stopes. Part I: Fully drained conditions. Canadian Geotechnical Journal, 46(1): 37-46.
Li, L., and Aubertin, M. 2009c. Horizontal pressure on barricades for backfilled stopes. Part II: Submerged conditions. Canadian Geotechnical Journal, 46(1): 47-56.
Li, L., and Aubertin, M. 2011. Limit equilibrium analysis for the design of backfilled stope barricades made of waste rock. Canadian Geotechnical Journal (submitted).
Li, L., Aubertin, M., Simon, R., Bussière, B., and Belem, T. 2003. Modeling arching effects in narrow backfilled stopes with FLAC. In Proceedings of 3rd International Symposium on FLAC and FLAC3D Numerical Modeling in Geomechanics, Sudbury. Edited by R. Brummer, P. Andreux, C. Detournay, R. Hart. A.A.Balkema Publishers, pp. 211-219.
Li, L., Aubertin, M., and Belem T. 2005. Formulation of a three dimensional analytical solution to evaluate stress in backfilled vertical narrow openings. Canadian Geotechnical Journal, 42(6): 1705-1717.
Li, L., Ouellet, S., and Aubertin, M. 2009. A method to evaluate the size of backfilled stope barricades made of waste rock. In GeoHalifax’2009: 62nd Canadian Geotechnical Conference and 10th Joint CGS/ IAH-CNC Groundwater Specialty Conference, 20-24 September 2009, Halifax, Nova Scotia. Canadian Geotechnical Society, pp. 497-503.
Ouellet, J., Bussière, B., and Gagnon, G. 1995. Simulation numérique du remblayage d'un chantier de mine avec du remblai hydraulique cimenté: élaboration du modèle. In CAMI'95: Proceeding of the 3rd Canadian Conference on Computer Applications in the Mineral Industry, 22-25 October 1995, Montreal, Quebec, Canada. Edited by H.S. Mitri, pp. 331-339.
Reddi, L.N. 2003. Seepage in soils: Principles and application. John Wiley & Sons, Inc., Hoboken, New Jersey. Pirapakaran, K., and Sivakugan, N. 2007. Arching within hydraulic fill stopes. Geotechnical and Geological
Engineering, 25(1): 25-35.
Polubarinova-Kochina, Y.P. 1962. Theory of ground water movement. Princeton University Press, Princeton, NJ.
Sivakugan, N., Rankine, K., and Rankine, R. 2006a. Permeability of hydraulic fills and barricade bricks. Geotechnical and Geological Engineering, 24: 661–673.
Sivakugan, N., Rankine, R.M., Rankine, K.J., and Rankine, K.S. 2006b. Geotechnical considerations in mine backfilling in Australia. Journal of Cleaner Production, 14: 1168-1175.
Soderberg, R.L., and Busch, R.A. 1985. Bulkheads and drains for high sandfill stopes. Report of Investigations 8959, United States Bureau of Mines, Spokane, Wash.
Thompson, B.D., Counter, D.B., Grabinsky, M.W., and Bawden, W.F. 2009. In-situ measurements of cemented paste backfill in long-hole stopes. In Proceedings of the 3rd Canada – US Rock Mechanics Symposium and 20th Canadian Rock Mechanics Symposium, Toronto, May 2009.
Traves, W.H., and Isaacs, L.T. 1991. Three dimensional modeling of fill drainage in mine stopes, Transactions of Institution of Mining and Metallurgy (Section A: Mining Industry), 100: A66–A72.
Vukovic, M., and Soro, A. 1997. Groundwater dynamics – Steady flow. (Translated by D. Miladinov), Water Resources Publications, LLC, Colorado.
Yumlu, M., and Guresci, M. 2007. Paste backfill bulkhead monitoring – A case study from Inmet's Cayeli mine, Turkey. In Proceedings of the 9th International Symposium in Mining with Backfill, Montreal, Que., 29 April - 2 May 2007. CIM, CD-ROM.