HAL Id: hal-02281336
http://hal.univ-nantes.fr/hal-02281336
Submitted on 23 Feb 2021
Arthur Levy, Pascal Hubert
To cite this version:
Arthur Levy, Pascal Hubert. Vacuum-bagged composite laminate forming processes: Predicting thick-ness deviation in complex shapes. Composites Part A: Applied Science and Manufacturing, Elsevier, 2019, 126, pp.105568. �10.1016/j.compositesa.2019.105568�. �hal-02281336�
2 3 4 5 6 7 8 9 10 11 12 13 14 15 16 17 18 19 20 21 22 23 24 25 26 27 28 29 30 31 32 33 34 35 36 37 38 39 40 41 42 43 44 45 46 47 48 49 50 51 52 53
Vacuum-Bagged Composite Laminate Forming
Processes: Predicting Thickness Deviation in Complex
Shapes
Arthur Levy
1, a)and Pascal Hubert
21Laboratoire de Thermique et Energie de Nantes (LTEN), Nantes, France. 2McGill University, Montreal, QC, Canada
a) Corresponding author: [email protected]
Abstract. This paper focuses on the manufacturing of composite laminates using
vacuum-bag processes. When forming complex shapes, such as corners, the laminate thickness may deviate from the nominal thickness obtained for flat plates. This is due to two phenomena that occur in corners: (i) because of the geometry, the available
consolidation pressure differs from the expected pressure; and (ii) friction may prevent adequate conformation of the laminate to the mould. The thickness deviation is associated with defects (porosity, dry or resin-rich areas or fibre wrinkling). We propose an analytical model to describe these two phenomena, which relies only on two geometric ratio: radius
5 6 7 8 9 10 11 12 13 14 15 16 17 18 19 20 21 22 23 24 25 26 27 28 29 30 31 32 33 34 35 36 37 38 39 40 41 42 43 44 45 46 47 48 49 50 51 52
to flange length and thickness to radius, and two material properties: bulk factor and inter
ply friction coefficient. The model estimation was compared to an extensive experimental database including a variety of configurations: male or female tools and various flange lengths, weavings and corner radii.
Keywords: A. Prepreg B. Defects C. Analytical modelling D. Out-of-autoclave processing 1 INTRODUCTION
Composite materials, which offer good specific properties, have superseded traditional metallic materials in a number of sectors, particularly transport. Load bearing structures are typically manufactured in the form of laminates, using a stack of continuous fibres in the form of unidirectional or woven plies. In vacuum-bag processes, which include autoclave and out-of-autoclave processes, the plies are stacked manually or automatically onto a rigid mould. The setup is then put under vacuum using a consumable vacuum system (i.e., breather, peel plies, vacuum bag) and other bagging elements like pressure intensifiers or caul plates. When the stack conforms correctly to potentially complex moulds, curved shape laminates are obtained. As described in [1] for instance, these complex features can
5 6 7 8 9 10 11 12 13 14 15 16 17 18 19 20 21 22 23 24 25 26 27 28 29 30 31 32 33 34 35 36 37 38 39 40 41 42 43 44 45 46 47 48 49 50 51 52 53
low curvature composite parts is generally not problematic with vacuum-bag-only prepregs. The moulding of parts with sharp corners, however, often leads to significant thickness variations and voids concentrated at the corners (see Figure 1). When forming L-shape laminates, defects will typically occur in corner locations. These lead to corner thickness deviation [2-4], which is related to microstructural defects including porosity, resin-rich areas, delamination or wrinkling [5-8]. Corner thickness deviation quantifies the thickness difference between corner and nominal flange region thicknesses. This macroscopic magnitude reflects all the microstructural defects listed above. Corner thickness deviation, because it is easy to quantify, is a very common quality indicator for a complex shape laminate [1,3-7,9-15]. Prediction of corner thickness deviation is thus very useful for process designers.
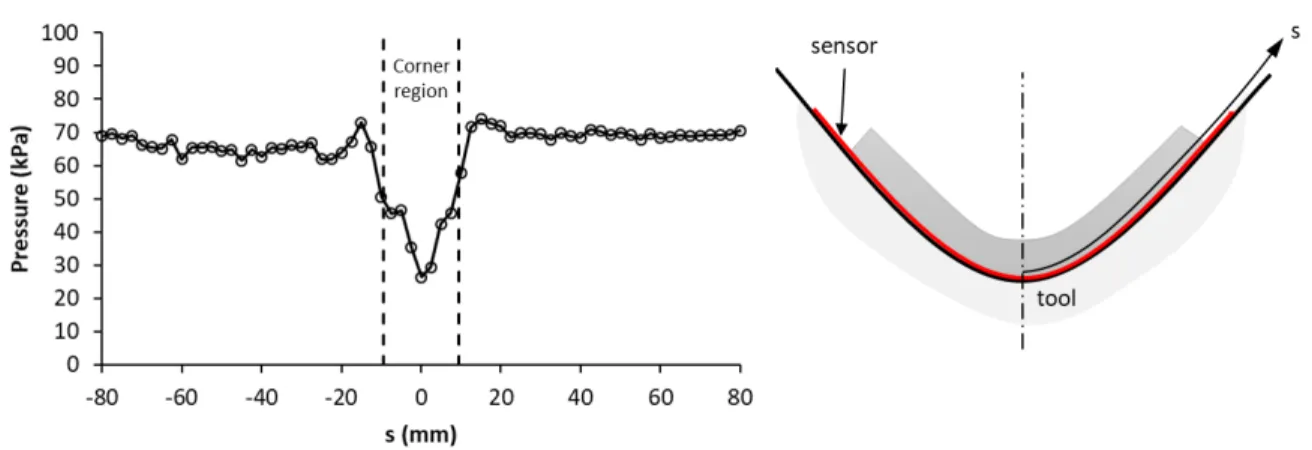
As initially proposed by Hubert & Poursartip [12], an important mechanism behind thickness variations in complex shape laminates consists in the difference in reaction stress between the corner and the flange. This hypothesis was experimentally verified by placing a pressure sensor (XSENSOR Technology Corporation) at the corner of the laminate tool interface [16]. Figure 2 clearly shows a significant 40% compaction pressure drop in the corner region for a 10 mm thick laminate compacted on a 12 mm radius female mould. Meanwhile, friction between plies prevents adequate conformations of the plies together, or the plies against the mould [9, 17]. These two competing effects lead to corner thickness deviation. Prediction of corner thickness deviation is, however, a complex task since
5 6 7 8 9 10 11 12 13 14 15 16 17 18 19 20 21 22 23 24 25 26 27 28 29 30 31 32 33 34 35 36 37 38 39 40 41 42 43 44 45 46 47 48 49 50 51 52
various different physical phenomena are involved. Hubert & Poursartip [2] reviewed the existing modelling and simulation work on shear and percolation flow in composite processing, making a special focus on complex shapes such as L-shape corners. Such models usually require a spatial discretization (such as finite elements) [18]. Models for porosity based on the equilibrium of a bubble still require fine tuning to be predictive [19]. Furthermore, they require prediction of the pressure field using a spatial description of the corner. For instance, Helmus et al. [20] proposed to predict the void evolution in corner regions using a stochastic model coupled with a 2D finite element method for the pressure distribution description. Lightfoot et al. [21] identified the coefficient of thermal expansion mismatch and tool/part friction as the main phenomena leading to fibre wrinkling in corner regions. Predicting such instabilities appears to be a difficult modelling task, as shown in the work of Dodwell et al. [22] or, more recently, Belnoue et al. [23]. Besides these attempts to model the physical phenomena leading to corner thickness deviation, Wang et al. [8] suggest following a statistical approach to obtain predictive correlation rules between the processing conditions and final thickness deviation. Empirical rules of thumb can be obtained this way based on practical knowhow of the process. Previous work by the same authors [9] consisted in developing a semi-empirical analytical model for corner thickness deviation in the case of female L-shape corners. The model was validated on one material system.
5 6 7 8 9 10 11 12 13 14 15 16 17 18 19 20 21 22 23 24 25 26 27 28 29 30 31 32 33 34 35 36 37 38 39 40 41 42 43 44 45 46 47 48 49 50 51 52 53
In this paper, we investigate the mechanisms that govern the compaction of complex shape composite laminates using vacuum-bag processing of prepregs. The goal is to
develop guidelines and tools for the satisfactory design and manufacture of parts with sharp corners, using only vacuum-bag processing methods. We aim to predict the thickness variation between the flanges and the corner of a laminate processed in a male or female shape tool, or in a U-shape tool. Understanding and controlling the consolidation of L-shape corners and U-L-shape corners provides preliminary insight before investigating the consolidation of these complex three-dimensional shapes. Section 2 proposes analytical models of the compaction in the corner. The models include pressure and friction effects. Section 3 makes a review of the experimental manufacturing of L-shape laminates using aerospace grade vacuum-bag-only prepreg composites, bringing together over 100 data points on a wide range of geometries or material systems. We compared the corner thickness deviations measured experimentally in these papers with the predictions of a semi-empirical unified model and thus validated it. In the final section, we provide step-by-step design guidelines to predict the corner thickness deviation for various material systems or manufacturing procedures.
2 MODEL DEVELOPMENT
While processing out-of-autoclave composite using vacuum bag only, one of the challenges is to extract the remaining air from the part during the vacuum hold prior to cure. To this end, out-of-autoclave prepreg composites have a dry area to ensure a
5 6 7 8 9 10 11 12 13 14 15 16 17 18 19 20 21 22 23 24 25 26 27 28 29 30 31 32 33 34 35 36 37 38 39 40 41 42 43 44 45 46 47 48 49 50 51 52
connected flow path. This results in a very high bulk factor for such materials: during heating, impregnation will be completed and the nominal thickness of the part will be greatly reduced [10]. This high bulk factor results in a large geometry change between the final layup at room temperature and the final fully impregnated part. This dimension change is the inherent characteristic of out-of-autoclave prepreg that will result in large corner thickness deviation. During the compaction associated with impregnation, flat parts will have their thickness reduced from !", the initial nominal thickness after layup, to:
the nominal final thickness after cure, where # is the bulk factor, a material property. Nonetheless, in corner regions, because of the curvature, the material will undergo a different compaction:
• The interply friction might constrain the layers from conforming to the mould, thus preventing adequate compaction in the corner [22]. This is the so-called friction
dominated mechanism.
• Even if interply slippage occurs, as mentioned in a previous study by Hubert & Poursartip [12], because of the curvature in the corner, the bagged surface may differ from the facing mould surface. The available consolidation pressure in the part is then different from the expected vacuum-bag pressure. This is the so-called
pressure dominated phenomenon.
!$ =!"
5 6 7 8 9 10 11 12 13 14 15 16 17 18 19 20 21 22 23 24 25 26 27 28 29 30 31 32 33 34 35 36 37 38 39 40 41 42 43 44 45 46 47 48 49 50 51 52 53
In the following sections we will examine and model the pressure and friction dominated phenomena.
2.1 Geometry
This paper considers all cases of corner laminates: from L-shape laminate
manufactured in a concave (female) and convex (male) moulds to U-shapes. The corner angle is called & and is equal to:
• 0 for a U-shape laminate • '/2 for a female tool
• ' for a flat plate (only useful for model validation) • 3'/2 for a male tool
The initial geometry is given in Figure 3. This geometry is obtained after a layup and debulk that is supposedly defect free. Consumable materials effects, such as wrinkling or bridging, are ignored. This means that the part thickness is uniformly !" in the corner and in the flange, such that
for a concave mould or a U-shape and
for a convex mould.
+,− +" = !"
(2)
5 6 7 8 9 10 11 12 13 14 15 16 17 18 19 20 21 22 23 24 25 26 27 28 29 30 31 32 33 34 35 36 37 38 39 40 41 42 43 44 45 46 47 48 49 50 51 52
Plain strain is assumed along the length . of the corner. Compaction during
manufacturing using a vacuum bag is considered nominal over a part /$ of the flange. The final thickness along this flange is therefore !$, as shown in Figure 3. Moreover, in the corner area, after compaction, the bag side surface of the part supposedly has a circular curvature of radius +$ leading to a corner thickness !$0, deviating from the nominal !
$.
2.2 Conformation number
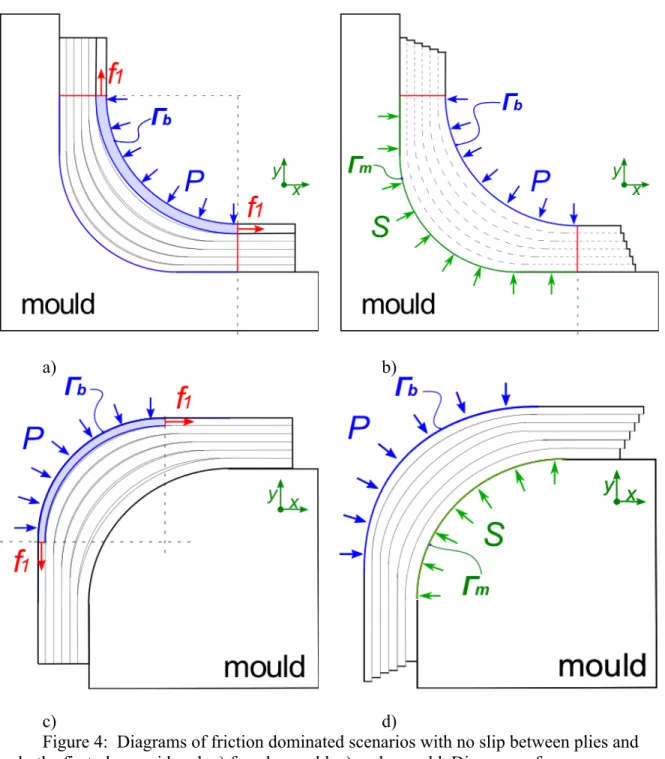
If no interply slippage occurs, because the first ply on the bag side is inextensible it does not conform to the corner region (Figure 4 a) and c)). Thus, the first ply does not contact the second ply on the curved part. The first and second layer are then only in contact over the flange region of length /$. Considering the free body diagrams shown in Figure 4 a) and c), one can equate the tension in that first ply 12 with the result of the pressure on the bag side of the corner section Γ4:
where 5 is the outward normal vector along which the atmospheric pressure 6 is applied and 78 the unit horizontal vector along the 9 direction. The constant curvature of Γ4 (1/+$) gives 12 = 65 ⋅ 78<= >? (4) 12 = +$6. (5)
5 6 7 8 9 10 11 12 13 14 15 16 17 18 19 20 21 22 23 24 25 26 27 28 29 30 31 32 33 34 35 36 37 38 39 40 41 42 43 44 45 46 47 48 49 50 51 52 53
If the tension 12 is higher than the interply friction limit 12,A8 in the flange, it will initiate slippage. The friction limit can be defined using a Coulomb friction behaviour model with a coefficient B as
where /$6 is the normal load applied on the flange section. The dimensionless conformation number Λ2 naturally appears:
Λ2 is an indicator of whether the compaction is friction or pressure dominated in the bag side ply:
• If Λ2 < 1, the interply friction limit is not reached in the flange, and the outermost ply will not conform to the corner. This is a friction dominated compaction. • If Λ2 > 1, the friction limit is reached, and the first ply can slip, thus coming into
contact with the second ply. The compaction is now pressure dominated in this ply.
If slippage occurs, the first ply will contact the second, and the same analysis should be carried successively to each interply interface. A series of conformation numbers Λ" then provide indicators of whether the ply F would slip over ply F + 1. The last element,
12,A8 = B/ $6. (6) Λ2 = 12 12,A8 = +$ B/$. (7) ΛH = +, B/,. (8)
5 6 7 8 9 10 11 12 13 14 15 16 17 18 19 20 21 22 23 24 25 26 27 28 29 30 31 32 33 34 35 36 37 38 39 40 41 42 43 44 45 46 47 48 49 50 51 52
indicates whether all the plies, up to the tool side ply, slipped or not.
2.3 Friction dominated model
This section considers the friction dominated case. The corner thickness !$0 and its deviation I! = (!$0 − !
$)/!$ from the nominal final thickness !$ are investigated. This analysis is simply geometric.
2.3.1 Female corner
First, let us consider the female tool where & = '/2 . The total height of the L-shape before and after compaction (Figure 3a) can be equated, giving
The length of the first diagonal (being at 45°) can also be equated before and after compaction, giving
Finally, considering the outermost ply to be inextensible, its length can be equated before and after compaction:
Eq. (9), (10) and (11) along with the initial configuration in Eq. (2) and the bulk factor Eq. (1) give the corner thickness deviation for this case of the female tool as
+,+ /, = +$+ !$+ /$ (9) +,+ 2 /, = +$+ !$0 + 2 / $ (10) 2/, +' 2+" = 2/$+ ' 2+$ (11)
5 6 7 8 9 10 11 12 13 14 15 16 17 18 19 20 21 22 23 24 25 26 27 28 29 30 31 32 33 34 35 36 37 38 39 40 41 42 43 44 45 46 47 48 49 50 51 52 53
This is in agreement with previous work [9,10].
2.3.2 Male Corner
For the male tool (Figure 3b) where & = 3'/2, the total height gives
the length of the first diagonal:
and the outermost ply inextensibility:
The corner thickness deviation, for this case of male tool thus also gives
2.3.3 U-Shape
In the case of a U-Shape corner (where & = 0), the total U-shape height should be considered (Figure 3c): I! =!$ 0 − ! $ !$ = ' 4 2 − 1 1 − '4 OP # − 1 (12) +,+ /,+ !$ = +$+ /$ (13) +,+ 2/, = +$− !$0 + 2 / $ (14) 2/, +' 2+" = 2/$+ ' 2+$ (15) I! =!$ 0 − ! $ !$ = ' 4 2 − 1 1 − '4 OP # − 1 (16)
5 6 7 8 9 10 11 12 13 14 15 16 17 18 19 20 21 22 23 24 25 26 27 28 29 30 31 32 33 34 35 36 37 38 39 40 41 42 43 44 45 46 47 48 49 50 51 52
as should the total length of the U-shape:
The outermost ply inextensibility can now be written
The corner thickness deviation, for this case of U-shape tool now gives
2.3.4 Flat Plate
For a flat plate, where & = ', the corner thickness deviation is 0,
2.4 Pressure dominated
For the pressure dominated mechanism, perfect slip is considered between the plies, and between the ply and the mould, thus allowing conformation to the mould. Previous work by Brillant & Hubert [13], Levy et al. [9] or Hubert et al. [10] consisted in an
2+, = 2+$+ 2!$ (17) +,+ /, = +$+ !$0 + /$ (18) /, + ' 2+" = /$+ ' 2+$ (19) I! =!$ 0− ! $ !$ = ' 2 OP # − 1 (20) I! =!$ 0 − ! $ !$ = 0OP× # − 1 (21)
5 6 7 8 9 10 11 12 13 14 15 16 17 18 19 20 21 22 23 24 25 26 27 28 29 30 31 32 33 34 35 36 37 38 39 40 41 42 43 44 45 46 47 48 49 50 51 52 53
analytical model for female corners. We therefore extended this model for male and U-shaped moulds.
2.4.1 Female Corner
Considering the free-body diagram in Figure 4b), Eq. (4) is modified. Because the plies slipped and conformed to the mould, there exists a mould reaction stress =. Moreover, because the compaction is now pressure dominated, a full relaxation of the tensions in the plies 1" is assumed such that 1" = 0. This comes down to disregarding the interply friction relative to the pressure terms. The force equilibrium then reduces to
6+$− = ⋅ 78<= >R
= 0 (22)
The normal reacting stress = ⋅ 5 over the flat part of the mould side boundary Γ, is close to that of the flange, and thus assumed to equate 6. The average of the normal
reacting force = ⋅ 5 over the curved part of the mould side boundary Γ, is considered equal to =AST. The projection of the integral term on 78 then consists of two terms:
The first of these terms is the integral over the curvature +, of the mould side boundary Γ,. The second term is integral over the flat part of the mould boundary Γ, of length /" − /$ (as shown on Figure 4b). Eq. (22) can then be written
= ⋅ 78<= >R
5 6 7 8 9 10 11 12 13 14 15 16 17 18 19 20 21 22 23 24 25 26 27 28 29 30 31 32 33 34 35 36 37 38 39 40 41 42 43 44 45 46 47 48 49 50 51 52
Using the total corner height, Eq. (9) yields the following forces equilibrium relation:
Now, in order to close the relation, =AST needs to be determined.
Under low pressure conditions found in out-of-autoclave manufacturing (i.e.,
100 kPa), a linear elastic compaction behaviour of the prepreg bed can be assumed. Also, from Figure 4b), the laminate compaction stress along the axis of symmetry (bisection) varies between 6 on the bag side and the extreme reaction pressure min = , at the center of the corner, on the tool side. Given that the average tool reaction pressure =AST is defined as the average over the same range min = , 6 , we assume that the average laminate
compaction stress across thickness on the axis of symmetry is also =AST.
Given the above statements, the ratio between the compaction stresses and the normal strain at the flange (\$) and on the axis of symmetry (\0) of the corner both equate the bed stiffness:
By definition, the strains at the flange and at the corner are given by 6+$− =AST+,− 6 /"− /$ = 0. (24) 6 +,− !$ − =AST+, = 0 (25) 6 \$= =AST \0 (26) \$ =!" − !$ !" = # − 1 # and \0 = !"− !$0 !" = # − !$0/! $ # (27)
5 6 7 8 9 10 11 12 13 14 15 16 17 18 19 20 21 22 23 24 25 26 27 28 29 30 31 32 33 34 35 36 37 38 39 40 41 42 43 44 45 46 47 48 49 50 51 52 53
Eq. (26) and (27) give
Substituting =AST in Eq. (25) gives
Because atmospheric pressure 6 is positive, the bracket factor is zero. After rearrangement, it gives the corner thickness deviation:
2.4.2 Male corner
For male corners, the free body analysis (i.e., Eq. (22) to (24) ) is still valid (Figure 4d). The total height Eq. (13) then modifies the sign in the force equilibrium relation:
The compaction behaviour (Eq. (26) to (28)) is also unchanged. The corner thickness deviation is then written
2.4.3 U-shape
For U-shapes, the free body analysis (Eq. (22)) becomes =AST = 6# − !$ 0/! $ # − 1 . (28) 6 !$ 0/! $− 1 # − 1 +,− !$ = 0. (29) δ! = !$ 0− ! $ !$ = # − 1 !$ +, (30) 6 +,+ !$ − =AST+, = 0 (31) δ! = !$ 0− ! $ !$ = − # − 1 !$ +, (32)
5 6 7 8 9 10 11 12 13 14 15 16 17 18 19 20 21 22 23 24 25 26 27 28 29 30 31 32 33 34 35 36 37 38 39 40 41 42 43 44 45 46 47 48 49 50 51 52 6× 2+$ − = ⋅ 78<= >R = 0 (33)
where the second term is now written
The compaction behaviour (Eq. (26) to (28)) is unchanged and gives
Using the height of the U-shape (Eq. (17)), the corner thickness deviation is obtained as
2.4.4 Flat Plate
In the case of a flat plate (Corner angle & = '), the corner thickness deviation is written = ⋅ 78<= >R = =AST× 2+, + 0. (34) +$ = +, # − !$ 0/! $ # − 1 . (35) δ! = !$ 0− ! $ !$ = # − 1 !$ +, (36) δ! =0 (37)
5 6 7 8 9 10 11 12 13 14 15 16 17 18 19 20 21 22 23 24 25 26 27 28 29 30 31 32 33 34 35 36 37 38 39 40 41 42 43 44 45 46 47 48 49 50 51 52 53 2.5 Summary
In all cases of a friction dominated mechanism, the corner thickness deviation can be written
whereas in all cases of a pressure dominated mechanism, it is written
where the compaction parameters ^$ and ^_ depend on the corner angle as given in Table 1.
3 RESULTS AND DISCUSSION
In this section we analyse an extensive experimental database built from the
literature. It mostly comprises experimental data for thermoset continuous fibre laminates. Thickness deviation is measured in the corner after curing and compared with the nominal thickness measured in the flange section.
3.1 Database
In order to validate the model, experimental data obtained with out-of-autoclave prepreg material (showing large bulk factors) and processed out-of-autoclave were
analysed. Over 100 data points from the literature were analysed. The database is available I! = ^$× # − 1
(38)
I! = ^_× !$
5 6 7 8 9 10 11 12 13 14 15 16 17 18 19 20 21 22 23 24 25 26 27 28 29 30 31 32 33 34 35 36 37 38 39 40 41 42 43 44 45 46 47 48 49 50 51 52
as an Excel spreadsheet in the supplementary materials of this article. The dataset includes results from five different works:
• The L-shapes by Brillant and Hubert [13] were manufactured on male and female 90° toolings with 8 harness satin (8HS) and plain weave (PW) Carbon/5320 epoxy resin. The friction coefficient for this material was measured by Levy et al. [9] as 0.17. The bulk factor is adapted from the literature [1,9-11,13] and taken as 1.23 for 8HS and 1.2 for PW.
• The L-shape by Levy et al. [9] was similar but manufactured with 8HS only. • The L-shape by Ma et al. [5,6] had angles over 90°. They were nevertheless
compared with the model prediction for 90° angles. Concave and convex moulds were used. They were manufactured with the same 8HS material, thus using the same properties as above.
• The L-shapes by Krumenacker & Hubert [7] were manufactured in the same
material with unidirectional architecture (UD) and show a smaller bulk factor of 1.1. The friction coefficient for UD is also smaller. It was adapted from Larberg & Akermo’s [24] measurement AS4/8552 and taken as 0.10. Concave and convex moulds were used.
• The L-shapes by Hughes and Hubert [1] were manufactured on concave moulds only, using 8HS 5320 material (the above properties were thus also used in the model).
5 6 7 8 9 10 11 12 13 14 15 16 17 18 19 20 21 22 23 24 25 26 27 28 29 30 31 32 33 34 35 36 37 38 39 40 41 42 43 44 45 46 47 48 49 50 51 52 53
The material properties used with these data points are listed in Table 2. Four specific data points are discussed below. The conformation number ΛH= +,/ B/, appears to provide a good estimate of whether the pressure or friction mechanism dominates. To illustrate this capacity, four specific data points are presented in Figure 5. Two cases are for male corners and two for female corners. For each configuration, cases of low and high values of
conformation number Λ` were chosen. For each case, the experimental corner thickness deviation is bounded by the friction and pressure dominated models (Eq. (38) and (39)). The pressure dominated model predicts a lower bound, which is even negative (corner thinning) for the male case. The friction dominated model predicts a higher bound. For high values of Λa, which correspond to a good conformation, the measured deviation is closer to the pressure dominated model, whereas for low values of Λa, the experimental values are closer to the friction dominated model.
The friction dominated model bound is never approached experimentally as the highest conformation number found in the database is not that high.
3.2 Unified semi-empirical model
The conformation number ΛH = +,/ B/, provides a good estimate of whether the pressure or the friction mechanism dominates. In order to provide a unified model, the following semi-empirical rule of mixture is proposed for the corner thickness deviation:
I! = b c` ×^_× !$
5 6 7 8 9 10 11 12 13 14 15 16 17 18 19 20 21 22 23 24 25 26 27 28 29 30 31 32 33 34 35 36 37 38 39 40 41 42 43 44 45 46 47 48 49 50 51 52
where b is a smoothed step function that ensures both asymptotic behaviours, namely
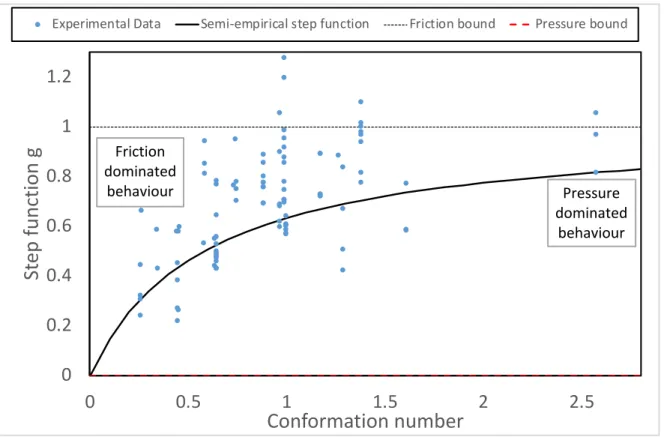
The following step function, which ensures both conditions, is proposed:
where d is a smoothing parameter that will be identified experimentally. It quantifies the width of the transition zone between non-conformation (friction dominated compaction) and free sliding of plies (pressure dominated compaction). The graph of g is given in Figure 6. It shows that both asymptotic behaviours of Eq. (41) are recovered with the empirical function as well as the experimental data.
Using this step function, the unified model gives the corner thickness deviation as
where the compaction parameters ^_ and ^$ are given for various corner configurations in Table 1.
Finally, one single modelling scalar, the step function parameter d, was obtained by fitting the experimental data:
lim
fg →i b = 0 and limfg →kl b = 1 (41)
b c` = c` d + c` (42) I! = !$ 0 − ! $ !$ = ^_ !$ B/, + d^$ × # − 1 d + +, B/, (43) d = 0.58 (44)
5 6 7 8 9 10 11 12 13 14 15 16 17 18 19 20 21 22 23 24 25 26 27 28 29 30 31 32 33 34 35 36 37 38 39 40 41 42 43 44 45 46 47 48 49 50 51 52 53
The effect of the material properties uncertainty can be evaluated using the variance formula
where opq is the standard deviation expected on the modelled corner thickness deviation. or is the standard deviation associated with the uncertainty over the friction coefficient B and os over the bulk factor #. os = 0.03 can be assumed for the bulk factor, which is the typical standard deviation obtained for values of # ∼ 1.1. An or = 0.05 can be considered for the friction coefficient, which is very variable. It corresponds to a ∼25% higher coefficient of variation since B ∼ 0.2 in our cases. The average standard deviation
opq obtained over all the out-of-autoclave cases, arising from these material properties uncertainty is
Additionally, the experimental error in measurement of corner thickness deviation can be roughly approximated as ±300 Bz, which gives an error of roughly 10% on the thicknesses investigated in the database.
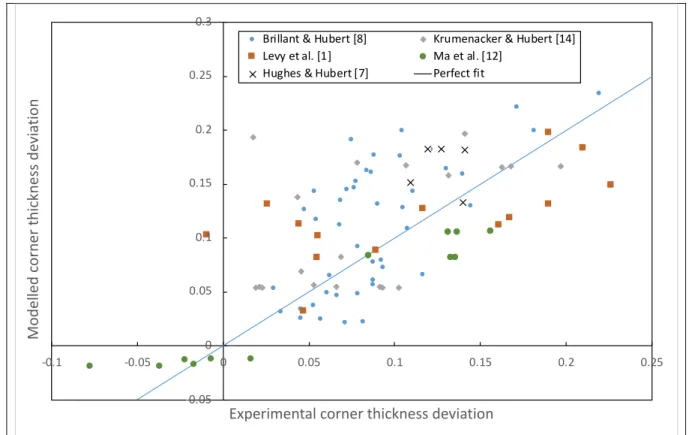
Figure 7 compares the experimental and modelled corner thickness deviation. The standard deviation of the absolute difference between the model and the 100 experiments of
opq = { I! {B or|+ { I! {# os| (45) opq = 0.043 (46)
5 6 7 8 9 10 11 12 13 14 15 16 17 18 19 20 21 22 23 24 25 26 27 28 29 30 31 32 33 34 35 36 37 38 39 40 41 42 43 44 45 46 47 48 49 50 51 52
the database is 0.05. Although this could seem high, the following facts should be considered:
1. The model is a very simple analytical formula based on strong assumptions (Coulomb friction, fibre bed elasticity, etc.).
2. It includes only two material properties (bulk factor and friction coefficient) and thus cannot accurately describe the complex behaviour of composite material. 3. The materials used in the database are highly variable in terms of morphology.
In particular, the friction and sliding behaviour is likely to be stochastic. This is reflected in the propagation of uncertainty discussed above. A fair estimate of the standard deviation arising from the material uncertainty appeared to be around 0.05, which is comparable to the experimental standard deviation. 4. Variability is also caused by the laminator (stacking, edge effect, bagging
configuration, debulking, etc.). Indeed, besides the various configurations, the database includes five different laminators, with slight differences in bagging conditions (edge breathing, bag folds, etc.).
5. Variability in experimental thickness deviation may also arise from the
experimental procedure, which differed slightly between the works referenced. This is also discussed with regard to the propagation of uncertainty above.
5 6 7 8 9 10 11 12 13 14 15 16 17 18 19 20 21 22 23 24 25 26 27 28 29 30 31 32 33 34 35 36 37 38 39 40 41 42 43 44 45 46 47 48 49 50 51 52 53
Yet, apart from a couple of outliers, the model successfully captured the correct trend between thinning and thickening (only lower left and upper right quadrants are populated in Figure 7).
4 GUIDELINES FOR USING THE UNIFIED MODEL
For a given material system, this section presents the step-by-step method for predicting corner thickness deviation using the above unified model. Ultimately, it would be possible to produce a design chart.
4.1 Parameter characterisation
First, the two material properties, namely the bulk factor # and the friction coefficient B should be characterised for the material system studied. For the 5320 system, these are given in Table 2.
4.1.1 Bulk factor
The bulk factor of the prepreg composite system is the ratio of between the thickness prior to processing (after debulk) and after processing; this is straightforward to obtain by direct thickness measurement as in [9,13,17].
A typical value of the bulk factor would be around 1.2 for out-of-autoclave prepreg [10] and usually slightly lower for UD than for woven prepregs.
5 6 7 8 9 10 11 12 13 14 15 16 17 18 19 20 21 22 23 24 25 26 27 28 29 30 31 32 33 34 35 36 37 38 39 40 41 42 43 44 45 46 47 48 49 50 51 52 4.1.2 Friction coefficient
The ply-to-ply friction coefficient of the prepreg B is much harder to characterise as this requires a special technique. Various research teams developed in-house devices to try and characterise this friction behaviour [24, 25, 26], which includes dry and lubricated contributions and is usually quite complex. One can also refer to existing literature to estimate the Coulomb friction coefficient B [9, 24, 26].
For woven materials, higher values of about 0.11-0.15 are usually obtained. This is the case for the Cycom 5320 system used in this study and characterised in a previous one [9]. For Cycom 5320-1 plain weave material, an average value of 0.11 was obtained for temperatures ranging from 50-120°C [28]. For UD systems, lower values around 0.05 are usually obtained. Additionally, all the cases in the database consider either 0°/90° stacking or quasi-iso stacking. Nesting, which may occur in highly aligned stacking (including 0°/0°) and may lead to a different friction coefficient, is thus ignored.
4.2 Design charts
Using the unified model Eq. (43), design charts can be constructed for a wide range of thickness to flange length ratio !$//, and tool radius to flange length ratio +,//,. Some typical such design graphs are presented in Figure 8. One is for a female mould with a bulk factor # = 1.23 and a friction coefficient B = 0.17, which corresponds to an 8 harness satin carbon / 5320 epoxy resin prepreg system. The second example in Figure 8 is
5 6 7 8 9 10 11 12 13 14 15 16 17 18 19 20 21 22 23 24 25 26 27 28 29 30 31 32 33 34 35 36 37 38 39 40 41 42 43 44 45 46 47 48 49 50 51 52 53
for a male mould with a bulk factor # = 1.20 and a friction coefficient B = 0.17, which correspond to a plain weave carbon / 5320 epoxy resin prepreg system [1,5,9,13]. These two charts, plotting the iso-values of corner thickness deviation, were produced with a MATLAB code available in the supplementary materials of this article.
The four cases discussed in section 3.1 and Figure 5 are illustrated by red lines on the chart.
Given an acceptable corner thickness deviation, such design charts can then predict the geometries that should be avoided. The designer may then either modify the geometry or suggest innovative solutions (such as pressure intensifiers [15,17] or using ply cuts [1]) to ensure the allowable thickness deviation is respected.
5 CONCLUSION
This article investigates the thickness deviation occurring in complex shapes
produced with vacuum-bag processing of prepreg composite materials. In corner locations, thickness may deviate from the nominal flange thickness due to two mechanisms: (i) the pressure difference between corner and flange, which results in different compaction of the fibre bed; and (ii) the friction between plies, which prevent adequate conformation of the laminate to the mould. We modelled these two mechanisms for the cases of simplified L-shape geometries (concave and convex). The two analytical models obtained could then be combined in a semi-empirical unified model Eq. (43) making it possible to predict the corner thickness deviation using only two material parameters and two geometric ratios.
5 6 7 8 9 10 11 12 13 14 15 16 17 18 19 20 21 22 23 24 25 26 27 28 29 30 31 32 33 34 35 36 37 38 39 40 41 42 43 44 45 46 47 48 49 50 51 52
For validation purposes, over 100 experimental data points were gathered from five
different published sources. These experimental corner thickness deviations were compared with the predictions of the unified model. The standard deviation of the error was around 5% and validates, to some extent, the unified model. The unified model can therefore be used to produce design charts, such as those shown in Figure 8. These prove useful for the manufacturing designer to predict whether a process will be capable of producing parts in the allowable range of thickness deviation.
The method presented here could also be extended to other forming processes, such as those employing pressure intensifiers, such as rubber pads or high pressure autoclaves. To be predictive, the semi-empirical unified model needs to be adjusted. With this
objective, the use of correction factors was first suggested [10,11], but further investigation of the friction, sliding and wrinkling effects also seem to be required.
6 ACKNOWLEDGMENTS
The authors would like to acknowledge the financial support from the National Sciences and Engineering Research Council of Canada (NSERC), the Research Centre for High Performance Polymer and Composite Systems (CREPEC) and the Werner Graupe Chair. This research was possible thanks to the contribution of several graduate students from the McGill Structures and Composite Materials Laboratory: Mélanie Brillant, Julien Cauberghs, Jacques Stadlin, Stella Hughes, Timotei Centea, James Kratz, Nicolas
5 6 7 8 9 10 11 12 13 14 15 16 17 18 19 20 21 22 23 24 25 26 27 28 29 30 31 32 33 34 35 36 37 38 39 40 41 42 43 44 45 46 47 48 49 50 51 52 53 7 REFERENCES
1. Hughes, S., & Hubert, P. (2013). Out-of-autoclave Prepreg Processing: Effect of Integrated Geometric Features on Part Quality. In SAMPE Conference. Wichita, KS. 2. Hubert, P., & Poursartip, A. (1998). A Review of Flow and Compaction Modelling
Relevant to Thermoset Matrix Laminate Processing. Journal of Reinforced Plastics
and Composites, 17(4), 286–318.
3. Fernlund, G., Griffith, J., Courdji, R., & Poursartip, A. (2002). Experimental and numerical study of the effect of caul-sheets on corner thinning of composite laminates.
Composites Part A, 33(3), 411–426.
4. Hassan, M. H., Othman, A. R., Abdullah, J., & Mahmud, A. S. (2016). Effect of bagging configurations on vacuum bagging only - oven cured to the thickness variations for the complex - shaped laminate composite. Journal of Scientific Research
and Development, 3(3), 41–46.
5. Ma, Y., Centea, T., Nilakantan, G., & Nutt, S. R. (2014). Vacuum Bag Only Processing of Complex Shapes: Effect of Corner Angle, Material Properties and Process Conditions. Proceedings of the 29th Technical Conference of the American
Society for Composites/16th US-Japan Conference on Composite Materials/ASTM D-30 Meeting, 2–17.
6. Ma, Y., Centea, T., & Nutt, S. R. (2014). Defect Reduction Strategies for the Manufacture of Contoured Laminates Using Vacuum BAG-Only Prepregs. Polymer
composites. 38(9) 2016-2025, 2017
7. Krumenacker, N., & Hubert, P. (2015). Effect of Processing Deficiencies on Vacuum-Bag-Only Complex-Shape Prepreg Laminate Consolidation and Interlaminar Tensile Behaviour. In ICCM 20 (pp. 19–24). Copenhagen.
8. Wang, X., Zhang, Z., Xie, F., Li, M., Dai, D., & Wang, F. (2009). Correlated Rules between Complex Structure of Composite Components and Manufacturing Defects in Autoclave Molding Technology. Journal of Reinforced Plastics and Composites,
28(22), 2791–2803.
9. Levy, A., Stadlin, J., & Hubert, P. (2014). Corner consolidation in vacuum bag only processing of out-of-autoclave composite prepregs laminates. In SAMPE. Seattle, WA, USA.
5 6 7 8 9 10 11 12 13 14 15 16 17 18 19 20 21 22 23 24 25 26 27 28 29 30 31 32 33 34 35 36 37 38 39 40 41 42 43 44 45 46 47 48 49 50 51 52
10. Hubert P, Centea T, Grunefelder L, Nutt S, Kratz J, Levy A. Out-of Autoclave Prepreg Processing. In: Beaumont, P.W.R. and Zweben, C.H. (eds.), Comprehensive Composite Materials II. vol. 2, pp. 63–94. Oxford: Academic Press, 2018.M. P. Brown and K. Austin, The New Physique (Publisher Name, Publisher City, 2005), pp. 25–30. 11. Hubert P. Schubert J., Bickerton S., Hickey, C., (2017). Towards a design guideline for
corners in composite parts. In ICCM21, Xi’An, China
12. Hubert, P., & Poursartip, A. (2001). Aspects of the Compaction of Composite Angle Laminates: An Experimental Investigation. Journal of Composite Materials, 35(2), 2– 26.
13. Brillant, M., & Hubert, P. (2010). Out-of-Autoclave Processing of Complex Shape Laminates. In 54th International SAMPE Symposium and Exhibition.
14. Hallander, P., Nyman, T., & Akermo, M. (2012). Influence of the forming process on the shape distortion of a composite c-shaped aerospace spar. In ECCM 15. Venice, Italy.
15. Gu, Y., Li, M., Li, Y., & Zhang, Z. (2010). Pressure transfer behaviour of rubber mould and the effects on consolidation of L-shape composite laminates. Polymers and
Polymer Composites, 18(3), 167–174.
16. Hubert, P. & Kratz, J. (2018). Private communication. ACCIS, University of Bristol. 17. Cauberghs, J. (2011). Out-of-Autoclave Manufacturing of Aerospace Representative
Parts. Master thesis, McGill University.
18. Li, Y., Li, M., Gu, Y., & Zhang, Z. (2009). Numerical and Experimental Study on the Effect of Lay-Up Type and Structural Elements on Thickness Uniformity of L-Shaped Laminates. Applied Composite Materials, 16(2), 101–115.
19. du Plessix, B. D. P., Le Corre, S., Jacquemin, F., Lefebure, P., & Sobotka, V. (2016). Improved simplified approach for the prediction of porosity growth during the curing of composites parts. Composites Part A: Applied Science and Manufacturing, 90, 549-558.
20. Helmus, R., Copony, M., Hartmann, M., Hubert, P., & Hinterhölzl, R. (2016). Modelling void formation in corners during out-of-autoclave prepreg processing.
International SAMPE Technical Conference, 2016–January.
21. Lightfoot, J. S., Wisnom, M. R., & Potter, K. (2013). A new mechanism for the formation of ply wrinkles due to shear between plies. Composites Part A: Applied
5 6 7 8 9 10 11 12 13 14 15 16 17 18 19 20 21 22 23 24 25 26 27 28 29 30 31 32 33 34 35 36 37 38 39 40 41 42 43 44 45 46 47 48 49 50 51 52 53
22. Dodwell, T. J., Butler, R., & Hunt, G. W. (2014). Out-of-plane ply wrinkling defects during consolidation over an external radius. Composites science and technology, 105, 151–159.
23. Belnoue, J. P., Nixon-Pearson, O. J., Thompson, A. J., D.S., I., Potter, K. D., & Hallett, S. R. (2018). Consolidation-Driven Defect Generation in Thick Composite Parts.
Journal of Manufacturing Science and Engineering, 140(July), 1–15.
24. Larberg, Y. R., & Åkermo, M. (2011). On the interply friction of different generations of carbon/epoxy prepreg systems. Composites Part A: Applied Science and
Manufacturing, 42(9), 1067–1074.
25. Ulrich Sachs, Fetfatsidis, K. A., Schumacher, J., Ziegmann, G., Allaoui, S., Hivet, G., … Akkerman, R. (2012). A Friction-Test Benchmark with Twintex PP. Key
Engineering Materials, 504–506, 307–312.
26. Sun, J., Li, M., Gu, Y., Zhang, D., Li, Y., & Zhang, Z. (2014). Interply friction of carbon fiber/epoxy prepreg stacks under different processing conditions. Journal of
Composite Materials, 48(5), 515–526.
27. Krumenacker N. Experimental study of variability and defects in vacum-bag-only corner laminates. PhD Thesis. McGill University. 2018
28. Martin R. G. Carbon fibre reinforced polymer inter-ply friction experimental characterization. Master Thesis. McGill University. 2019.
5 6 7 8 9 10 11 12 13 14 15 16 17 18 19 20 21 22 23 24 25 26 27 28 29 30 31 32 33 34 35 36 37 38 39 40 41 42 43 44 45 46 47 48 49 50 51 52 8 TABLES
Table 1: Compaction parameters ^$ for the friction dominated models, and ^_ for the pressure dominated models. The parameters depend on the corner angle. The corner
thickness deviation predictions are obtained using the unified model, Eq. (43) Corner angle &
Compaction parameter friction dominated ^$ Compaction parameter pressure dominated ^_ 0 (U-shape) ' 2≈ 1.57 1 '/2 (female tool) '4 2 − 1 1 −' 4 ≈ 1.52 1 ' (flat plate) 0 0 3'/2 (male tool) '4 2 − 1 1 −' 4 ≈ 1.52 -1
5 6 7 8 9 10 11 12 13 14 15 16 17 18 19 20 21 22 23 24 25 26 27 28 29 30 31 32 33 34 35 36 37 38 39 40 41 42 43 44 45 46 47 48 49 50 51 52 53
Table 2: Material properties for the 5320 resin system.
Friction coefficient B Bulk factor #
Plain weave 0.17 1.2
Harness satin 0.17 1.23
Unidirectional 0.10 1.1
9 FIGURES
a) b)
Figure 1: Corner thickness deviation in composite L-shapes [27]. Examples of corner thinning (a), and thickening with porosity in the corner area (b).
5 6 7 8 9 10 11 12 13 14 15 16 17 18 19 20 21 22 23 24 25 26 27 28 29 30 31 32 33 34 35 36 37 38 39 40 41 42 43 44 45 46 47 48 49 50 51 52
Figure 2: Pressure sensor profile at the 10 mm silicone rubber laminate tool interface compacted on a 12 mm radius female mould in a vacuum bag.
5 6 7 8 9 10 11 12 13 14 15 16 17 18 19 20 21 22 23 24 25 26 27 28 29 30 31 32 33 34 35 36 37 38 39 40 41 42 43 44 45 46 47 48 49 50 51 52 53 a) b) c)
Figure 3: Initial and final curved laminate configuration: a) L-shape female mould, b) L-shape male mould, c) U-shape female mould.
5 6 7 8 9 10 11 12 13 14 15 16 17 18 19 20 21 22 23 24 25 26 27 28 29 30 31 32 33 34 35 36 37 38 39 40 41 42 43 44 45 46 47 48 49 50 51 52 a) b) c) d)
Figure 4: Diagrams of friction dominated scenarios with no slip between plies and only the first ply considered: a) female mould, c) male mould. Diagrams of pressure dominated scenarios with slippage and conformation of plies and the whole corner considered: b) female mould, d) male mould.
5 6 7 8 9 10 11 12 13 14 15 16 17 18 19 20 21 22 23 24 25 26 27 28 29 30 31 32 33 34 35 36 37 38 39 40 41 42 43 44 45 46 47 48 49 50 51 52 53 Figure 5: Analysis of four extreme cases in the database: two male and two female corners with low and high values of conformation number Ä. The
experimental deviation is always bounded by the friction and pressure models. The conformation number is a good estimate of the contribution of each phenomenon. The experimental deviation is well predicted by the unified model.
5 6 7 8 9 10 11 12 13 14 15 16 17 18 19 20 21 22 23 24 25 26 27 28 29 30 31 32 33 34 35 36 37 38 39 40 41 42 43 44 45 46 47 48 49 50 51 52
Figure 6: Step function g used in the unified model as a function of the conformation number Λ`. The step function weights the friction to pressure effects. The higher the
conformation number, the closer it should get to unity (pressure dominated bound), whereas it should tend to 0 (friction dominated bound) when the conformation number approaches 0. The experimental weights between pressure and friction bounds are also plotted for all the data points.
0 0.2 0.4 0.6 0.8 1 1.2 0 0.5 1 1.5 2 2.5
St
ep
fu
nc
tio
n g
Conformation number
Experimental Data Semi-empirical step function Friction bound Pressure bound
Pressure dominated behaviour Friction dominated behaviour
5 6 7 8 9 10 11 12 13 14 15 16 17 18 19 20 21 22 23 24 25 26 27 28 29 30 31 32 33 34 35 36 37 38 39 40 41 42 43 44 45 46 47 48 49 50 51 52 53
Figure 7: Comparison between the modelled and measured corner thickness deviations for out-of-autoclave material. Except for two outliers, the trend is respected between thinning and thickening. -0.05 0 0.05 0.1 0.15 0.2 0.25 0.3 -0.1 -0.05 0 0.05 0.1 0.15 0.2 0.25 Mo de lle d co rn er th ic kn es s de vi ati on
Experimental corner thickness deviation
Brillant & Hubert [8] Krumenacker & Hubert [14] Levy et al. [1] Ma et al. [12]
5 6 7 8 9 10 11 12 13 14 15 16 17 18 19 20 21 22 23 24 25 26 27 28 29 30 31 32 33 34 35 36 37 38 39 40 41 42 43 44 45 46 47 48 49 50 51 52 6 8 10 12 14 16 18 20 22 24 0.05 0.1 0.15 0.2 0.25 0.3 0.35 0.4 0.45
Thickness to radius ratio tf / Rm
0.1 0.15 0.2 0.25 0.3 0.35 0.4 0.45 0.5 0.55 0.6
Radius to flange length ratio R
m
/ L
5 6 7 8 9 10 11 12 13 14 15 16 17 18 19 20 21 22 23 24 25 26 27 28 29 30 31 32 33 34 35 36 37 38 39 40 41 42 43 44 45 46 47 48 49 50 51 52 53
Figure 8: Design charts giving the corner thickness deviation in percent as a function of the geometric parameters of the L-shape. The charts correspond to: (top) the female case with a bulk factor # = 1.23 and friction coefficient B = 0.17, corresponding to a 5320 8 harness satin system; and (bottom) the male case with a bulk factor # = 1.2 and friction coefficient B = 0.17, corresponding to a 5320 plain weave system. The four cases discussed in section 3.1 and Figure 4 are predicted with the red lines.
-8 -6 -4 -2 0 2 4 4 6 8 10 12 14 16 18 20 0.1 0.2 0.3 0.4 0.5 0.6 0.7
Thickness to radius ratio tf / Rm
0.05 0.1 0.15 0.2 0.25 0.3 0.35 0.4 0.45 0.5 0.55
Radius to flange length ratio R
m
/ L

![Figure 1: Corner thickness deviation in composite L-shapes [27]. Examples of corner thinning (a), and thickening with porosity in the corner area (b)](https://thumb-eu.123doks.com/thumbv2/123doknet/8083349.271124/32.918.168.754.171.359/figure-thickness-deviation-composite-examples-thinning-thickening-porosity.webp)