OATAO is an open access repository that collects the work of Toulouse
researchers and makes it freely available over the web where possible
Any correspondence concerning this service should be sent
to the repository administrator:
[email protected]
This is an author’s version published in:
http://oatao.univ-toulouse.fr/24608
To cite this version:
Réveillon, Tom
and Rota, Thibaut
and Chauvet, Eric
and Lecerf,
Antoine
and Sentis, Arnaud Repeatable inter‐individual variation in the thermal
sensitivity of metabolic rate. (2019) Oikos, 128 (11). 1633-1640. ISSN 0030-1299
doi: 10.1111/oik.06392
doi: 10.1111/oik.06392 128 1633–1640
Assessing whether trait variations among individuals are consistent over time and among environmental conditions is crucial to understand evolutionary responses to new selective pressures such as climate change. According to the universal thermal dependence hypothesis, thermal sensitivity of metabolic rate should not vary strongly and consistently among organisms, implying limited evolutionary response for metabolic traits under climate change. However, this hypothesis has been rarely tested at an individual level, leaving a gap in our understanding of climate change impacts on metabolic responses and their potential evolution. Using the amphipod Gammarus fossarum, we investigated the variability and repeatability of individual metabolic thermal reaction norms over time. We found large variations in both the thermal sensitivity (i.e. slope) and expression level (i.e. intercept) of individual metabolic reaction norms. Moreover, differences among individuals were consistent over time, and therefore repeatable. Inter-individual variations in body mass resulted in a high repeatability of metabolic expression level but had no significant effect on the repeatability of thermal sensitivity. Overall, our results highlight that inter-individual variability and repeatability of thermal reaction norms can be substantial. We conclude that these consistent differences among individuals should not be overlooked when apprehending the ecological and evolutionary effects of climate change.
Keywords: body mass, ectotherms, metabolic theory of ecology, phenotypic plasticity, reaction norms, repeatability, universal thermal dependence hypothesis
Introduction
Metabolic rate is a key physiological trait that correlates with fitness (Pettersen et al. 2016) and has a strong influence on energy fluxes within and across ecosystems (Brown et al. 2004). Variation in metabolic rate has thus important implications for both evolution and ecology. The metabolic theory of ecology (MTE, Brown et al. 2004) provides a powerful and popular mechanistic framework to investigate 1) the effects of body mass and temperature on individual-level metabolic rate and 2) how these effects scale up to higher levels of biological organisation, i.e. population, community and ecosystems (Allen et al. 2005). According to the MTE, the thermal dependence ––––––––––––––––––––––––––––––––––––––––
Repeatable inter-individual variation in the thermal sensitivity of
metabolic rate
Tom Réveillon, Thibaut Rota, Éric Chauvet, Antoine Lecerf and Arnaud Sentis
T. Réveillon, T. Rota (https://orcid.org/0000-0002-2195-0529), É. Chauvet (https://orcid.org/0000-0001-8676-392X) and A. Lecerf (https://orcid. org/0000-0002-7802-9773), EcoLab, Univ. de Toulouse, CNRS, INP, UPS, Toulouse, France. – A. Sentis (https://orcid.org/0000-0003-4617-3620)
of metabolism follows the Arrhenius law, predicting an expo-nential increase of chemical reaction rate with temperature. Interestingly, the MTE predicts that the sensitivity of meta-bolic rate to temperature (i.e. the activation energy of the Arrhenius thermal reaction norm, which indicates how fast metabolic rate increases with temperature) should vary little across taxa around an average value of 0.65 eV (Gillooly et al. 2001). This prediction is based on the assumption that cell kinetics driving organisms’ functions react with temperature following a unique canonical value for all living organisms. The MTE thus assumes a low and inconsistent variability of activation energy across time and space implying that indi-viduals within and among species respond to temperature with the same sensitivity. This universal thermal dependence (UTD) hypothesis and its assumptions have thus major implications for our understanding of ecological and evolu-tionary consequences of climate change. Without variations among individuals, evolution would not occur as natural selection primarily acts at the level of individual differences (Labocha et al. 2004). If variations are significant but incon-sistent through time, then there would be very little poten-tial for evolutionary response to climate change because the consistency of among-individual variability and the degree to which natural selection drives trait evolution are intricately related (Brodie and Russell 1999). For evolutionary response to occur, among individual trait variation has to be signifi-cant and consistent through time (i.e. repeatable) and across generations (i.e. heritable) (Dohm 2002). In other words, natural selection can still occur if the trait heritability is null but this would not lead to evolution. An alternative hypoth-esis to the UTD has been proposed by Clarke (2004) who argues that the temperature effect on the metabolic rate is not a universal process but rather the result of an evolutionary tradeoff between the energetic expenditures associated to an environmental temperature and the physiological function-ing inherent to each individual. Accordfunction-ing to this alternative hypothesis, activation energy is expected to vary substantially and consistently among individuals to allow natural selec-tion and evoluselec-tionary adaptaselec-tion to local thermal condiselec-tions (Murren et al. 2014). Therefore, as an alternative to the UTD hypothesis, we hypothesise that the large intraspecific vari-ability of activation energy of metabolic rate is repeatable among individuals. Assessing whether activation energy of metabolic rate varies among individuals and environmental conditions is thus crucial to test these two alternative hypoth-eses and assess the potentiality for evolutionary responses to new selective pressures such as climate change.
Previous studies reported that metabolic reaction norms to temperature can vary among individuals (Careau et al. 2014) or populations and also depend on other environmental fac-tors such as food availability and latitude (Giebelhausen and Lampert 2001, Lovegrove 2005, Petit and Vézina 2014), as well as covary with behaviour and life-history traits (Moe et al. 2009, Mathot et al. 2018). Altogether, these studies already improved our understanding of the factors driving variations in the thermal reaction norm of metabolic
rate. Moreover, there is a growing number of studies inves-tigating whether inter-individual differences in thermal reaction norm of metabolic rate are maintained over time or across environments (i.e. if they are repeatable sensus Killen et al. 2016). Previous intraspecific studies reported among-individual variations in standard metabolic rate and found these variations repeatable over different time scales and environmental conditions (Marais and Chown 2003, Nespolo et al. 2003, Terblanche et al. 2004, Lardies et al. 2008, Norin and Malte 2011). Repeatability estimates var-ied mostly between 0.60 and 0.80 for the standard metabolic rate of laboratory and wild populations (Nespolo and Franco 2007). In addition, recent studies found that the thermal sensitivity of reaction norm of individual metabolic rate was repeatable (Careau et al. 2014, Auer et al. 2018). However, most previous studies only used a limited number of experi-mental temperatures and focused on the repeatability of the metabolic expression level (i.e. intercept) and mostly ignored the repeatability of among-individual differences in the slope of thermal reaction norms (Marais and Chown 2003, Nespolo et al. 2003, Terblanche et al. 2004, Lardies et al. 2008, Norin and Malte 2011). In addition, these previous studies did not use the MTE framework to analyse meta-bolic rate. Instead, they assumed linear relationship between temperature and respiration rate and thus potentially over-estimated repeatability because of the exponential thermal dependence of metabolic rate, which increases the among-individual variance at high temperature. Finally, as these previous studies on the repeatability of metabolic rate at dif-ferent temperatures did not use the MTE framework, they also did not test the assumption of the UTD hypothesis regarding the variability and consistency of the activation energy of metabolic rate.
We tested the abovementioned UTD hypothesis by mea-suring the metabolic rate of Gammarus fossarum in respirom-etry vials at six temperatures for each individual twice. The thermal reaction norms of metabolic rate of each individual and for each trial was assessed using the MTE model to esti-mate the slope of the reaction norm (i.e. the activation energy in eV) and its intercept (i.e. the metabolic expression level). The repeated design allowed us to both estimate the among-individual variability of activation energy and to test if this variability was repeatable across time. Following the UTD, we expected the inter-individual variation in activation energy (i.e. the slope of the reaction norm of the logarithm of metabolic rate to temperature expressed in an inverse scale; i.e. an Arrhenius plot) to be insignificant and not consistent across time (i.e. no significant repeatability). Furthermore, we expected inter-individual variation of the thermal reac-tion norm intercept, as well as its repeatability, to be mainly explained by individuals’ body mass, since the MTE predicts body mass influences the intercept of metabolic thermal reac-tion norm, but not its slope (Brown et al. 2004). By testing the UTD and MTE predictions, our study helps to better understand the variability and repeatability of metabolic thermal reaction norms at the intraspecific level, which has
important implications for the ecological and evolutionary consequences of climate change.
Material and methods
Biological model and experimental design
The biological model used, the amphipod Gammarus fossa-rum, is a widespread crustacean species in European streams. A large pool of individuals was collected from submerged leaf litter sampled from a pristine first-order woodland stream in the Montagne Noire, south-western France. They were kept in a 50-l tank filled with stream water with constant oxygen supply in a cool (10°C) dark place in the laboratory for two weeks. We then measured the routine metabolic rate (RMR) of 60 individuals selected to cover a broad spectrum of body mass (1.15–7.50 mg), each exposed sequentially to six temperatures (5, 8, 11, 14, 17 and 20°C) in increasing order. The limits of this thermal range coincided with the minimal and maximal temperatures experienced by the focal population in winter and summer, respectively (Pöckl 1992).
Metabolic rate measurement
Routine metabolic rate (RMR) was measured using a fluo-rescence-based multichannel respirometer consisting of three 24-well multi-dishes, with each well coupled with a photo-chemical sensor. Gammarids were kept in water at ~5°C the night preceding the respiration measurements. At the onset of the first measurement, they were randomly added in wells filled with 3 ml of oxygen-saturated water and kept in the dark for ~30 min before sealing the wells with a hermetic lid. Four wells on each multi-dish were left without animals and used as blanks. After ~2 additional min in the dark without any manipulation for animals to explore the experimental device and be less stressed, we recorded respiration rate. At the end of the measurement, temperature was then progressively increased over a duration of ca 30 min including the stabilisa-tion (± 0.5°C) near the target value before the beginning of a new measurement. During this 30 min period, gammarids were not manipulated and kept in the dark to minimise stress associated to experimental manipulation. Our methods were designed to 1) avoid excessive manipulation of organisms and thus to limit measurement biases linked to stress responses and 2) mimic a progressive increase of temperature, as organ-isms could experience in nature, for instance during nyc-themeral temperature variations in small streams. Dissolved oxygen concentrations were then recorded every 15 s over 35–50 min. Time series were truncated at both ends in order to keep the most linear portion of the oxygen depletion curves. RMR was calculated as the slope of oxygen depletion (in mol O2 day−1) over a ca 20 min timeframe. Values were converted into carbon release rate (in mg C day−1) assuming a respiratory coefficient of 0.78 (as estimated for Gammarus pulex, Wright and Wright 1979). All individuals followed the same experimental protocol twice, one week apart. After the
second respiration trial, they were frozen at −15°C, freeze-dried for 24 h and weighed to the nearest 0.001 mg. The final dataset included 54 individuals as we removed individuals for which data were missing due to death (n = 3), or discarded due to abnormally low respiration rates (n = 1) or incoher-ent (i.e. negative) response to increasing temperature (n = 2). 25 observations out of the 648 individual data points from the 108 thermal reaction norms were not included in the analyses as they were conceivably measurement errors.
Statistical analyses
Following the MTE, we expressed per capita (I) or mass-corrected (IMb) RMR as a function of water temperature
(T in Kelvin) using the Arrhenius equation: I orIMb =αe−Ea
(
k TB − k TB)
1 1
0 (1)
where b is the mass-scaling exponent, α is the metabolic expression level at the reference temperature (T0), Ea the
activation energy (eV), M the body mass (mg) and kB the
Boltzmann’s constant (8.62 × 10⁻⁵ eV K−1). As reference temperature T0, we used the median of the experimental tem-perature range (i.e. 12.5°C). α and Ea were estimated using
linear mixed-effects models with random slope and inter-cept fitted to log-transformed metabolic rates. Standardised inverse temperature (1/kBT − 1/kBT0) and individual were included as fixed and random factors, respectively. As indi-vidual metabolic response to increasing temperature was assessed twice, the model was fitted to the dataset from each experimental trial separately. Paired t-test was used to compare results from the two models for trial 1 and 2.
We estimated the mass-scaling exponent (b) using a linear mixed-effect model with standardized inverse temperature and the logarithm of body mass as fixed factors and individual as random factor. We then used slope and back-transformed intercept estimates from the per capita (I) and mass-corrected (IMb) models for each trial to estimate the repeatability of
activation energy (i.e. slope) and metabolic expression level at the reference temperature (i.e. intercept) over time. For each variable (i.e. slope or intercept), we calculated the intraclass correlation coefficient (ICC) following Nakagawa and Schielzeth (2010): ICC = + V V V 1 1 2 (2) where V1 is the inter-individual variance and V2 is the residual intra-individual variance, obtained from the random effect components of the linear mixed effect models (Nakagawa and Schielzeth 2010). To assess the significance of estimated ICCs, we used likelihood ratio tests to compare a linear mixed-effect model including a random effect for individuals to a generalised least square model without random effect; both fitted using the maximum likelihood (ML) estimation
method (Bates et al. 2015). ICC values are indicators of repeatability level, and are bounded between zero to one. We considered ICC values between 0.1 and 0.2 as low repeat-ability, between 0.2 and 0.4 as moderate repeatrepeat-ability, and between 0.4 and 1 as high repeatability. In addition, boot-strapped 95% confidence intervals were computed for each ICC value based on 1000 bootstrap iterations, to determine if ICCs values were significantly different from zero (i.e. when 95% confidence intervals do not overlap with zero) (Gardner and Altman 1986).
Statistical analyses were computed using the R ver. 3.3.3 (< www.r-project.org >). Linear mixed effect models and ICC 95% confidence intervals were respectively computed using the lmer and bootMer functions from the ‘lme4’ package (Bates et al. 2015). Likelihood ratio tests were com-puted using the anova function from the ‘nlme’ package
(Pinheiro et al. 2018) and graphics were obtained using the ggplot2 package (Wickham 2016).
Data deposition
Data are available from the Dryad Digital Repository: < http:// dx.doi.org/10.5061/dryad.6897qf2 > (Réveillon et al. 2019).
Results
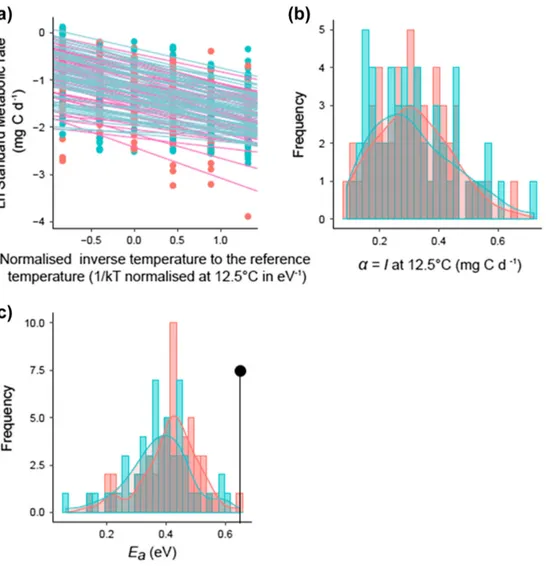
As predicted by the MTE, we found that the Arrhenius equation describes well the temperature dependence of metabolic rate in Gammarus fossarum (Fig. 1a). Moreover, we estimated a mass-scaling exponent (b) of 0.86 used for the mass-correction of metabolic rate, and the aver-age activation energy was 0.40 eV, which is lower than the
Figure 1. Inter-individual variability of thermal reaction norms for metabolic rate. (a) Arrhenius plot of linearised reaction norms of meta-bolic rate (log-transformed) to temperature (i.e. inverse temperature normalised to the reference temperature of 12.5°C). Each line corre-sponds to the reaction norm for an individual at a given trial (lines were obtained from linear mixed-effect models, see main text for details). (b–c) Histogram and kernel density curves of (b) intercept α (i.e. metabolic expression level I at 12.5°C, in mg C day−1); and (c) slope E
a
distributions (i.e. sensitivity of metabolic rate to temperature, in eV) estimated from linear mixed effect-models. The black line in (c) shows the activation energy value predicted by the universal thermal dependence (UTD) hypothesis (Ea = 0.65 eV). Red and blue graphic items
0.65 eV predicted by the MTE. Nevertheless, we found substantial inter-individual variations in the thermal sen-sitivity (i.e. slope) and metabolic expression level at the reference temperature (i.e. intercept). Predicted routine metabolic rate (RMR) at 12.5°C ranged from 0.09 to 0.72 mg C day−1 and did not differ significantly between the two trials (mean = 0.31 and 0.32 mg C day−1 for trial 1 and 2, t53 = −0.04, p = 0.97; Fig. 1b). Activation energies (i.e. slopes) for the RMR ranged from 0.06 to 0.64 eV (Fig. 1b). They were slightly higher in the first trial than the second one (mean = 0.41 and 0.38 eV, t53 = 2.54, p = 0.014), but their ranges broadly overlapped (trial 1: 0.14–0.64 eV; trial 2: 0.06–0.60 eV; Fig. 1c).
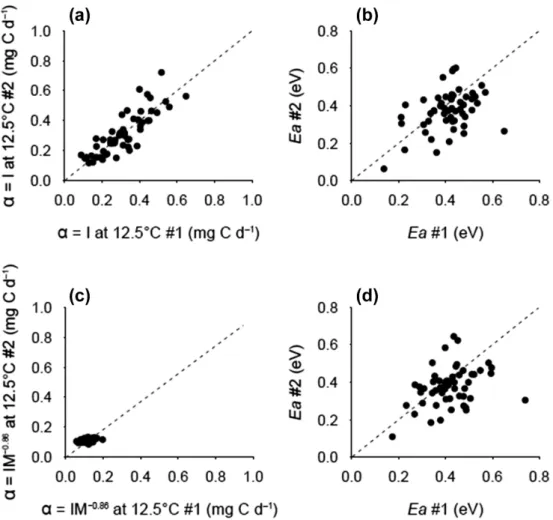
When we investigated the repeatability of the intercept and slope of the thermal reaction norm, we found that both metabolic expression level and thermal sensitivity variation were consistent between the two trials, with ICC estimates for intercepts and slopes always significantly greater than zero, both for per capita and mass-corrected RMR (Fig. 2,
Table 1). In other words, variations among individuals were not randomly distributed but were consistent across time.
We found the highest ICC value (i.e. 0.83 [0.73–0.90] 95% CI) for the intercept of per capita RMR, indicat-ing that individuals consistently differ in their metabolic expression level at the reference temperature. Interestingly, after correcting for body mass, the ICC value of the inter-cept dropped to 0.27 [0.02–0.50] (95% CI) indicating that the high ICC value of the intercept of the per capita RMR (i.e. 0.83) was, in its majority, explained by inter-individual variations in body mass. In contrast, accounting for body mass did not significantly influence the ICC value of the activation energy, although the ICC value for mass-corrected RMR tended to be lower than for per capita RMR (0.29 [0.04–0.53] 95% CI and 0.38 [0.13–0.59] 95% CI, respectively; Table 1). In other words, inter-individual variation in body mass did not significantly contribute to the relatively high ICC value of the activation energies (Fig. 2, Table 1).
Figure 2. Inter-individual repeatability of (a) metabolic expression level α (intercepts, corresponding to the routine metabolic rate I at 12.5°C), and (b) metabolic thermal sensitivity Ea (in eV) between the first (x-axis) and the second (y-axis) trials. (c–d) Inter-individual
repeatability of mass-corrected (IM−0.86) (c) metabolic expression levels α, and (d) metabolic thermal sensitivity E
a between the first (x-axis)
and the second (y-axis) trials. Inter-individual variance of mass-corrected intercepts decreased compared to when body mass was not accounted for (panels c versus a). Inter-individual variance of metabolic thermal sensitivity was not substantially affected when correcting resting metabolic rate by body mass (d and b). Proportional lines (1:1 dashed lines) theoretically depict perfect repeatability.
Discussion
The thermal dependence of metabolic rate is of particular interest in the context of global warming as metabolic rate represents the ‘pace-of-life’ of ectotherm organisms and is thus of importance for behaviour and fitness (Killen et al. 2013, Pettersen et al. 2016, Mathot et al. 2018) as well as for ecological and evolutionary responses of populations to cli-mate change. The universal thermal dependence hypothesis (Gillooly et al. 2001) proposes that the thermal dependence of metabolic rate varies little among and within species and, if variation within species occurs, it is not consistent over time. If the UTD hypothesis is verified at the intraspecific level, then we might expect a limited potential for popula-tions to adapt to climate change as evolution requires con-sistent variations among individuals. In contrast to the UTD hypothesis, we found that activation energy (i.e. slope) and metabolic expression level (i.e. intercept) of thermal reaction norms are highly variable among Gammarus fossarum indi-viduals and these inter-individual differences were consistent over time. We also found a lower average activation energy than the universal value, suggesting substantial differences in metabolic rate–temperature relationship estimations between intraspecific and interspecific studies. Clarke (2004) argues that such deviations from the UTD hypothesis could result from an evolutionary tradeoff between thermal energy expen-ditures and physiological functioning. According to this hypothesis, individuals constantly optimise their energetics by adjusting metabolic demands in response to a temperature increase, leading to a lower activation energy than predicted by the UTD hypothesis. Our study thus questions the valid-ity of the universal activation energy value at the intraspecific level and highlights that individual thermal sensitivity and metabolic expression level are repeatable traits of individu-als, suggesting a greater potential for adaptation to climate change than previously thought under the framework of the metabolic theory of ecology.
Multiple factors could explain the repeatability of the thermal reaction norm for metabolic rate. Genetic deter-minants coupled with the thermal conditions experienced during early development (i.e. developmental plasticity) can generate variation among individuals (Arnqvist et al. 2010, Latimer et al. 2011). Moreover, these determinants are likely to involve changes in biological traits of individu-als such as body mass, which is generally responsible for a large amount of the variation in cellular metabolic activities
(Boratynski et al. 2017). Here, we found that the repeatabil-ity of the metabolic expression level (i.e. the intercept) was approximately three times lower when metabolic rate was corrected for body mass. In contrast, the repeatability of the thermal sensitivity (i.e. the slope) was not significantly differ-ent with or without body mass correction. In other words, body mass variations among individuals largely contributed to the repeatability of the metabolic expression level but not to the repeatability of the thermal sensitivity. This finding is in agreement with the MTE model where the thermal sensi-tivity (i.e. the activation energy) is independent of body mass whereas the metabolic expression level at a given temperature depends on body mass with a ¾ scaling exponent. As individ-uals were measured twice – and their body mass did not likely significantly vary in-between measurements –, accounting for body mass decreased variations in metabolic expression levels associated with among individual difference in body mass, resulting in lower repeatability estimates. While the mecha-nisms explaining why individuals consistently differ in their thermal sensitivity, and its integration with other phenotypic traits remain to be investigated in more details, our results indicate that contrary to the UTD hypothesis, individuals of a given population can systematically differ in their sensitiv-ity to temperature changes.
Our results of consistent differences in the thermal sensi-tivity of individuals suggest the presence of different ‘thermal types’ (Artacho et al. 2013, Goulet et al. 2016, Mell et al. 2016), with ‘fast’ ones being more sensitive to rising tem-perature than ‘slow’ ones. Because high metabolic rate is often associated with high fitness costs (Baudron et al. 2014, Moffett et al. 2018), we may hypothesise that with global warming, ‘fast type’ individuals will be counter-selected as their metabolic rate increases faster with temperature than in ‘slow type’ ones. Moreover, body mass variation among individuals may play an important role in the evolution-ary response to warming as larger individuals have higher metabolic expression level (i.e. intercept) than smaller ones (Boratynski et al. 2017). We may thus predict a positive selection for small individuals having a lower expression level and ‘slow type’ individuals being less sensitive to warming. This hypothesis could explain the overall body size reduc-tion observed within ectotherm populareduc-tions from various ecosystems (Daufresne et al. 2009, Gardner et al. 2011, Forster et al. 2012). Such a selection would drive populations to have even higher energy requirements than predicted by the MTE as the per unit of mass energy requirement decreases
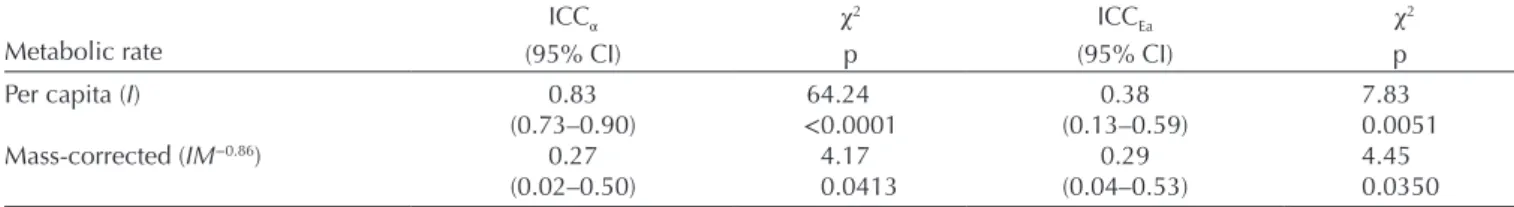
Table 1. Intraclass correlation coefficient (ICC) mean values and 95% confidence intervals (95% CI) for routine metabolic rate at 12.5°C (α) and activation energy (Ea) estimated from per capita (I) or mass-corrected (IM−0.86) routine metabolic rate. ICC significance was estimated
by a likelihood-ratio test (χ2 and related p).
Metabolic rate
ICCα χ2 ICC
Ea χ2
(95% CI) p (95% CI) p
Per capita (I) 0.83 64.24 0.38 7.83
(0.73–0.90) <0.0001 (0.13–0.59) 0.0051
Mass-corrected (IM−0.86) 0.27 4.17 0.29 4.45
with body mass (Moffett et al. 2018). However, adaptive pro-cesses associated with selection on metabolic thermal traits could be expected to balance this energetic disequilibrium. Individuals would reduce their metabolic thermal sensitivity to mitigate the increase in energy expenditure with warming, leading to lower activation energy values than the predicted 0.65 eV. Consistent with this hypothesis, Moffett et al. (2018) reported that populations from warmer habitats have a lower thermal sensitivity than populations from cooler habitats.
Our study is a first step toward a better integration of intra-specific variation within the MTE framework, and calls for further studies to improve our understanding of the repeat-ability of thermal reaction norm of metabolic rate. First, recent studies suggest that body mass and temperature effects on metabolic rate may not be independent and reported changes in the mass-scaling exponent value (b) with tempera-ture (Glazier 2010, 2018, Killen et al. 2010, Ohlberger et al. 2012). Such changes can modulate the relative importance of body mass in driving metabolic response along tempera-ture gradients which may have consequences for the strength of intraspecific competition among different-sized individu-als under climate change (Ohlberger et al. 2011). Therefore, the relevance of the interaction between the body mass and temperature on metabolic rate and the extent to which it may influence the repeatability of individual metabolic rate should be explored. Second, previous studies reported that thermal acclimation can modulate the acute effects of tem-perature on metabolic rate (Xie et al. 2017). In the present study, our first objective was to the test the UTD hypothesis, which does not take into account potential effects of acclima-tion. As a result, we did not acclimate animals to the experi-mental temperature before measurement. Further studies are thus needed to investigate how acclimation can modulate the repeatability of thermal reaction norms. Third, while the UTD hypothesis is based on basal and standard metabolic rate, we measured routine metabolic rate (i.e. animals were free to move within the experimental arena), which poten-tially integrates behavioural components such as locomotion activity. Inter-individual differences in activation energy may thus be partially explained by different behavioural thermal types (Sih et al. 2004) forming, with metabolic thermal types, an overall thermal syndrome (Goulet et al. 2016). It would thus be interesting to compare repeatability estimates for standard and routine metabolic rates to determine the rel-ative contribution of behavioural responses to the variation and repeatability of activation energy and metabolic expres-sion level. Finally, it would also be important to compare the repeatability and heritability of thermal reaction norm as repeatability does not necessarily imply heritability. It is the latter that mostly count for evolution (Dohm 2002) as natural selection cannot lead to evolution if trait heritability is non-significant.
We conclude that, contrary to the UTD hypothesis, con-sistent inter-individual differences in the thermal sensitivity of metabolic rate can occur, which has implications for our understanding of ecological and evolutionary responses of
organisms and ecosystems to climate change. Our study thus highlights the importance of considering inter-individual differences in thermal reaction norms when aiming to understand the effects of global warming on natural popu-lations. Future studies should now address the biologi-cal features that explain variations among individuals, the repeatability of these differences and the relevance of thermal sensitivity of metabolic rate to evolution and ecology of wild populations.
Acknowledgements – We are thankful to S. Lamothe, F. Julien
and D. Lambrigot for their involvement in the installation of the experiments.
Funding – This work is part of the Functional Streams project
funded by the French National Research Agency (grant ANR-14-CE01-0009-01).
Conflicts of interest – The authors have no conflicts of interest to
declare.
Author contributions – ThR and AS compiled the first ideas, and
ThR, AS, AL and EC designed the experiments. ToR performed fieldwork, laboratory experiments and statistical analyses with the assistance of ThR, AL and AS. ToR wrote the first drafts of the manuscript, which benefited from contributions of all authors until its final form.
References
Allen, A. P. et al. 2005. Linking the global carbon cycle to individual metabolism. – Funct. Ecol. 19: 202–213.
Arnqvist, G. et al. 2010. Genetic architecture of metabolic rate: environment specific epistasis between mitochondrial and nuclear genes in an insect. – Evolution 64: 3354–3363. Artacho, P. et al. 2013. Interindividual variation in thermal
sensitivity of maximal sprint speed, thermal behavior and resting metabolic rate in a lizard. – Physiol. Biochem. Zool. 86: 458–469.
Auer, K. S. et al. 2018. Individuals exhibit consistent differences in their metabolic rates across changing thermal conditions. – Comp. Biochem. Physiol. A 217: 1–6.
Bates, D. et al. 2015. Fitting linear mixed-effects models using lme4. – J. Stat. Softw. 67: 1–48.
Baudron, A. R. et al. 2014. Warming temperatures and smaller body sizes: synchronous changes in growth of North Sea fishes. – Global Change Biol. 20: 1023–1031.
Boratynski, J. S. et al. 2017. Individual differences in the phenotypic flexibility of basal metabolic rate in siberian hamsters are consistent on short and long-term timescales. – Physiol. Biochem. Zool. 90: 139–152.
Brodie, E. D. and Russell, N. H. 1999. The consistency of individual differences in behaviour temperature effects on antipredator behaviour in garter snakes. – Anim. Behav. 57: 445–451. Brown, J. H. et al. 2004. Toward a metabolic theory of ecology.
– Ecology 85: 1771–1789.
Careau, V. et al. 2014. Individual (co)variation in thermal reaction norms of standard and maximal metabolic rates in wild-caught slimy salamanders. – Funct. Ecol. 28: 1175–1186.
Clarke, A. 2004. Is there a universal temperature dependence of metabolism? – Funct. Ecol. 18: 252–256.
Daufresne, M. et al. 2009. Global warming benefits the small in aquatic ecosystems. – Proc. Natl Acad. Sci. USA 106: 12788–12793.
Dohm, M. 2002. Repeatability estimates do not always set an upper limit to heritability. – Funct. Ecol. 16: 273–280.
Forster, J. et al. 2012. Warming-induced reductions in body size are greater in aquatic than terrestrial species. – Proc. Natl Acad. Sci. USA 109: 19310–19314.
Gardner, M. J. and Altman, D. G. 1986. Confidence intervals rather than p values: estimation rather than hypothesis testing. – Br. Med. J. 292: 746–750.
Gardner, J. L. et al. 2011. Declining body size: a third universal response to warming? – Trends Ecol. Evol. 26: 285–291. Giebelhausen, B. and Lampert, W. 2001. Temperature reaction
norms of Daphnia magna: the effect of food concentration. – Freshwater Biol. 46: 281–289.
Gillooly, J. F. et al. 2001. Effects of size and temperature on metabolic rate. – Science 293: 2248–2251.
Glazier, D. S. 2010. A unifying explanation for diverse metabolic scaling in animals and plants. – Biol. Rev. 85: 111–138. Glazier, D. S. 2018. Effects of contingency versus constraints
on the body-mass scaling of metabolic rate. – Challenges 9: 1–14.
Goulet, C. T. et al. 2016. Repeatability and correlation of physiological traits: do ectotherms have a ‘thermal type’? – Ecol. Evol. 7: 710–719.
Killen, S. S. et al. 2010. The intraspecific scaling of metabolic rate with body mass in fishes depends on lifestyle and temperature. – Ecol. Lett. 13: 184–193.
Killen, S. S. et al. 2013. Environmental stressors alter relationships between physiology and behaviour. – Trends Ecol. Evol. 28: 651–658.
Killen, S. S. et al. 2016. Context dependency of trait repeatability and its relevance for management and conservation of fish populations. – Conserv. Physiol. 4: 1–19.
Labocha, M. K. et al. 2004. Individual variation and repeatability of basal metabolism in the bank vole, Clethrionomys glareolus. – Proc. R. Soc. B 271: 367–372.
Lardies, M. A. et al. 2008. The cost of living slowly: metabolism, Q10 and repeatability in a South American harvestman.
– Physiol. Entomol. 33: 193–199.
Latimer, C. A. et al. 2011. Quantitative genetic variation for thermal performance curves within and among natural popula-tions of Drosophila serrata. – J. Evol. Biol. 24: 965–975. Lovegrove, B. G. 2005. Seasonal thermoregulatory responses in
mammals. – J. Comp. Physiol. B 175: 231–247.
Marais, E. and Chown, S. L. 2003. Repeatability of standard metabolic rate and gas exchange characteristics in a highly variable cockroach, Perisphaeria sp. – J. Exp. Biol. 206: 4565–4574.
Mathot, K. J. et al. 2018. The covariance between metabolic rate and behaviour varies across behaviours and thermal types: meta-analytic insights. – Biol. Rev. 94: 1056–1074.
Mell, H. et al. 2016. Do personalities co-vary with metabolic expenditure and glucocorticoid stress response in adult lizards? – Behav. Ecol. Sociobiol. 70: 951–961.
Moe, B. et al. 2009. Metabolic ageing in individual zebra finches. – Biol. Lett. 5: 86–89.
Moffett, E. R. et al. 2018. Local adaptation reduces the metabolic cost of environmental warming. – Ecology 99: 2318–2326. Murren, C. J. et al. 2014. Evolutionary change in continuous
reaction norms. – Am. Nat. 183: 4.
Nakagawa, S. and Schielzeth, H. 2010. Repeatability for Gaussian and non-Gaussian data: a practical guide for biologists. – Biol. Rev. Camb. Phil. Soc. 85: 935–956.
Nespolo, R. F. and Franco, M. 2007. Whole-animal metabolic rate is a repeatable trait: a meta-analysis. – J. Exp. Biol. 210: 2000–2005.
Nespolo, R. F. et al. 2003. Intra-population variation in the standard metabolic rate of insects: repeatability, thermal dependence and sensitivity (Q10) of oxygen consumption in a cricket. – J. Exp.
Biol. 206: 4309–4315.
Norin, T. and Malte, H. 2011. Repeatability of standard metabolic rate, active metabolic rate and aerobic scope in young brown trout during a period of moderate food availability. – J. Exp. Biol. 214: 1668–1675.
Ohlberger, J. et al. 2011. Temperature-driven regime shifts in the dynamics of size-structured populations. – Am. Nat. 177: 211–223.
Ohlberger, J. et al. 2012. Intraspecific temperature dependence of the scaling of metabolic rate with body mass in fishes and its ecological implications. – Oikos 121: 245–251.
Petit, M. and Vézina, F. 2014. Reaction norms in natural conditions: how does metabolic performance respond to weather variations in a small endotherm facing cold environments? – PLoS One 9: e113617.
Pettersen, A. K. et al. 2016. Metabolic rate covaries with fitness and the pace of the life history in the field. – Proc. R. Soc. B 283: 20120323.
Pinheiro, J. et al. 2018. nlme: linear and nonlinear mixed effects models. – R package ver. 3.1-137. <https://svn.r-project.org/R-packages/trunk/nlme>.
Pöckl, M. 1992. Effects of temperature, age and body size on moulting and growth in the freshwater amphipods
Gammarus fossarum and Gamamrus roeseli. – Freshwater Biol.
27: 211–225.
Réveillon, T. et al. 2019. Data from: repeatable inter-individual variation in the thermal sensitivity of metabolic rate. – Dryad Digital Repository, <http://dx.doi.org/10.5061/ dryad.6897qf2>.
Sih, A. et al. 2004. Behavioral syndromes: an integrative overview. – Q. Rev. Biol. 79: 241–277.
Terblanche, J. S. et al. 2004. Metabolic rate variation in Glossina
pallidipes (Diptera: Glossinidae): gender, ageing and repeatability.
– J. Insect. Physiol. 50: 419–428.
Wickham, H. 2016. ggplot2: elegant graphics for data analysis. – Springer, pp. 1–221.
Wright, E. A. and Wright, A. A. 1979. The respiratory quotient of
Gammarus pulex L. – Comp. Biochem. Physiol. 53: 45–46.
Xie, H. et al. 2017. Effects of acute temperature change and temperature acclimation on the respiratory metabolism of the snakehead. – Turk. J. Fish. Aquat. Sci. 17: 535–542.