O
pen
A
rchive
T
OULOUSE
A
rchive
O
uverte (
OATAO
)
OATAO is an open access repository that collects the work of Toulouse researchers and
makes it freely available over the web where possible.
This is an author-deposited version published in :
http://oatao.univ-toulouse.fr/
Eprints ID : 18192
To link to this article :
DOI: 10.1109/EIC.2016.7548648
URL :
http://dx.doi.org/10.1109/EIC.2016.7548648
To cite this version :
Abadie, Cédric and Billard, Thibaut and Lebey,
Thierry Influence of pressure on partial discharge spectra. (2016) In: EIC
2016 (Electrical Insulation Conference), 19 June 2016 - 22 June 2016
(Montréal, Canada).
Any correspondence concerning this service should be sent to the repository
administrator:
[email protected]
Influence of pressure on partial discharge spectra
Cedric ABADIE
1, 2and Thibaut BILLARD
11IRT Antoine de Saint Exupéry 118 Route de Narbonne, 31432 Toulouse, France
Thierry LEBEY
22Laboratoire Laplace, CNRS-UPS-INP, 118 Route de Narbonne, 31062 Toulouse, France
Abstract— In the near future, the aircrafts will become more
compact and lighter, since hydraulic, pneumatic or mechanical systems will be replaced by electrical ones. The network voltage is expected to increase far above Paschen’s minimum, thus increasing the risk of partial discharges. These discharges, also known as silent enemies, may affect the reliability of the systems. Moreover, some electrical equipments are located in unpressurized areas so their operating conditions (temperature, pressure) may change in a large range. These environmental parameters (and their cycling) have a large impact on discharge inception voltage and may even modify its nature. This paper deals with the influence of the pressure on partial discharges and more particularly on the modification of partial discharges spectra with pressure. Twisted pairs of enamel wires were subjected to repetitive square voltage waveform and sinusoidal voltage at various pressures.
Keywords—partial discharges; PWM inverter; non-intrusive sensor; twisted pair; pressure; partial discharges spectra;
I. INTRODUCTION
In the “more electrical aircrafts” approach, hydraulic and/or pneumatic systems will be gradually replaced by electrical systems. This increased demand of electrical power leads to a rise of the network voltage from 115Vac to 230Vac and/or from 270VDC to 540VDC. On the other hand, the widespread use of inverter drives (generally characterized by large dV/dt) will increase the electrical stresses on the insulation system. The voltage rise together with large dV/dt values increase the risk of partial discharges (PD) ignition [1]. These discharges, known as the silent enemies, will affect the reliability of the equipment. Last, but not least, some of the electrical equipments may be located in unpressurized area and, while operating; the temperature can vary in a very wide range. These parameters have an influence on discharges inception voltage and may also modify their nature. Therefore, for such operating conditions, it is important to pay particular attention to the detection system characteristics in order to have the best signal to noise ratio while filtering the noise induced by the voltage switchings.
Compared to conventional PD measurements under ac and DC voltages, PD’s detection under repetitive impulse voltage appears more complex. The detection in the VHF [30-300MHz] and UHF [300-3000MHz] range is one of the most widely used technique offering a high signal to noise ratio (SNR). Changes in the semiconductors devices technology (from Si to SiC and/or GaN for eg.) lead to use components
presenting shorter rise times, inducing changes in the interference spectrum. The spectrum spreads to higher frequencies and it becomes more difficult to distinguish PD signals from these interferences [1]. In addition, a decrease in the pressure modifies the rise time of the PD pulses and therefore of the discharge spectrum [2, 3].
This study focuses on the influence of the parameters listed previously (i.e. pressure, voltage shape and amplitude) on the frequency contents of the partial discharge characteristics. The results show the impact of operating conditions not only on the partial discharge inception voltage but also on the nature of the discharge itself and, as a result, on its detection. Partial discharges in twisted pair of enamel wires are investigated with a new non-intrusive method at different pressure in air. The impact of two different kinds of power supply is studied; a homemade one-phase PWM inverter and a high voltage ac power supply.
II. EXPERIMENTAL SET-UP
The experimental set-up used was built in Laplace [4]. The use of a high pass filter with an electromagnetic sensor has proven to be successful to detect PDs in an electric machine fed by a square like bipolar voltage for off-line and/or on-line conditions. It consists in 5 key parts: sensor, filters, power supply, acquisition and samples.
A. PWM and ac power supply
The PWM like voltage shape is created by a homemade PWM inverter associated with a 1.7 kV DC voltage power source (and back up current peaks up to 50 A). This bipolar pulse like generator allows testing low voltage electric motors. The IGBTs components are able to withstand around 1.5 kV, almost full use of the high power supply, to try to reach Partial Discharge Inception Voltage (PDIV). Several parameters of the bipolar inverter drive can be controlled, such as the duration of the pulses, the time between pulses, the switching frequency and the duty cycle.
The ac power supply was composed by two auto-transformers in series with a transformer to test the samples up to 3 kVrms.
B. Sensors
The sensor is a coaxial cable stripped to expose its core on 1cm and the inner insulator on 1 cm without any shielding.
This sensor naturally filters the noise in the low frequency range (up to 10-20 MHz).
Under ac voltage, a Rogowski coil was used as reference for the PDIV. The voltage induced in the coil is proportional to the rate of change of the current in the straight conductor. This current transformer has the advantage of providing galvanic isolation between the acquisition system and the high voltage circuit.
C. High-pass filtering
The use of a filter is necessary to detect PDs during the rise time and the switching. In order to detect PD with short rise time, the improvement of the signal to noise ratio (S/N) is a crucial step to measure small amplitude and high frequency signals amongst large amplitude and lower frequency signals. The bandwidth of the filter is the most important parameter. PD signal spectrum ranges, at least, up to 1GHz whereas significant noise generated by the PWM inverter does not exceed 100 MHz. A different cut-off frequency may be needed depending on the switching rise time. Obviously, the shortest the rise time, the highest the cut-off frequency.
D. Samples
The experiments were performed on twisted pair of enameled wires (nominal diameter Ø = 1,31 mm). The twisted pair samples are realized according to usual norms and prescriptions [5].
E. Signal acquisition
Data are displayed and recorded using a Tektronix MSO 5204 Digital Oscilloscope with a 2 GHz numerical bandwidth and 5 GS/s sampling rate for each channel.
III. RESULTS UNDER AC VOLTAGE
The aim of these tests is to determine the effect of the pressure on the nature of the discharge, and thus on the ability to detect it thanks to the frequency analysis and non-intrusive sensor. These tests will allow comparing PD spectra obtained under ac to the PWM ones.
A. Influence of the pressure and of the filtering on PDIV
First of all, the PDIV and partial discharge extinction voltage (PDEV) were determined for different pressures (Table 1). As a result the PDIV decreases with the pressure. This phenomenon corresponds to the expected behaviour and is in good agreement with Paschen's law.
TABLE I. PDIV AND PDEV FOR DIFFERENT VALUES OF PRESSURE (AC VOLTAGE)
1013mbar 700mbar 400mbar 100mbar
PDIV (Vpeak) 954 636 537 444
PDEV (Vpeak) 933 615 516 395
The influence of filtering on the PD signals as well as on the PDIV at 100 mbar is studied. The detecting conditions used here were the ones described for the tests realized under PWM like voltage, which require the use of high-pass filter as previously explained. The main idea is to study the impact of the pressure on the detection, due to the change in the nature of the discharge. In that case the frequency content may be modified which would require adapting the cut-off frequency to detect PDs. As the filter is suspected to induce errors on the PDIV, a study of its impact under ac voltage was conducted at low pressure (100 mbar). It is assumed that the PDIV value is the same for ac and PWM voltage supply.
Using high-pass filters, the measured PDIV is artificially increased (Table 2). The calibre of the trigger was defined in order to observe at least one discharge per period. The trigger amplitude gives information on the magnitude of the measured discharges. These tests were performed at 100 mbar with high pass filters presenting cut-off frequencies of 50, 90 and 200 MHz.
TABLE II. FILTERING INFLUENCE ON THE PDIV MEASURED ELECTRICALLY AT 100 MBAR (AC VOLTAGE)
Perceived
PDIV (Vpeak) Trigger level (mV)
Filter 50 MHz 444 2
Filter 90 MHz 636 1
Filter 200MHz 1315 0,5
It should be noted that the higher the cut-off frequency, the larger the PDIV. This is due to the fact that under such conditions, the high frequency components of the spectrum are too small. It is therefore necessary to increase the voltage to detect the signals due to partial discharge (which already appeared at 444 Vpeak). As an example, in the case of the 200MHz filter, the PDIV is about three times larger than the one measured thanks to the Rogowski sensor without filtering.
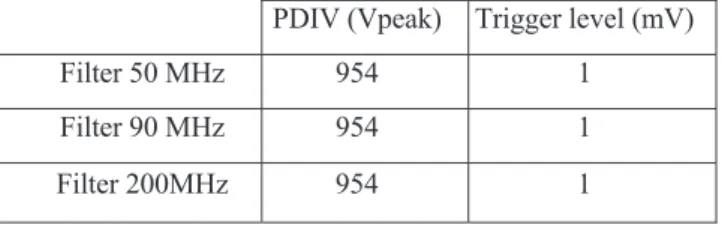
Such a phenomenon was not observed at atmospheric pressure: the cut-off frequency of the filters has no impact on the PDIV (Table 3).
TABLE III. FILTERING INFLUENCE ON THE PDIV MEASURED ELECTRICALLY AT 1013 MBAR (AC VOLTAGE)
PDIV (Vpeak) Trigger level (mV)
Filter 50 MHz 954 1
Filter 90 MHz 954 1
B. Influence of the pressure and of the filtering on PDIV
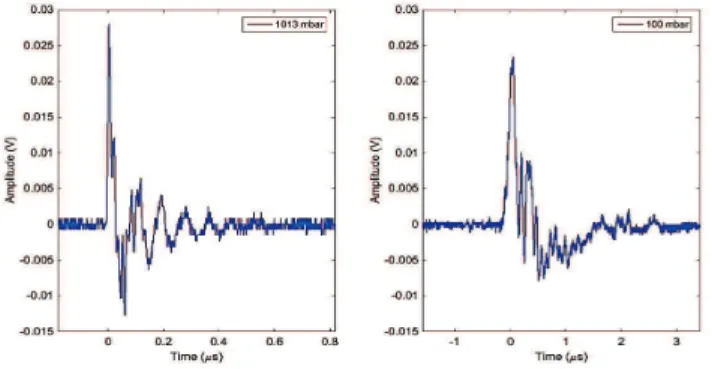
First of all, the shape of the discharge signals varies with the pressure (Fig. 1): both the discharge signal and the rise time durations are modified. This phenomenon was already reported in the literature [2][3].
Therefore, a study of the discharges frequency spectra for different pressures was realized. For each pressure, 30 acquisitions of PD were recorded, the spectrum of each of them was determined and their average value was plotted (Fig.2). The amplitude of the frequency components at atmospheric pressure is lower than the one obtained for pressures values of 700 mbar and 400 mbar.
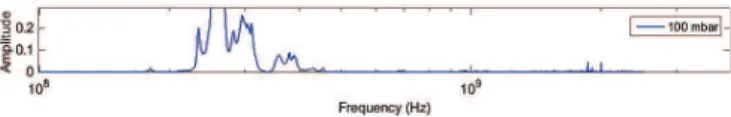
However the amplitude of the high frequency components decreases with the pressure. Indeed, even if the energy spectral density (ESD) at 100 mbar may be observed, the amplitude of the spectrum is very small. Moreover, for frequencies above 30 MHz the signal amplitude is almost null despite some rays around 50 MHz that may contain a small portion of the discharge energy. A zoom on the y-axis confirms this assumption with rays up to 70MHz (Fig. 3).
Fig. 1. PD signal shape (a) at 1013 mbar (b) at 100mbar (please note that a different time scale is used in a and b)
Fig. 2. Changes of PD spectrum under ac voltage as a function of pressure
Fig. 3. Zoom of PD spectrum under ac voltage at 100 mbar
IV. RESULTS UNDER PWM LIKE VOLTAGE
Same study was undertaken for PWM like voltage, assuming that the pressure has the same influence.
A. Influence of the pressure on PDIV
PDIV and PDEV were measured for different pressure values. Note that in this case, the voltage values are peak voltages. Discharges were detected using coaxial sensor analogically filtered using different cut-off frequencies (185, 290 and 390MHz). The PD signals were observed for the three different configurations simultaneously. Only the 390MHz filter provides full electromagnetic dV/dt noise removal.
TABLE IV. PDIV AND PDEV FOR DIFFERENT VALUES OF PRESSURE (PWM LIKE VOLTAGE)
1013 mbar 700 mbar 400 mbar 100 mbar
PDIV (V) 1056 912 840 670
PDEV (V) 1008 888 770 560
Not surprisingly, the PDIV value decreases with the pressure. Whatever the filter and the pressure (from 100 mbar to 1013 mbar), the PDIV remains the same. Once again, only the 390 MHz high-pass filter enables a full removal of the noise.
B. Influence of the pressure on frequency spectrum of the discharge
In order to confirm the influence of the pressure on the amplitude of the high frequency components, the same study than the one achieved under ac was realized for PWM like voltage.
Here again, 30 acquisitions were made for each pressure. The PDs signals were filtered with the different high-pass filters (190 MHz, 290 MHz and 395 MHz). The spectrum of each of them was calculated and their average was plotted for each pressure. As an example, Fig. 4 shows the spectral density of PD signals filtered at 190 MHz for the different pressures under study.
Fig. 4. Changes of PD spectrum under PWM like voltage as a function of pressure
The ESD of the PD signals under such conditions extends on a wider frequency range than the one observed under ac voltage. However, under PWM like voltage since it is necessary to filter the switching components, the lower frequency components below the cut-off frequency of the filters used cannot be measured.
The magnitude of the ESD components at atmospheric pressure is lower than the ones measured for a pressure of 700 mbar. Same results were observed under ac voltage.
The magnitude of the high frequency components decreases with the pressure. Such behavior may be detrimental for the accuracy of the PDIV measurements. For a pressure of 100 mbar, the magnitude of the components of the PD spectrum is very small. The components, above 300 MHz present a very small magnitude despite some rays are present up to 400MHz. Beyond 430 MHz a zoom shows that the spectrum disappears completely (Fig. 5). Rays around 2 GHz correspond to the white noise of acquisitions.
Fig. 5. Zoom of PD spectrum under PWM like voltage at 100 mbar
V. CONCLUSION
Under ac voltage, a decrease of the pressure modifies the frequency spectrum of the discharge, leading to a rebalance toward the lowest frequency components. Same study was undertaken for PWM like voltage.
The need of high frequency filtering under such condition highlights the question of the error made on the PDIV at low pressure.
The frequency range of the discharge spectrum is higher (100MHz - 400MHz) under PWM like voltage than under ac power (10MHz - 100MHz). The effect of the pressure appears to be the same whatever the voltage waveform.
When decreasing the pressure, the amplitudes of the low frequencies components of the spectrum are increased. On the other hand, the high frequencies ones decreased. This is a major drawback for partial discharge detection since the PD spectrum is covered by the one induced by switchings. Therefore, a particular attention must be paid for the detection of discharges at low pressure. The bandwidth of the sensors and of the filters must be optimized to be adapted whatever the pressure and voltage conditions are.
REFERENCES
[1] P. Wang, A. Cavallini, and G. C. Montanari, “The influence of square voltage rise time on partial discharge spectra,” in 2012 Annual Report
Conference on Electrical Insulation and Dielectric Phenomena (CEIDP),
2012, pp. 129–132.
[2] D. G. Kasten, X. Liu, S. A. Sebo, D. F. Grosjean, and D. L. Schweickart, “Partial discharge measurements in air and argon at low pressures with and without a dielectric barrier,” IEEE Trans. Dielectr. Electr. Insul., vol. 12, no. 2, pp. 362–373, Apr. 2005.
[3] D. F. Grosjean, D. L. Schweickart, D. G. Kasten, S. A. Sebo, and X. Liu, “Development of procedures for partial discharge measurements at low pressures in air, argon and helium,” IEEE Trans. Dielectr. Electr. Insul., vol. 15, no. 6, pp. 1535–1543, Dec. 2008.
[4] T. Billard, T. Lebey, and F. Fresnet, “Partial discharge in electric motor fed by a PWM inverter: off-line and on-line detection,” IEEE Trans.
Dielectr. Electr. Insul., vol. 21, no. 3, pp. 1235–1242, Jun. 2014.