Coupling High Throughput Micro
fluidics and Small-Angle X‑ray
Scattering to Study Protein Crystallization from Solution
Nhat Pham,
†Dimitri Radajewski,
†Adam Round,
§,∥Martha Brennich,
⊥Petra Pernot,
⊥Béatrice Biscans,
†Françoise Bonneté,
‡and Sébastien Teychené*
,††Laboratoire de Génie Chimique, Université de Toulouse, CNRS, INPT, UPS, 4 allée Emile Monso, 31432 Toulouse, France ‡Institut des Biomolécules Max-Mousseron, UMR 5247, Université d’Avignon, 301 rue Baruch de Spinoza, 84000 Avignon, France §European Molecular Biology Laboratory, 71 avenue des Martyrs, 38042 Grenoble, France
∥Unit for Virus Host-Cell Interactions, Université Grenoble Alpes-EMBL-CNRS, 71 avenue des Martyrs, 38042 Grenoble, France ⊥European Synchrotron Radiation Facility, 71 avenue des Martyrs, 38000 Grenoble, France
S
mall-angle X-ray scattering (SAXS) has been proven to be a powerful technique to investigate the structure of soft matter and biological macromolecules at the nanometer-scale.1,2 It has demonstrated its potential for diverse applications, from nucleation studies (i.e., glycine crystals3 or colloidal silica4) to the determination of proteins molecular weight,6 or to study protein interactions in solution prior to crystallization,5 protein structure,7 or even conformational changes.8 SAXS measurements have also been used to determine the second virial coefficient, A2 a thermodynamic parameter characterizing protein interaction which has beenproved to be a powerful tool to predict crystallization conditions and therefore protein solubility.
However, the required volume for each measurement, together with the large number of experiments necessary to obtain reliable statistical information at each studied condition, makes this technique less convenient when working with high value compounds. To partially solve this issue, few studies are reported in literature proposing the coupling of single-phase
DOI:10.1021/acs.analchem.6b03492 ABSTRACT: In thiswork, we proposethe combinationof small-angleX-rayscattering(SAXS) andhighthroughput,droplet basedmicrofluidicsas a powerfultoolto investigatemacromolecularinteractions,directlyrelated to proteinsolubility.Forthis purpose,a robustandlowcostmicrofluidicplatformwasfabricatedfor achievingthe mixingof proteins,crystallizationreagents, and buffer in nanoliter volumes andthe subsequentgeneration of nanodroplets by means of a twophase flow.The protein samples are compartmentalized inside droplets, each one acting as an isolated microreactor. Hence their physicochemical conditions(concentration,pH,etc.)can be finelytunedwithoutcross-contamination,allowingthe screeningof a hugenumberof saturationconditions witha smallamountof biologicalmaterial. Thedropletflow is synchronized withsynchrotronradiation SAXSmeasurementsto probeproteininteractionswhileminimizingradiationdamage.To thisend,the experimentalsetupwas testedwithrasburicase(knownto be verysensitiveto denaturation),provingthe structuralstabilityof the proteinin the droplets andthe absenceof radiationdamage.Subsequentlyweakinteractionvariationsas a functionof proteinsaturationwasstudiedfor the
modelproteinlysozime.Thesecondvirialcoefficients(A2)weredeterminedfromthe X-raystructurefactorsextrapolatedto the
origin.A2 obtainedvalueswerefoundto be in goodagreementwithdatapreviouslyreportedin literaturebut usingonlya few milligrams of protein. The experimental results presented here highlight the interest and convenience of using this methodologyas a promisingandpotentialcandidatefor studyingproteininteractionsfor the constructionof phase diagrams.
continuous flow microfluidics and SAXS in order to screen phase behaviors,9 to study self-assembly of surfactants10 or biological macromolecules,11 or also to investigate nucleation and growth of gold nanoparticles.12 However, this approach presents a major drawback: a continuous flow can be unfavorable when fluids modify their characteristics after being mixed, as components are able to diffuse in the channels and, in the case of crystallization studies, a nucleating phase can inhibit the precipitation and growth of other different phases. In this sense, the use of droplet-based microfluidics seems more convenient. A dispersed phase can be created by mixing several miscible compounds and subsequently periodically separated by a continuous phase, generating monodisperse droplets, which are suspended in an external carrier phase thus behaving as isolated microreactors, as the immiscibility of the two phases prevents diffusion from one droplet to another. With this technique hundreds/thousands of independent experiments can be generated with ease in a short period of time and using a very low quantity of reagents. Droplet microfluidics has already been extensively used for studying nucleation and crystal growth of proteins,13−15 membrane proteins,16 nucleation of inorganic salts,17,18or drug molecules.19So far, the promising combination of continuous flow droplet-based microfluidics and SAXS has been sparsely reported for very few and different approaches in the literature dealing with gold nanoparticles20 and liquid crystals.21
In this paper, we demonstrate the convenience of combining high throughput droplet-based microfluidics and SAXS for the study of protein crystallization process, from undersaturation to supersaturation and phase transition, focusing on the study of weak interactions in solution.
A low cost microfluidic platform is fabricated to generate monodisperse aqueous droplets containing proteins, buffer, and crystallization agent dispersed in an external oil phase containing a nonionic surfactant to stabilize the interface of the droplets without interacting with the molecules in solution. Generated droplets are carried through the X-ray beam to record SAXS data for hundreds of experiments using just a few mg of protein and automatically screen a huge amount of crystallization conditions. From the nanometer-scale informa-tion on the structure and the shape of proteins in soluinforma-tion the second virial coefficients, A2, have been obtained for different saturation conditions. These A2values, relevant parameters for the prediction of protein solubility, were found to be in agreement with previous values reported in the literature, therefore validating the methodology here proposed.
■
MATERIALS AND METHODSMicrofluidic Setup. Microfluidic Chip Fabrication. Micro-fluidic droplet generation platforms, with rectangular channels with a cross section of 200 × 200 μm2, were fabricated using standard soft lithography and cast molding techniques. An inexpensive multilevel negative tone photoresist dry film (WBR2000 series, DuPont, France) was laminated on a glass substrate (Thermo Scientific Menzel-Glaser, Germany) follow-ing the procedure described in Figure S1 and Table S1 of the Supporting Information. The desired microfluidic configuration was patterned by UV exposure (UV-KUB2, Kloe, France) through a low cost emulsion mask, and structures were subsequently developed using sodium carbonate (Na2CO3) 1% and rinsed by an aqueous solution of magnesium sulfate (MgSO4) 0.5%. In addition, the dry film structures were silanized to gain hydrophobic surface properties before a
PDMS replica was obtained from the dryfilm structures to be used as a master mold. Subsequently UV-curable adhesive NOA 81 (Norland Products Inc., USA) was used to fabricate microfluidic platforms by cast molding using the PDMS master mold as described elsewhere.22This material was selected for its low cost, chemical resistance, adjustable wetting properties23 and high pressure resistance.24Fabrication details are given in theSupporting Information.
Chemical Surface Modification. Microfluidic channels were hydrophobized by means of a silanization to ensure a stable and reproducible droplet generation. The silanization process was performed using 1H,1H,2H,2H-perfluorodecyltrichlosilane (FDTS, Sigma-Aldrich) in a glovebox (Erlab, U.S.A.) initially filled with nitrogen. The NOA 81 microfluidic channels were first carefully cleaned with ethanol and 2,2,4-trimethylpentane at aflow rate of 200 μL/h for 30 min. The channels were then filled with a mixture of 1.5% v/v FDTS and 2,2,4-trimethylpentane. After 15 min of incubation, excess of FDTS was removed by flushing the channel with isooctane and isopropanol, respectively, 20 min each. The device was dried overnight at a temperature of 65°C.
Connection to the SAXS Sample Holder, Device Oper-ation. Links between the microfluidic chip and the SAXS sample holder were made by connecting fused silica capillaries (ID 280μm, OD 360 μm, Postnova analytics) directly to the exit of the microfluidic platform to the quartz capillary (OD 300 μm, wall thickness 10 μm) of the sample holder. The connection was ensured by a zero dead volume connector from IDEX (P-720). The quartz capillary was hermetically sealed into the sample holder in order to keep vacuum around it for obtaining high-quality SAXS data. With this setup, SAXS experiments were performed at a residual pressure of ∼10−2 mbar.
Reagent flow rates pumped into the microfluidic platform were controlled by high precision syringe pumps (neMESYS Cetoni, Germany), coupled to 1 mL syringes (Hamilton, U.S.A.).
Proteins Preparation. Two different proteins were used in this study, rasburicase (Sanofi) and lysozyme (purchased from Sigma-Aldrich, dialyzed lyophilized 629710)). In the case of lysozyme, all experiments were conducted in sodium acetate buffer (50 mM sodium acetate, pH 4.4) prepared with distilled water from a Milli-Q water purification system (Millipore, Billerica, MO). Prior use, the lysozyme solutions were prepared according to Parmar,25 in order to remove any unwanted aggregates present in most of the commercially available lysozyme. Details on the preparation procedure are given in the Supporting Information.
In the case of rasburicase, all the experiments were performed using 50 mM Tris buffer at pH 8.
Lysozyme and rasburicase were dissolved into the corre-sponding buffer to the required concentration after filtering through a 0.22-μm sterile filter (Millipore). The proteins concentrations were determined by absorbance measurements using the extinction coefficient of 2.64 mL mg−1cm−1at 280 nm for lysozyme and of 2.2 (±0.1) ml mg−1 cm−1 for rasburicase.
Small Angle X-ray Scattering Experiments. Synchro-tron SAXS measurements were performed on the beamline BM29 at the European Synchrotron Radiation Facility (ESRF) in Grenoble, France.26 The two-dimensional SAXS patterns were recorded with a 1 M Pilatus detector. The experimental X-ray wavelength and the sample-to-detector distance were
0.0991 nm and 2.87 m, respectively, covering a range of 0.03− 4.5 nm−1for the scattering vector q = 4π sin θ/λ. The beam cross-section at sample plane defined by slits was 90 μm (vertically)× 165 μm (horizontally). The sample holder can be translated with respect to the X-ray beam by a few millimeters with a precision of ten microns.
Using our microfluidic platform, water-in-oil droplets of protein, buffer and crystallization agent were formed and carried by an immiscible fluorous oil (Krytox GPL100, DuPont) containingfluorinated surfactant in order to stabilize the droplets interface. The selection of this continuous phase was made considering a good resistance to X-ray radiation damage, an optimal viscosity and immiscibility with the aqueous phase.
Preliminary experiments were performed with different oils and oil purities. Several silicone (Rhodorsil 47) andfluorous oils (perfluorodecalin (sigma Aldrich), FC 70 (3M), FC 40 (3M), and Krytox GPL 100 (Dupont)) have been tested, and it has been found that only Krytox GPL 100 can handle highly powerful X-ray radiation generated from a synchrotron source without any significant radiation damages.
Two different fluorosurfactants were used: 1H,1H,2H,2H-perfluorooctanol (PFO − C8H5F13O) (Sigma) and a triblock copolymer (PFPE−PEG-PFPE) synthesized as described elsewhere19 or purchased from Ranbiotechnology (U.S.A.). Both surfactants were dissolved at a concentration of 2% w/w in the continuous phase to make stable droplets. Microfluidic design, microfluidic platform, and connection to the BM29 sample holder are depicted inFigure 1.
In order to gather high quality data (by acquiring only the SAXS data inside the droplets) and to reduce radiation damage of the oil and the protein, the X-ray beam, the CCD detector, and the droplets were synchronized. The synchronization is based on real time image processing (developed in OpenCV and Matlab). Briefly, the template matching algorithm detects the front of the droplet flowing in the capillary and sends a TTL signal to the beamline shutter and the Pilatus camera to trigger the acquisition. Depending on the size and the speed of the droplets, this results in the acquisition of one to three SAXS signals per droplet. In addition, this approach allows us to avoid shooting droplet interfaces which produces a huge SAXS signal at very low angles and can cause miss interpretations of the data.
■
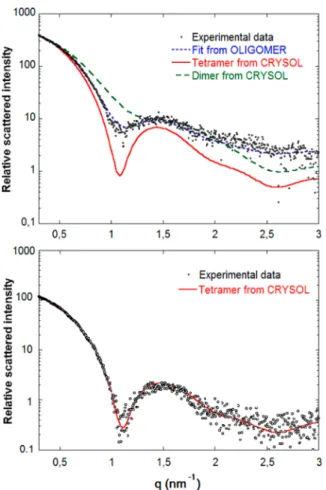
RESULTS AND DISCUSSIONValidation of the Experimental Setup: Protein Form Factor. Prior to any SAXS experiment, it was necessary tofind a suitable surfactanct allowing a compromise concerning the stable operation of the microfluidic platform and ensuring that proteins in solution are not interacting with the interface between oil and water. To this end, an active and native tetrameric form of rasburicase was used to optimize the setup, due to its high sensitivity to denaturation/dissociation. Initially, droplets containing 20 mg/mL of rasburicase in Tris buffer at pH = 8.0 were generated using 2 wt % perfluoorooctanol (PFO) as surfactant in Krytox GPL100 oil. In order to show to what extent the selection of an appropriate surfactant is important, the corresponding SAXS curves of rasburicase describing the scattered intensity as a function of the scattering vector are presented inFigure 2. The black dots correspond to the SAXS experimental results whereas the green and red curves are the simulated scattered intensities obtained from atomic coordinates using CRYSOL20software for the tetramer
and the dimer of rasburicase (obtained from the Protein Data Bank structurefile 1r51) respectively. The blue curve calculated from the experimental data using OLIGOMER27 software represents the bestfit of experimental result and indicates that the protein solution in the droplet is a mixture of 58% tetramer and 42% dimer.
Under these experimental conditions (oil and surfactant), rasburicase in solution behaves as a mixture of the native tetrameric form and the incompletely dissociated dimeric form. This suggests that the surfactant at the interface, in particular the surfactant polar heads in the aqueous droplet may interact with tetramers of rasburicase, dissociating tetramers into dimers.
To avoid any denaturation of proteins at the interface, a biocompatible triblock copolymer PFPE−PEG-PFPE surfactant described elsewhere27was used at an optimized concentration of 2 wt % in Krytox GPL100. From the work of Holtze et al.,27 this surfactant is known to act as a protectant of protein adsorption at the oil−water interface. The results of SAXS experiments on rasburicase droplets equivalent to the previous experiments are presented inFigure 2. It is worth noting that, using this surfactant, the curve for the native rasburicase tetramer obtained by CRYSOL software perfectlyfits the SAXS experimental data and is in good agreement with the published data of raburicase form factor28proving that the protein is not denaturated/dissociated. This result shows that the
combina-Figure 1.Design of microfluidic chip configuration (top). Picture of a microfluidic chip mounted on a microscope (middle). Connection between microfluidic chip and sample holder (bottom).
tion of PFPE−PEG-PFPE surfactant and Krytox GPL100 avoids denaturation of proteins and the protein has the same structure in droplets as in classical capillaries. Similar results have been obtained for less sensitive proteins like lysozyme, bovine serum albumin, and glucose isomerase. This combina-tion would therefore allow the study of macromolecular interactions in solution (structure factor) and form factor of proteins in droplets having equivalent experimental conditions to those SAXS experiments in microvolumes.29
Study of Weak Interactions for Crystallization Conditions. Once the experimental setup was validated, the variation of weak interactions between proteins in solution was studied using lysozyme as a model protein. The experiment was carried out using lysozyme at a stock concentration of 130 mg/ mL in sodium acetate buffer at pH 4.4. NaCl was used as the crystallizing agent as previously described,5 at a stock concentration of 2 M, and the continuous phase was formulated according to the previous validation experiment thus ensuring no interaction between protein and droplet interfaces.Figure 3 shows a picture of the microfluidic platform in operation. The continuous phase (oil) is injected in the left channel, salt in the top left channel, buffer in the top middle channel, and protein in the top right channel, respectively.
An important advantage of this microfluidic setup is that crystallization agent concentrations can be screened just by simply altering the flow rates of the incoming solutions. The
different experimental conditions applied are presented in Table S2 of theSupporting Information. The SAXS curves of lysozyme at different NaCl concentrations are presented in Figure 4.
The scattered intensity of a solution of macromolecules under weak interactions can be written as
= = ×
I c q( , ) IFF(c 0, )q S c q( , ) (1)
where IFFis the form factor, which represents the ideality of the solution and it depends only on the macromolecule itself (shape, size, ...), S represents the structure factor of the macromolecule solution and depends on weak interactions between macromolecules in solution (hard sphere/electrostatic interactions, van der Waals attraction, ...). These interactions are characterized by a second virial coefficient A2, which corresponds to variations of S(c,q = 0) as a function of macromolecule concentration:31,32 = = + S c q MA c ( , 0) 1 1 2 2 (2)
where M is the molecular weight of the macromolecules and c is their concentration. S(c,q = 0) < 1 value (A2 > 0) describes macromolecules under repulsive interactions. Respectively, if S(c,q = 0) > 1 (A2< 0), it describes macromolecular attractive interactions.
For a given SAXS curve with fixed protein and salt concentration, the forward intensity at zero angle I(c,q = 0) and the form factor IFF(c = 0,q = 0) fromeq 1can be calculated. I(c,q = 0) is obtained by means of a Guinier plot, ln I(c,q) = f(q2), when the scattering vector tends to zero. The Guinier approximation is = = ⎛− ⎝ ⎜ ⎞ ⎠ ⎟ I c q( , ) I c q( , 0)exp q R 3 2 G2 (3)
RGbeing the radius of gyration, this approximation is only valid at low scattering angles so that qRG< 1. By plotting ln I = f(q2) in the Guinier range, the forward intensity I(c,q = 0) can be estimated when the scattering vector tends to zero. As an example, a Guinier plot for lysozyme at 52 mg/mL concentration and 300 mM NaCl is shown in Figure 5. Analogously, the form factor can be obtained by plotting the forward intensity at zero angle, I(c,q = 0), as a function of the protein concentration and extrapolating to zero at each salt concentration (Figure 5). Thus, the structure factor at zero-q can be calculated fromeq 1:
= = = = = S c q I c q I c q ( , 0) ( , 0) ( 0, 0) FF (4)
Figure 2.SAXS curves of rasburicase with PFO surfactant (top) SAXS curve of rasburicase with PFPE−PEG-PFPE surfactant (bottom). Blacks dots are experimental data, green and red curves are scattering curves from atomic coordinates for tetramers (1r51) and dimers, respectively, and the blue curve is the bestfit for a mixture of dimers and tetramers.
Figure 3. Screen snapshot of droplet generation recorded during crystallization experiments for interaction screening. Left channel contains the oil with surfactant, top left channel the salt, top middle channel the buffer, and top right channel the protein.
A2 can therefore be obtained from the experimental SAXS data for the different salt and protein concentrations. The obtained A2 values are summarized in Figure 6. It can be noticed that, without salt, the protein is in a repulsive state due to strong electrostatic repulsion caused by the positive net charge of lysozyme at pH 4.4. When a small quantity of salt is added into droplets, the charges of lysozyme are partially screened and the repulsion due to electrostatic forces is reduced, leading to a decrease of the second virial coefficient. When there is enough salt to screen all the charges of lysozyme, there is no more repulsion between proteins, the interactions become attractive. This can be observed at salt concentrations above 180 mM where A2 becomes negative, pointing out an inflection point on macromolecular behavior that would lead to macromolecule aggregation and eventually to crystallization. These observations are in good agreement with previous
findings obtained in microbatch volumes30
therefore validating the microfluidic approach, by which good quality data has been obtained using a very small amount of proteins. In total only 12 mg of lysozyme has been used in this study. It is worth noting that all the results were obtained in two different synchrotron runs with different microfluidic chips and different stock solutions. All the obtained results were in good agreement with each other, proving the repeatability and the robustness of the approach.
Figure 4. SAXS curves of lysozyme with increasing NaCl concentration from 0 to 400 mM. Lysozyme concentrations, top: 21.7 mg/mL; middle: 52 mg/mL; and bottom: 86.7 mg/mL.
Figure 5. Guinier plot for lysozyme 52 mg/mL and salt 300 mM (top). Scattered intensity at zero angle as a function of lysozyme concentration at different salt concentrations (bottom).
Figure 6.Variations of the second virial coefficient for lysozyme as a function of salt concentration.
■
CONCLUSIONSThe combination of SAXS and high throughput, droplet based microfluidics is here proposed as a powerful tool to investigate macromolecular interactions, directly related to protein solubility. The microfluidic droplet flow was synchronized with synchrotron radiation SAXS measurements to probe protein interactions while minimizing radiation damage. To this end, the experimental setup was tested and optimized with rasburicase (known to be very sensitive to denaturation), proving the structural stability of the protein in the droplets and the absence of radiation damage, underlining the fact that the protein in droplets has the same behavior as in a standard solution. Subsequently weak interaction variations as a function of protein saturation were studied for the model protein lysozime. The second virial coefficients (A2) were determined from the X-ray structure factors extrapolated to the origin. The results show that without salt, the lysozyme solution is in the repulsive regime, and it changes to attractive regime when the salt concentration increases. By adding more salt, charges of lysozyme could be screened and the interaction between proteins becomes attractive. A2 obtained values were found to be in good agreement with data previously reported in the literature but using only a few milligrams of protein.
This versatile microfluidic tool could be applied to numerous systems in a standardized way. Using droplet microfluidics coupled with SAXS, structural studies of macromolecules in solution can be accomplished with significantly reduced time and sample quantity.
■
ASSOCIATED CONTENT*
S Supporting InformationThe Supporting Information is available free of charge on the ACS Publications website at DOI: 10.1021/acs.anal-chem.6b03492.
Procedure of fabrication of microfluidics chip (Figure S1, Table S1). Purification protocol of protein solutions (Figure S2: DLS comparison of commercial and purified lysozyme solutions. Figure S3: Process of purification and concentration of lysozyme). Operating conditions for interactions study (Table S2). (PDF)
■
AUTHOR INFORMATION Corresponding Author *E-mail:[email protected]. ORCID Sébastien Teychené: 0000-0002-4840-1829 NotesThe authors declare no competingfinancial interest.
■
ACKNOWLEDGMENTSThis work was supported by an ANR funding, CNOC project, ref ANR-13-JS09-0006 and an instrumental support from MI-CNRS“Instrumentation aux limites”. We thank ESRF for the provision of beamtime and technological developments to support these experiments.
■
REFERENCES(1) Glatter, O.; Kratky, O. Small Angle X-ray Scattering; Academic Press: London, 1982.
(2) Feigin, L. A.; Svergun, D. I. Structure Analysis by Small-Angle X-Ray and Neutron Scattering; Plenum Press: New York, 1987.
(3) Chattopadhyay, S.; Erdemir, D.; Evans, J. M. B.; Ilavsky, J.; Amenitsch, H.; Segre, C. U.; Myerson, A. S. Cryst. Growth Des. 2005, 5 (2), 523−527.
(4) Pontoni, D.; Narayanan, T.; Rennie, A. R. Prog. Colloid Polym. Sci. 2004, 123, 227−230.
(5) Ducruix, A.; Guilloteau, J. P.; Riès-Kautt, M.; Tardieu, A. J. Cryst. Growth 1996, 168, 28−39.
(6) Fischer, H.; Oliveira Neto, M.; Napolitano, H. B.; Polikarpov, I.; Craievich, A. F. J. Appl. Crystallogr. 2010, 43, 101−109.
(7) Mertens, H. D.; Svergun, D. I. J. Struct. Biol. 2010, 172, 128−141. (8) Durchschlag, H.; Zipper, P.; Wilfing, R.; Purr, G. J. Appl. Crystallogr. 1991, 24, 822−831.
(9) Khvostichenko, D. S.; Kondrashkina, E.; Perry, S. L.; Pawate, A. S.; Brister, K.; Kenis, P. J. A. Analyst 2013, 138, 5384−5395.
(10) Martin, H. P.; Brooks, N. J.; Seddon, J. M.; Terrill, N. J.; Luckham, P. F.; Kowalski, A. J.; Cabral, J. T. J. Phys.: Conf. Ser. 2010, 247, 012050.
(11) Brennich, M. E.; Nolting, J. F.; Dammann, C.; Nöding, B.; Bauch, S.; Herrmann, H.; Pfohl, T.; Köster, S. Lab Chip 2011, 11 (4), 708−716.
(12) Polte, J.; Erler, R.; Thünemann, A. F.; Sokolov, S.; Ahner, T. T.; Rademann, K.; Emmerling, F.; Kraehnert, R. ACS Nano 2010, 4 (2), 1076−1082.
(13) Zheng, B.; Roach, L. S.; Ismagilov, R. F. J. Am. Chem. Soc. 2003, 125 (37), 11170−11171.
(14) Li, L.; Ismagilov, R. F. Annu. Rev. Biophys. 2010, 39, 139−158. (15) Selimović, C.; Jia, Y.; Fraden, S. Cryst. Growth Des. 2009, 9 (4), 1806−1810.
(16) Li, D. L.; Mustafi, D.; Fu, Q.; Tereshko, V.; Chen, D. L.; Tice, J. D.; Ismagilov, R. F. Proc. Natl. Acad. Sci. U. S. A. 2006, 103 (51), 19243−19248.
(17) Laval, P.; Crombez, A.; Salmon, J. B. Langmuir 2009, 25 (3), 1836−1841.
(18) Vitry, Y.; Teychené, S.; Charton, S.; Lamadie, F.; Biscans, B. Chem. Eng. Sci. 2015, 133, 54−61.
(19) Teychené, S.; Biscans, B. Chem. Eng. Sci. 2012, 77, 242−248. (20) Stehle, R.; Goerigk, G.; Wallacher, D.; Ballauff, M.; Seiffert, S. Lab Chip 2013, 13, 1529−1537.
(21) Otten, A.; Köster, S.; Struth, B.; Snigirev, A.; Pfohl, T. J. Synchrotron Radiat. 2005, 12 (6), 745−750.
(22) Wägli, Ph.; Homsy, A.; de Rooij, N. F. Sens. Actuators, B 2011, 156 (2), 994−1001.
(23) Sollier, E.; Murray, C.; Maoddi, P.; Di Carlo, D. Lab Chip 2011, 11 (22), 3752−3765.
(24) Bartolo, D.; Degré, G.; Nghe, P.; Studer, V. Lab Chip 2008, 8 (2), 274−279.
(25) Parmar, A. S.; Gottschall, P. E.; Muschol, M. Biophys. Chem. 2007, 129, 224−234.
(26) Pernot, P.; Round, A.; Barrett, R.; De Maria Antolinos, A.; Gobbo, A.; Gordon, E.; Huet, J.; Kieffer, J.; Lentini, M.; Mattenet, M.; Morawe, C.; Mueller-Dieckmann, C.; Ohlsson, S.; Schmid, W.; Surr, J.; Theveneau, P.; Zerrad, L.; McSweeney, S. J. Synchrotron Radiat. 2013, 20, 660−664.
(27) Holtze, C.; Rowat, A. C.; Agresti, J. J.; Hutchison, J. B.; Angile, F. E.; Schmitz, C. H. J.; Koster, S.; Duan, H.; Humphry, K. J.; Scanga, R. A.; Johnson, J. S.; Pisignano, D.; Weitz, D. A. Lab Chip 2008, 8, 1632−1639.
(28) Svergun, D. I.; Barberato, C.; Koch, M. H. J. J. Appl. Crystallogr. 1995, 28, 768−773.
(29) Konarev, P. V.; Volkov, V. V.; Sokolova, A. V.; Koch, M. H. J.; Svergun, D. I. J. Appl. Crystallogr. 2003, 36, 1277−1282.
(30) Bonneté, F.; Finet, S.; Tardieu, A. J. Cryst. Growth 1999, 196, 403−414.
(31) Vivarés, D.; Bonneté, F. Acta Crystallogr., Sect. D: Biol. Crystallogr. 2002, 58, 472−479.
(32) Bonneté, F.; Ferté, N.; Astier, J. P.; Veesler, S. J. Phys. IV 2004, 118, 3−13.