Contents lists available atScienceDirect
Journal of Hydrology: Regional Studies
journal homepage:www.elsevier.com/locate/ejrhAssessing the potential impacts of dam operation on daily
flow at
ungauged river reaches
A. Mailhot
a,⁎, G. Talbot
a, S. Ricard
b, R. Turcotte
b, K. Guinard
baINRS-Eau, Terre et Environnement, 490 de la Couronne, Québec, G1K 9A9, Canada
bMinistère du Développement durable, de l'Environnement et de la Lutte contre les changements climatiques, Direction de l’expertise hydrique, 675,
boulevard René-Lévesque Est, Aile L.-A. Taschereau, 4e étage, Québec, G1R 5V7, Canada
A R T I C L E I N F O Keywords:
Dam operation Dailyflow distribution Unimodality
Degree of regulation index Southern Quebec
A B S T R A C T
Study Region: The study region is the Southern Quebec river network. Dataset on dams as well as dailyflow recorded at stations were used.
Study Focus: Dam construction and operation can have significant impacts on hydrological re-gimes. If dam construction induces some basic alterations to basin hydrology, dam operation can introduce dynamic alterations in streamflow. Assessing the impacts of dam operation can be crucial for many applications where recordedflow series are used as a proxy for flow at nearby ungauged basins in regionalflood frequency analysis or for hydrological modelling. The potential influence of dam operation on recorded flows was assessed through statistical testing that ver-ified the unimodality of the daily flow distribution. The Degree of Regulation (DOR) index was then used to relate the potential influences of dam operation to basic physiographic and dam characteristics.
New Hydrological Insights for the Region: Application of a unimodality test to dailyflow series recorded at stations located in the study region confirms that dam operation can result in non-unimodal dailyflow distribution. Estimation of DOR values for all reaches of the study region shows that regulated river reaches could be potentially influenced by dam operation when DOR > 8. Of the 29% regulated river reaches (i.e. with one or more upstream dams), ap-proximately 30% could be potentially influenced (DOR > 8) by dam operation.
1. Introduction
The construction of dams have altered the naturalflow regimes of many watersheds across the world (Graf, 1999;Nilsson et al., 2005;Grill et al., 2015) and this will become even more important as dam construction is expected to continue increasing in the future (Zarfl et al., 2015). Dams have major impacts on hydrology as they can alter lowflow regime and reduce peak flows, change the interannualflow variability (FitzHugh and Vogel, 2011;Magilligan and Nislow, 2005), and alter geomorphology and aquatic ecosystems (for a description of these impacts seePoff and Hart, 2002;Poff and Schmidt, 2016).
In order to evaluate the impact of dam construction on hydrological regimes, many studies have compared hydrographic char-acteristics estimated from pre- and post-dam construction onflows at downstream gaging stations (e.g.Magilligan and Nislow, 2005; Graf, 2006;Poff et al., 2006;Gao et al., 2009). Hydrological indices, inspired from those initially proposed byRichter et al. (1996) andThe Nature Conservancy (2006), also called Indicators of Hydrologic Alteration (IHA), are often used to assess the hydrological changes resulting from dam construction. These studies showed that globally dams tend to decreaseflow peak frequency, magnitude
https://doi.org/10.1016/j.ejrh.2018.06.006
Received 4 October 2017; Received in revised form 28 May 2018; Accepted 22 June 2018
⁎Corresponding author.
Journal of Hydrology: Regional Studies 18 (2018) 156–167
2214-5818/ © 2018 The Authors. Published by Elsevier B.V. This is an open access article under the CC BY-NC-ND license (http://creativecommons.org/licenses/BY-NC-ND/4.0/).
and duration, while generally increasing the frequency, magnitude and duration of low flows (Magilligan and Nislow, 2005; Magilligan et al., 2003). Other impacts such as those related to downstream channel changes as a result of dams have also been analyzed (Schmidt and Wilcock, 2008).
Assessments of dam construction on streamflow by means of comparing pre- and post- dam hydrographic characteristics (e.g. annual peakflow or annual minimum flows) imply that some range of values are defined for natural flow regimes and that certain metrics are used to assess if post-dam values significantly differ from natural values (or pre-dam conditions). This type of comparison can be very challenging since many watershed characteristics (e.g. areas, altitudes, and latitudes) may influence hydrographic characteristics (e.g. lowflow values, annual peak flow;Carlisle et al., 2010) and therefore the influence of dam construction cannot be unambiguously assessed in certain cases.
Assessing the specific impacts of dam operation are necessary if recorded flow series are used as a proxy for flow at nearby ungauged basins in regionalflood frequency analysis or for hydrological modelling. In this sense, evaluating the specific impacts of dam operation can be important as non-operated dams can be assimilated to storage capacities. As pointed out byVillarini and Smith (2010),‘structural’ alterations to basin hydrology, such as those induced by dams, are the norm for flood records, and analyses of flow distributions should reflect such anthropogenic changes. Dam operation however, can induced dynamic alterations to streamflow that may overlap with the more basic changes introduced by dam construction. Comparing pre- and post-dam constructionflows does not allow for the separation of the impacts of dam construction from its operation.
Many studies have analyzed the influence of dam construction on flow regimes (e.g.Magilligan and Nislow, 2005;Assani et al., 2006;Lajoie et al., 2007;Gross and Moglen, 2007;Matteau et al., 2009;Peñas et al., 2016;Mei et al., 2017), but very few studies have looked at the specific impacts of dam operation on flows, i.e. how operations change flows in comparison to the situation where dams are not operated.White et al. (2005), using wavelet analysis, evaluated the impact of Glen Canyon dam (Colorado River) by comparing pre- and post-dam construction hourlyflows at a downstream station. They showed that clear operating cycles related to hydroelectricity production could be detected from hourlyflow series. Zimmerman et al. (2010) compared hourlyflow series downstream of dams (flood control, run-of-river hydropower, and peaking hydropower) operated by the US Army Corps of Engineers on the Connecticut River basin to assess the potential impacts of dam operations on sub-dailyflow regimes. These studies demon-strated that there was a distinctive signature for dam operation on sub-dailyflow. Other more recent studies have also addressed this issue of dam operation on streamflows (e.g.,Meile et al., 2011;Carolli et al., 2015;Chen et al., 2015;Bevelhimer et al., 2015). Collectively, these studies considered sub-dailyflow series and only hydroelectric dams. The question however, remains if dam operation, other than hydroelectric dams, can also have an impact on dailyflows and if other types of dams (e.g. flood control dams) may also have a‘detectable’ impact on daily flow or a more general feature of the daily hydrogram.
The detection of characteristic signatures of dam operation on daily streamflow is difficult for many reasons. Firstly, operation records or operation rules are unknown and, in many cases, operation status (i.e. is the dam operated or not?) is even unknown. Secondly, even when operation records are available, operations have an impact on the short termflow and it remains difficult to assess their overall impact on hydrographs. Furthermore, operation frequency can vary considerably from one dam to another depending on the specific use of the dam (e.g. hydroelectricity production, flood control), thus making it even more difficult to detect the possible impacts on downstreamflow. Incidentally, studies have reported the impacts of dam operation on sub-daily flow records arguing thatflow variability changes induced by dam operation mainly affects sub-daily flow and that a daily time scale is to coarse to characterize the possible influence of dam operations (White et al., 2005; Zimmerman et al., 2010). Additionally, it remains difficult to specifically assess the impacts of operations on downstream recorded flow, given that stations are located at varying distances from operated dams. Finally, upstream watersheds may include many dams being operated to varying degrees with varying operation schedules, therefore increasing the difficulty of identifying distinct signatures of dam operation on recorded flows.
The main goal of this study was to define an index that can be readily estimated at any ungauged river reach from the available watershed and dam characteristics, thus providing information about the potential impacts of dam operations on streamflow. This was achieved through three main sub-objectives. First, we investigated the impact of dam operation on recorded dailyflow. Herein, we propose a novel hydrological indicator of dam influence based on the unimodal or multi-modal character of the daily flow distribution. This indicator was validated through a comprehensive analysis of all streamflow records available for southern Quebec. Second, we propose an index based on readily available dam and hydrographic characteristics to assess the potential influence of dam operation on ungauged river reaches. Finally, we have applied the proposed index to a river network in southern Quebec and generated a map assessing the potential influence of dam operation on each reach.
The present study is organized as follows. Section2describes the dam and station datasets used in this study. Section3describes how the various dam configurations upstream of each station were structured in order to analyze the potential influence of dam operations on recordedflow. Section4describes the unimodality test and presents the results for the unregulated and regulated watersheds upstream of dailyflow gauging stations. Section5presents the index, based on readily available dam and watershed characteristics, used to assess the potential influence of dam operation at ungauged river reaches. Section 6 presents some results of the global application of this index to the hydrographic network of Southern Quebec. Finally, conclusions and perspectives for future work are presented in Section 7.
2. Datasets
2.1. Dam dataset
used for the present study. The dataset contains information on 6,529 dams located in the Province of Quebec (Canada). The majority of the dataset focuses on dams in the southern part of the province. Available data are: a) name and identifier; b) latitude and longitude; c) altitude; d) area of upstream watershed; e) maximum reservoir capacity; f) function (e.g., hydropower production, water supply,flood control); g) construction year; h) outlet structures; i) owner (provincial or federal government, hydropower companies, municipalities, private companies, private owners, associations, etc.; a detailed description of the dam register is provided inCEHQ, 2014). The dataset does not provide information regarding dam operation or operating status (operated or not operated). The only exceptions are the dams operated by the Ministère du Développement durable, de l'Environnement et de la Lutte contre les changements climatiques (MDDELCC) whose dates of operation and gate apertures are specified.
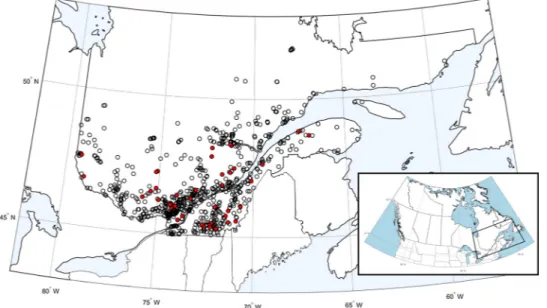
Only dams with upstream watersheds larger than 15 km2were considered in the present study reducing the number of dams to 1 889. Dams were further classified as ‘operable’ or ‘non operable’ based on outlet structures (e.g., sluice gate, spillway) leading to 857 ‘operable’ dams. The ‘operable’ subgroup therefore includes all dams that could be operated (even if their operating status is un-known) with an upstream watershed of 15 km2or more.Fig. 1presents a map with locations of these dams andFig. 2presents box plots of the reservoir capacities of these dams in relation to dam function. Note that dams may have more than one function. Thus, Fig. 1. Map presenting locations of dams considered in the present study (857‘operable’ dams with upstream watersheds larger than 15 km2). Dams operated by the MDDELCC are indicated with red dots.
Fig. 2. Box-plots of reservoir capacities according to dam function (numbers at right correspond to the number of dams within each group). Only ‘operable’ dams with upstream watersheds larger than 152km were considered (for a description of the various dam functions seeCEHQ, 2014).
Note that the functions of 5 operable dams with upstream watersheds larger than 15 km2remain unknown (not represented in the boxplots).
according to the dam register, for the selected dams, 761 (89%) dams were assigned a single function, 74 (9%) two functions, 10 (∼1%) three functions, and 7 (∼1%) four functions (note that the function is unknown for 5 operable dams with upstream wa-tersheds larger than 15 km2). Therefore, a given dam may appear up to four times inFig. 2. As presented inFig. 2, hydroelectric and
flood control dams have the largest storage capacities, while the largest number of dams are for recreation purposes (e.g., lake outlets). However, these dams have on average much smaller storage capacities. Hereafter, dams will refer to operable dams with upstream watersheds larger than 15 km2.
These dams are owned, and possibly operated, by different organizations and groups (provincial government, hydropower companies, municipalities, private companies, private owners, associations, etc.).
2.2. Recordedflows
A total of 443 hydrometric stations located in the Province of Québec (Canada) and operated by the MDDLECC were initially considered for the present study. Instantaneous dailyflows are archived at each station (the daily recording time may change from station to station, but is generally midnight; personal communication from William Larouche, Chef Division de l’hydrométrie, MDDELCC). Stations complying with the following selection criteria were targeted for further analysis: 1) stations must have a minimum of 5 valid years (a valid year is defined as a year with less than 10% missing daily values); 2) stations must not contain a sequence of more thanfive consecutive missing years; 3) stations must be localized south of 50 °N; 4) upstream watersheds must be larger than 100 km2; 5) upstream watersheds must be completely located in the Province of Québec (this last condition is necessary as the dam repertoire only includes Quebec’s dams). A total of 259 stations complied with these criteria.
A comprehensive analysis of available dailyflow records at the 259 stations was carried out to check for possible trends, break-points and abnormal values or sequences (e.g., series of zero values in watersheds where such a sequence is highly unlikely; stepwise series over certain periods of time that may indicate changes in resolution). Based on the comprehensive analysis, a further thirty-three (33) stations were discarded. Abnormal values were also discarded (e.g., values from early recording periods with much lower resolution than the values recorded for following periods) in many station records.Fig. 3presents the map of the 226 stations considered in the present study.
3. Methods
3.1. Station/dam configurations
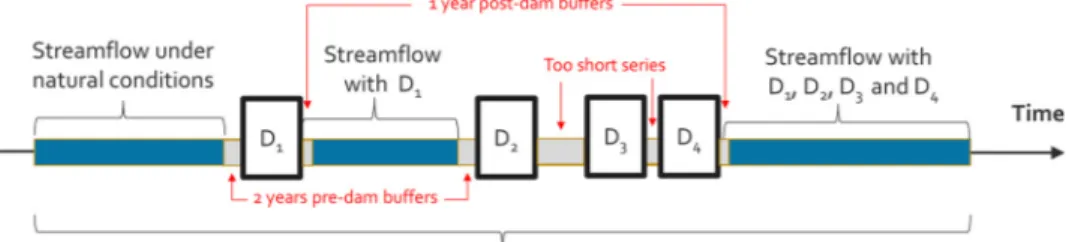
Recordedflows at stations were analyzed according to the dam configurations in the upstream watersheds which, in many cases, have changed over time with the construction of new dams (Fig. 4). In the following, recording periods at each station were par-titioned into sub-periods according to the construction year of the different dams. Only sub-periods with 5 valid years or more were further considered after discarding the 2-year period preceding the construction of the dam and the year following the construction of the dam. A hypothetical scenario is presented inFig. 4. InFig. 4, considering that all years are valid, three stations/periods were defined, a first period with no upstream dam, a second with one upstream dam, and a third with four upstream dams. Two periods (between the construction of dam D2and D3and dams D3and D4) were not considered given that these span less than 5 valid years.
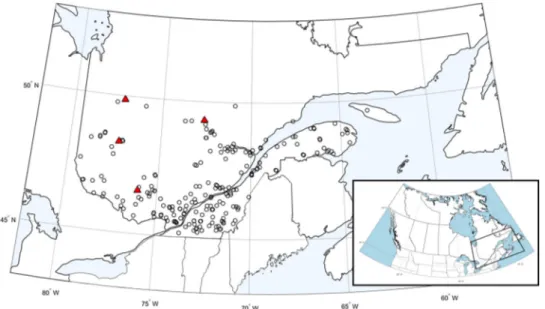
Fig. 3. Map presenting locations of the 226 stations considered in the present study. The four triangles correspond to unregulated stations with non-unimodal dailyflow distributions (see Section4for details).
These periods associated with specific stations and specific upstream dam configurations are, hereafter referred to as stations/ periods.
A total of 174 stations/periods were, therefore defined with 70 stations/periods (40%) having no dams in their upstream wa-tersheds.Fig. 5presents the histogram of the number of stations/periods with one or more dams in their upstream watersheds (104 station/period). As can be seen, 48 stations/periods (46%) have one dam in their upstream watersheds, while the remaining 56 have more than one dam upstream. Some stations/periods have a large number of dams in their upstream watersheds (up to 24 dams). To our knowledge, no dams have been removed and therefore the number of dams in the upstream watersheds has either increased or remained unchanged over time.Fig. 6presents the histogram of the number of available valid years of records for both stations/ periods with and without dams.
3.2. Detection of the influence of dam operation on daily flow distribution
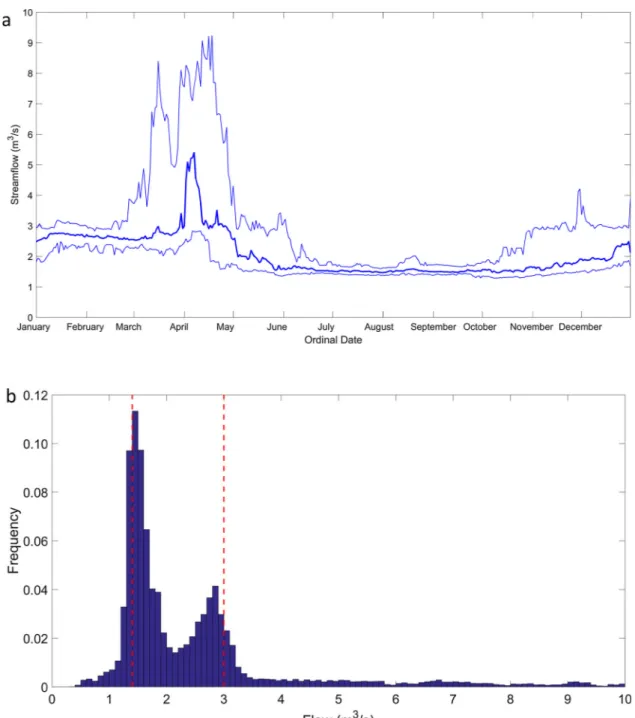
A metric based on the unimodality of the dailyflow distribution was analyzed to assess the potential impacts of dam operation on dailyflow. The application of such a metric was motivated by the existence of dam operating rules aimed at maintaining discharges within afixed range of flow during specific periods of the year. Such rules may result in ‘sustained’ flows over these periods and consequently, in more than one mode in the dailyflow distribution downstream of the dam. In comparison, natural flows or flows downstream of non-operated dams usually leads to a unimodal distribution.Fig. 7presents an example in which two modes can be clearly seen. These modes were associated with the two targetedflows by the dam operator, the first at ∼ 1.4 m3/s generally set during summer, and the second at∼3 m3/s set during autumn and winter (personal communication Julie Lafleur, MDDELCC). The
main advantage of this approach compared to the one based on hydrological indices, such as Indicators of Hydrology Alteration (IHA;Richter et al., 1996), is that the distribution unimodality can be simply and quickly assessed using a statistical test, while changes in indices can be cumbersome as one needs to compare values from operated and non-operated dams which may depend, for instance, on upstream watershed superficies (Mailhot et al., 2014). Furthermore non-unimodality can be directly linked to dam Fig. 4. Fictitious example of the evolution of dam configurations upstream of a given hydrometric station. The upper diagram illustrates the time evolution of the construction of the various dams (D1to D4correspond to the dams) and the corresponding division into stations/periods of theflow
series recorded at the station. The lower diagram presents the locations of these dams in the watershed.
Fig. 5. Histogram of the number of stations/periods with one or more dams in their upstream watersheds (104 station/periods).
operation while approaches based on IHA cannot disentangle the potential influences of dam operation from those due to dam construction.
Unimodality was assessed using the‘dip test’ (hereafter called unimodality test) developed byHartigan and Hartigan (1985). The non-unimodality distribution was tested at the 5% significance level and associated with the influence of dam operation on recorded flows.
Two special features of the dailyflow series were considered, since they led to spurious unimodality test results. The first feature was related to the coarseflow resolution or changes in recorded flow resolution over time. The second feature was related to the presence of constantflow values over many days, in some of the records. Coarse resolution or changing resolution led to stepwise discontinuities in the cumulative function distribution of dailyflow that were interpreted as a non-unimodal distribution by the unimodality test. In this circumstance, random values (uniformly distributed) were added to the recorded values to generate a continuous series.
The second feature relates to the presence in some of the records of constantflow values over many days for the period prior to 1966–1967. Flows were manually recorded by an observer prior to 1966–1967 and constant flow values are presumably related to the observer assiduity (personal communication from William Larouche, Chef Division de l’hydrométrie, MDDELCC). Therefore, we decided to discard recordedflows prior to 1966 from all stations/periods.
3.3. Assessing the potential influence of dam operation on flow at ungauged river reaches
The application of the unimodality test necessitates that recordedflows are available at the reaches where potential influences of dam operation are sought. An assessment of the potential impacts of dam operation on river reaches without gauging stations requires that an index be defined, linking the potential impacts of dam operation with dam location, characteristics, and the hydrographic characteristics of the considered river reach. Two main factors may determine the potential influence of dam operation on streamflow at a given reach: 1) the capacity of the dam reservoirs compared to the reachflow (a large capacity/flow ratio suggests that the dam may induce a large relative change inflow) and 2) the relative location of the dam and the river reach (the impact of dam operation is expected to decrease for reaches further downstream of a dam).
Previous studies have defined indices to characterize the potential influences, of dam construction or operation, on downstream flow. The Impounded Runoff Index (IRI;Singer, 2007) has been defined as the ratio of reservoir capacity to median annual flood runoff volume. A slightly different index, named Impounded Runoff (IR), defined as the ratio of reservoir capacity to annual runoff, has been proposed byBatalla et al. (2004). In order to take into consideration the possible influence of multiple upstream dams, Singer (2007)also used the total upstream reservoir capacity for stations under the influence of multiple dams.
More recently,Lehner et al. (2011), in order to evaluate the environmental impacts of dams on biodiversity, ecosystem func-tioning, andfluvial geomorphology, due to hydrological alterations, introduced the Degree of Regulation (DOR) metric (see also Grill et al., 2014). DOR is defined as the ratio of total storage capacity to total annual flow volume at the considered reach:
∑
= = DOR D s 100 j j i n ij 1 j (1) wheresijis the storage capacity of damiupstream of reachj,njis the number of dams upstream of reachj, and Djis the annualflow volume at reach j. Water volume within the river channel corresponds to the average discharge based on an approximation of channel width and depth (Grill et al., 2014). This metric is very similar to the IRI index and both are designed to quantify hydro-logical alterations induced by dams. A large DOR value corresponds to a configuration allowing a significant fraction of the annual discharge volume at a given reach to be stored and released at later time. DOR was therefore used in the present study as a proxy for how streamflow at a given reach may be altered by upstream dam operations (Grill et al., 2014). Since annual flow volumes were not available for all reaches, volumes were estimated using the linear regression between median annualflow volume and the upstream watershed area (not shown for conciseness). DOR values were therefore estimated and compared to the result of the unimodality test Fig. 6. Histogram of the number of years (excluding the buffer periods) with recorded flows for stations/periods with one or more dams (in blue) and without dams (in red) in their upstream watersheds.for the available stations/periods. It is expected that alteredflows due to dam operation, detected through non-unimodal flow distribution, is more likely to occur for reaches with high DOR values.
In order to assess the potential influences of dams operated by theMDDELCC, the relative DOR index was also defined. Relative DOR
corresponds to the fraction of the total reservoir capacity upstream from a given reach that is associated with MDDELCC-operated dams. A relative DOR value equal to zero therefore indicates that the stations/periods do not include aMDDELCCdam in its upstream
watershed while a value of one means that all upstream dams areMDDELCC-operated dams.
Fig. 7. (a) Mean annual hydrograph (demarcations on the X-axis correspond to thefirst day of each month; the thick line corresponds to the mean dailyflow and the two thin lines correspond to the first and third quartiles); (b) daily flow histogram (the two vertical red lines correspond to the twoflow values targeted according to operational rules) at the station located 0.4 km downstream of the Choinière dam.
4. Results
4.1. Application of the unimodality test to available stations/periods
Table 1summarizes the results of the unimodality test for all stations/periods. It wasfirst applied to the 70 unregulated stations/ periods (i.e. with no upstream dam). When applying the unimodality test to these 70 stations/periods, we obviously expected a unimodal dailyflow distribution given the absence of upstream dams. The results of this application indicate that all distributions were effectively unimodal except for four stations/periods. These four stations/periods are located downstream of unregulated watersheds over their entire recording periods: Mistassini (49.32 °N, -72.64 °E; 4,194 km2; 7-year record), Bell (48.32 °N, -77.30 °E;
1,902 km2; 7-year record), Waswanipi (4986 °N, -77,19 °E; 31,272 km2; 51-year record), and Désert (46.59 °N, -76.04 °E; 1,644 km2; 12-year record). The four non-unimodal stations are indicated by triangles inFig. 3. Thefirst three stations are located in the northern part of the study region (north of 48 °N) while the remaining station is located further south.
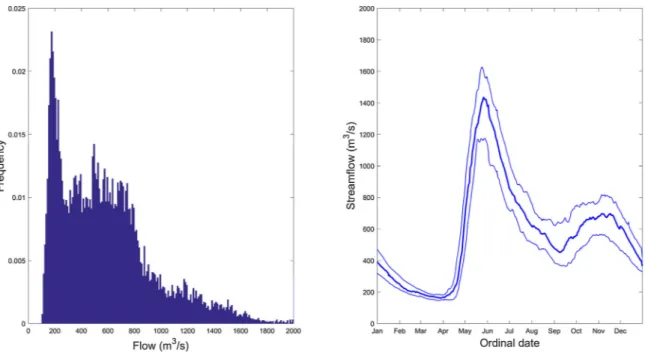
Fig. 8presents an example of dailyflow distribution and its corresponding mean annual hydrograph for the Waswanipi station (northernmost station with the longest record and the largest upstream watershed among the four unregulated stations/periods with non-unimodal dailyflow distribution). As can be seen inFig. 8, the annual hydrograph is characterized by a recession following the spring peak that extends to September and October after whichflows increase in November and finally decrease for another extended period during winter. The two modes of the distribution were therefore associated with a lowflow period from February to mid-April (first peak at 200 m3/sec), and the second mode (extended plateau in the distribution from 300 to 800 m3/sec) was associated with
the August to December period. This example is representative of the three northernmost stations, and also of some other watersheds located north of 50° latitude (not shown for conciseness). This demonstrates that seasonal hydrological regimes for some northern watersheds may lead to non-unimodal dailyflow distributions. The unimodality test should therefore be applied with caution when assessing the impacts of dam operation in northern watersheds.
The fourth case, Désert station, presents a different feature, which is characterized by very low flow and very low variability of dailyflow series from September to November over a 10-year period (not shown for conciseness). This explains the non-unimodality of the dailyflow distribution. No other reason (e.g., watershed characteristics or some problems with recording set-up) was found that could explain this result. This situation demonstrates that, in some very specific cases, non-unimodal daily flow distributions can Table 1
Summary of the unimodal test over all stations/periods. Modality of dailyflow
distribution
No dam in upstream watershed
One or more MDDELCC-operated dams in upstream watershed No MDDELCC-operated dam in upstream watershed TOTAL Unimodal 66 33 55 154 Non-unimodal 4 13 3 20 TOTAL 70 46 58 174
Fig. 8. (a) Distribution of dailyflow and (b) mean annual hydrograph (the thick line corresponds to the mean daily flow and the two thin lines correspond to thefirst and third quartiles) at station Waswanipi (demarcations on the X-axis correspond to the first day of each month).
be observed. Further research is needed to investigate this point.
The unimodality test was then applied to stations/periods with one or more dams in their upstream watersheds (Table 1). Of the 104 stations/periods belonging to this category, 88 (85%) were classified as unimodal. Of the 46 stations/periods with at least one dam operated by the MDDELCC-operated dam (regardless of their locations in the upstream watershed or their capacities), 13 (28%) were classified as influenced by upstream dam operation (since their daily flow distributions were non-unimodal), while for the 58 remaining stations/periods (with no upstream dams operated by the MDDELCC-operated dam), only 3 were classified as being influenced by dam operation (non-unimodal daily flow distribution).
4.2. Potential influence of dam operation on flow at ungauged river reaches
Fig. 9presents the relative DOR and DOR values for all stations/periods with upstream dams and the results of the unimodality test (5% significance level). This figure reveals some interesting features. The first is that the available stations/periods with upstream
MDDELCCdams have DOR values close or larger than 10−1. The second is that no station/period was classified as influenced
(non-unimodal dailyflow distribution according to the unimodality test) for DOR > 8 (i.e. reaches where the total upstream dam capacity represents 8% or more of the median annual volume transiting this reach). This result therefore supports the hypothesis that impacts of dam operation on daily streamflow is more easily detected for larger DOR values. It also suggests that DOR values may be used as a proxy to assess the potential modification of streamflow due to dam operation for river reaches where no recorded streamflow are available. It however does not imply that a reach with DOR > 8 is necessarily influenced by dam operation. River reaches with DOR values larger than 8 may be, in fact, non-influenced by upstream dam operations simply because these dams are not operated or that their operations have negligible impact on daily streamflow. River reaches with DOR > 8 are therefore designated as ‘potentially influenced’ by dam operation.
4.3. Application to southern Quebec river network
The intent of the proposed approach is to provide an indicator identifying the river reaches that are potentially influenced by operation at upstream dams. Such information can be crucial for many applications where recordedflow series at specific reaches are used as proxies forflow at nearby ungauged basins in regional flood frequency analysis or for hydrological modelling. A large scale application of the proposed approach to the southern Quebec river network using readily available data was therefore realized.
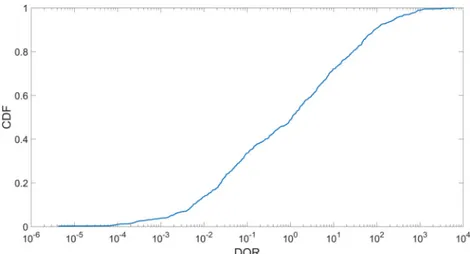
DOR values were estimated for reaches with upstream watersheds completely located within Quebec boundaries for a total of 4,200 reaches with an average reach length of 16 km. Of these river reaches, 3,384 reaches (81%) were unregulated (no upstream dams and DOR values of zero).Fig. 10presents the cumulative distribution of DOR values for all regulated reaches. It is interesting to note that approximately 30% of the regulated river reaches could be potentially influenced (DOR > 8) by dam operation according to our previous analysis.
Fig. 11presents two examples of DOR values for the Rivière St-François watershed (Fig. 11a) and Saguenay watershed (Fig. 11b). These examples show that some classification of the reaches according to the potential influence of dam operation on flows can be made. For instance, river reaches with DOR≥ 8 could be associated with ‘potentially influenced’ reaches.
5. Conclusion
Some applications need to assess the potential influence of dam operation on flow at given river reaches, for example when Fig. 9. Relative DOR values (y-axis) as a function of DOR values (x-axis) for all available stations/periods with upstream dams. Influenced stations/ periods, according to the unimodality test (5% significance level), are indicated by red circles and non-influenced stations/periods correspond to blue circles.
recordedflows at a gauged watershed are used as a proxy for a neighbouring ungauged watershed or downstream reaches, or when using recordedflows for modelling purpose (e.g., calibration or validation of hydrological models). Non-operated dams can be assimilated to storage facilities and corresponding large scale alterations to basin hydrology could be considered as the norm forflood records. Flow distribution analysis should therefore reflect such anthropogenic changes (Villarini and Smith, 2010). Dam operation however, introduces a dynamic component toflow alterations that can be more difficult to detect and take into consideration in regionalflood analysis. In this context, it is important to assess potential changes to natural flows due to dam operation and to identify stations and river reaches that may be influenced by dam operation. Generally dam operating status is unknown. When the operating status is known, dam operating records may still not be available, very vaguely described or even confidential.
The non-unimodality of dailyflow distributions was examined as a possible signature of dam operation on daily recorded flow. The main hypothesis underlying the use of this metric is that many dams are operated according to some specific rules aiming at targeting specific ranges of flow values for certain flow conditions or periods of the year. Recorded flows at 226 stations across southern Quebec were analyzed. Records at these stations were partitioned into sub-periods according to the upstream dam
Fig. 10. Cumulative distribution function (CDF) of DOR values for all reaches with one or more dams in their upstream watersheds.
Fig. 11. Maps of the DOR values for the river reaches of: a) the St-François watershed; and b) the Saguenay watershed. Black circles correspond to dams, green triangles identify stations that are not influenced by dam operation, and red triangles identify stations influenced by dam operation (unimodality test at the 5% significance level).
configuration. Each of these sub-periods, called station/period, therefore corresponds to a daily flow series with a given upstream dam configuration.
A unimodality test, aiming at verifying the hypothesis that the dailyflow distribution was unimodal, was first applied to the 174 available station/periods. Results demonstrated that, for the 70 unregulated stations/periods (i.e. with no upstream dams), four were classified as non-unimodal. A close examination of these four cases showed that three correspond to watersheds located in the northern part of the study region. In these cases, the slow decrease of the springflood and persistence of the spring flow regime over a large part of the summer months explains the non-unimodality of the dailyflow distribution. Non-unimodality of the fourth wa-tershed remains, at this point, unexplained.
Application of the unimodality test to the 104 stations/periods with one or more upstream dams suggested that the impacts of dam operation can be detected in some cases. Many stations downstream of watersheds with one or more large capacity dams with known operation status (MDDELCC-operated dams) displayed non-unimodal dailyflow distributions. Consistency of results for un-regulated stations/periods (unimodal distributions) and un-regulated stations/periods downstream of the dams operated by the MDDELCC-operated dams (some displaying non-unimodal distributions) supports the hypothesis that non-unimodality can be at-tributed to dam operation.
In order to be able to extend the analysis to ungauged river reaches, the ratio of the total reservoir capacity to the median annual volume transiting through a given river reach was defined. This ratio, called Degree of Regulation (DOR), initially proposed by Lehner et al. (2011), is conceptually similar to the IRI used bySinger (2007). It is based on the idea that the potential influence of dam operation will likely be more important when the upstream reservoir capacity stocks a large fraction of the median annualflow transiting in the downstream river reach. Estimation of the DOR values for all stations/periods with one or more upstream dams showed that station/period influenced by dam operation, according to the unimodality test, have DOR values larger than 8. A threshold value for DOR values could therefore be define as a proxy for the potential influence of dam operation on flows.
Note that DOR values were designed to identify the‘potential’ influence of dam operation, that is, an influence that could be detected if the dam is operated. A river reach with a large DOR value may not, in fact, be influenced by dam operation (for instance if the dam is not actually operated). Small DOR values are as well interpreted as indicative that possible dam operations will not influence river reach flows.
Many factors may determine the magnitude of the impacts of dam operation on downstreamflows, such as the dam’s function (hydroelectricity production, water supply,flood protection, etc.), operation rules, operation frequency (daily, weekly, seasonal, annual), reservoir capacity, dam outlets (gates, spillway, etc.), etc. Unimodality test measures one specific type of influence (modality of dailyflow distribution). Other indices (e.g., IHA indices) may therefore be needed to detect other possible impacts of dam op-eration onflows. Using ‘standard’ indices (such as IHA indices) however, imply that some reference range of index values be defined for non-influenced or natural configurations and that some metric be defined to measure possible departure from these values. Unimodality test, in contrast, provides interesting ways to assess the potential influence of dam operation on daily flow and is easy to implement and interpret. Furthermore, this index is more directly linked to dam operation. Note that non-unimodal dailyflow distributions can also be observed (rarely according to our results) for unregulated watersheds.
Future work should extend the study to other regions in order to verify how dam operations affect the daily flow distributions as reported in this study. Additionally, results based on unimodality test should be compared with those produced from approaches based on indicators of hydrologic alteration (Peñas et al., 2016).
Conflict of interest None.
Acknowledgements
The authors would like to thank Julie Lafleur and Louis-Guillaume Fortin from the MDDELCC for their expertise on dam op-erations and Quebec’s dam network. They also would like to thank Stéphanie Beauregard and Marie-Lise Paquin for their technical assistance in geomatics and dam database. This project was funded by the MDDELCC from the Quebec Government.
References
Assani, A.A., Stichelbout, E., Roy, A.G., Petit, F., 2006. Comparison of impacts of dams on the annual maximumflow characteristics in three regulated hydrologic regimes in Quebec (Canada). Hydrol. Process 20 (16), 3485–3501.https://doi.org/10.1002/hyp.6150.
Batalla, R.J., Gomez, C.M., Kondolf, G.M., 2004. Reservoir-induced hydrological changes in the Ebro River basin (NE Spain). J. Hydrol 290 (1–2), 117–136.https://
doi.org/10.1016/j.jhydrol.2003.12.002.
Bevelhimer, M.S., McManamay, R.A., O’Connor, B., 2015. Characterizing sub-daily flow regimes: implications of hydrologic resolution on ecohydrology studies. River Res. App. 31, 867–879.https://doi.org/10.1002/rra.2781.
Carlisle, D.M., Falcone, J., Wolock, D.M., Meador, M.R., Norris, R.H., 2010. Predicting the naturalflow regime: models for assessing hydrological alterations in streams. River Res. App. 26 (2), 118–136.https://doi.org/10.1002/rra.1247.
Carolli, M., Vanzo, D., Siviglia, A., Zolezzi, G., Bruno, M.C., Alfredsen, K., 2015. A simple procedure for the assessment of hydropeakingflow alterations applied to several European streams. Aquat. Sci. 7 (4), 639–653.https://doi.org/10.1007/s00027-015-0408-5.
CEHQ, 2014. Guide d’interprétation de la fiche technique d’un barrage, Centre d’expertise hydrique du Québec, Direction de la sécurité des barrages. Gouvernement du
Québec 20 p. (in French).
Chen, Q., Zhang, X., Chen, Y., Li, Q., Qiu, L., Liu, M., 2015. Downstream effects of a hydropeaking dam on ecohydrological conditions at subdaily to monthly time scales. Ecol. Eng. 77, 40–50.https://doi.org/10.1016/j.ecoleng.2014.12.017.
FitzHugh, T.W., Vogel, R.M., 2011. The impact of dams onflood flows in the United States. River Res. App. 27 (10), 1192–1215.https://doi.org/10.1002/rra.1417. Gao, Y., Vogel, R.M., Kroll, C.N., Poff, N.L., Olden, J.D., 2009. Development of representative indicators of hydrologic alteration. J. Hydrol. 374 (1-2), 136–147.
https://doi.org/10.1016/j.jhydrol.2009.06.009.
Graf, W.L., 1999. Dam nation: a geographic census of American dams and their large-scale hydrologic impacts. Water Resour. Res. 35 (4), 1305–1311.https://doi.org/
10.1029/1999wr900016.
Graf, W.L., 2006. Downstream hydrologic and geomorphic effects of large dams on American rivers. Geomorphology 79 (3-4), 336–360.https://doi.org/10.1016/j.
geomorph.2006.06.022.
Grill, G., Lehner, B., Lumsdon, A.E., MacDonald, G.K., Zarfl, C., Liermann, C.R., 2015. An index-based framework for assessing patterns and trends in river frag-mentation andflow regulation by global dams at multiple scales. Environ. Res. Lett. 10 (1), 015001.https://doi.org/10.1088/1748-9326/10/1/015001. Gross, E.J., Moglen, G.E., 2007. Estimating the hydrological influence of Maryland state dams using GIS and the HEC-1 model. J. Hydrol. Engrg (ASCE) 12 (6),
690–693.https://doi.org/10.1061/(asce)1084-0699(2007)12:6(690).
Hartigan, J.A., Hartigan, P.M., 1985. The dip test of unimodality. Ann. Stat. 13 (1), 70–84.https://doi.org/10.1214/aos/1176346577.
Lajoie, F., Assani, A.A., Roy, A.G., Mesfioui, M., 2007. Impacts of dams on monthly flow characteristics. The influence of watershed size and seasons. J. Hydrol. 334 (3-4), 423–439.https://doi.org/10.1016/j.jhydrol.2006.10.019.
Lehner, B., Liermann, C.R., Revenga, C., Vorosmarty, C., Fekete, B., Crouzet, P., Doll, P., Endejan, M., Frenken, K., Magome, J., Nilsson, C., Robertson, J.C., Rodel, R., Sindorf, N., Wisser, D., 2011. High-resolution mapping of the world’s reservoirs and dams for sustainable river-flow management. Front. Ecol. Environ. 9 (9), 494–502.https://doi.org/10.1890/100125.
Magilligan, F.J., Nislow, K.H., 2005. Changes in hydrologic regime by dams. Geomorphology 71 (1-2), 61–78.https://doi.org/10.1016/j.geomorph.2004.08.017. Magilligan, F.J., Nislow, K.H., Graber, B.E., 2003. Scale-independent assessment of discharge reduction and riparian disconnectivity followingflow regulation by
dams. Geology 31 (7), 569–572.https://doi.org/10.1130/0091-7613(2003)031<0569:saodra>2.0.co;2.
Mailhot, A., Talbot, G., Khedhaouiria, D., 2014. Caractérisation de l’influence des barrages sur les débits mesurés. Rapport de recherche No R-1465. Institut National de
la Recherche Scientifique INRS-Eau, Terre et Environnement, Québec 170 p. (in French).
Matteau, M., Assani, A.A., Mesfioui, M., 2009. Application of multivariate statistical analysis methods to the dam hydrologic impact studies. J. Hydrol. 371, 120–128.
https://doi.org/10.1016/j.jhydrol.2009.03.022.
Mei, X.F., Van Gelder, P.H.A.J.M., Dai, Z.J., Tang, Z.H., 2017. Impact of dams onflood occurrence of selected rivers in the United States. Frontiers Earth Science 11 (2), 268–282.https://doi.org/10.1007/s11707-016-0592-1.
Meile, T., Boillat, J.L., Schleiss, A.J., 2011. Hydropeaking indicators for characterization of the Upper-Rhone River in Switzerland. Aquat. Sci. 73, 171–182.https://
doi.org/10.1007/s00027-010-0154-7.
Nilsson, C., Reidy, C.A., Dynesius, M., Revenga, C., 2005. Fragmentation andflow regulation of the world’s large river systems. Science 308 (5720), 405–408.https://
doi.org/10.1126/science.1107887.
Peñas, F.J., Barquin, J., Alvarez, C., 2016. Assessing hydrologic alteration: evaluation of different alternatives according to data availability. Ecol. Indic. 60, 470–482.
https://doi.org/10.1016/j.ecolind.2015.07.021.
Poff, N.L., Hart, D.D., 2002. How dams vary and why it matters for the emerging science of dam removal. Bioscience 52 (8), 659–668.
https://doi.org/10.1641/0006-3568(2002)052%5B0659:HDVAWI%5D2.0.CO;2.
Poff, N.L., Schmidt, J.C., 2016. How dams can go with the flow. Science 353 (6304), 1099–1100.https://doi.org/10.1126/science.aah4926.
Poff, N.L., Bledsoe, B.P., Cuhaciyan, C.O., 2006. Hydrologic variation with land use across the contiguous United States: geomorphic and ecological consequences for stream ecosystems. Geomorphology 79 (3–4), 264–285.https://doi.org/10.1016/j.geomorph.2006.06.032.
Richter, B.D., Baumgartner, J.V., Powell, J., Braun, D.P., 1996. A method for assessing hydrologic alteration within ecosystems. Conserv. Biol. 10 (4), 1163–1174.
https://doi.org/10.1046/j.1523-1739.1996.10041163.x.
Schmidt, J.C., Wilcock, P.R., 2008. Metrics for assessing the downstream effects of dams. Water Resour. Res. 44, W04404.https://doi.org/10.1029/2006wr005092. Singer, M.B., 2007. The influence of major dams on hydrology through the drainage network of the Sacramento River basin, California. River Res. App. 23 (1), 55–72.
https://doi.org/10.1002/rra.968.
The Nature Conservancy, 2006. Indicators of Hydrologic Alteration Version 7.1 User’s Manual. pp. 81.
Villarini, G., Smith, J.A., 2010. Flood peak distributions for the eastern United States. Water Resour. Res. 46, W06504.https://doi.org/10.1029/2009WR008395. White, M.A., Schmidt, J.C., Topping, D.J., 2005. Application of wavelet analysis for monitoring the hydrologic effects of dam operation: Glen Canyon Dam and the
Colorado River at Lees Ferry, Arizona. River Res. App. 21 (5), 551–565.https://doi.org/10.1002/rra.827.
Zarfl, C., Lumsdon, A.E., Berlekamp, J., Tydecks, L., Tockner, K., 2015. A global boom in hydropower dam construction. Aquat. Sci. 77 (1), 161–170.https://doi.org/
10.1007/s00027-014-0377-0.
Zimmerman, J.K.H., Letcher, B.H., Nislow, K.H., Lutz, K.A., Magilligan, F.J., 2010. Determining the effects of dams on subdaily variation in river flows at a whole-basin scale. River Res. App. 26 (10), 1246–1260.https://doi.org/10.1002/rra.1324.