Fire Regime along Latitudinal Gradients of
Continuous to Discontinuous Coniferous Boreal
Forests in Eastern Canada
Jeanne Portier1,*, Sylvie Gauthier2, Alain Leduc3, Dominique Arseneault4and Yves Bergeron5 1 Département des Sciences Biologiques, Université du Québec à Montréal and Centre for Forest Research,
Case postale 8888, Succursale Centre-ville Montréal, QC H3C 3P8, Canada
2 Natural Resources Canada, Canadian Forest Service, Laurentian Forestry Centre, 1055 du PEPS, P.O. Box 10380, Stn. Sainte-Foy, Québec, QC G1V 4C7, Canada; sylvie.gauthier2@canada.ca
3 Département des Sciences Biologiques, Chaire Industrielle CRSNG UQAT-UQAM en Aménagement Forestier Durable, Université du Québec à Montréal and Centre for Forest Research, Case postale 8888, Succursale Centre-ville Montréal, QC H3C 3P8, Canada; leduc.alain@uqam.ca
4 Département de Biologie, Chimie et Géographie, Centre for Northern Studies, Université du Québec à Rimouski, 300, Allée des Ursulines, Rimouski, QC G5L 3A1, Canada; dominique_arseneault@uqar.ca 5 Forest Research Institute, Université du Québec en Abitibi-Témiscamingue and Université du Québec à
Montréal, 445, boul. de l’Université, Rouyn-Noranda, QC J9X 5E4, Canada; Yves.Bergeron@uqat.ca * Correspondence: portier.jeanne@courrier.uqam.ca; Tel.: +1-514-987-3000 (ext. 7608)
Academic Editor: Timothy A. Martin
Received: 6 June 2016; Accepted: 8 September 2016; Published: 24 September 2016
Abstract: Fire is the main disturbance in North American coniferous boreal forests. In Northern Quebec, Canada, where forest management is not allowed, the landscape is gradually constituted of more opened lichen woodlands. Those forests are discontinuous and show a low regeneration potential resulting from the cumulative effects of harsh climatic conditions and very short fire intervals. In a climate change context, and because the forest industry is interested in opening new territories to forest management in the north, it is crucial to better understand how and why fire risk varies from the north to the south at the transition between the discontinuous and continuous boreal forest. We used time-since-fire (TSF) data from fire archives as well as a broad field campaign in Quebec’s coniferous boreal forests along four north-south transects in order to reconstruct the fire history of the past 150 to 300 years. We performed survival analyses in each transect in order to (1) determine if climate influences the fire risk along the latitudinal gradient; (2) fractionate the transects into different fire risk zones; and (3) quantify the fire cycle—defined as the time required to burn an area equivalent to the size of the study area—of each zone and compare its estimated value with current fire activity. Results suggest that drought conditions are moderately to highly responsible for the increasing fire risk from south to north in the three westernmost transects. No climate influence was observed in the last one, possibly because of its complex physical environment. Fire cycles are shortening from south to north, and from east to west. Limits between high and low fire risk zones are consistent with the limit between discontinuous and continuous forests, established based on recent fire activity. Compared to the last 40 years, fire cycles of the last 150–300 years are shorter. Our results suggest that as drought episodes are expected to become more frequent in the future, fire activity might increase significantly, possibly leading to greater openings within forests. However, if fire activity increases and yet remains within the range of variability of the last 150–300 years, the limit between open and closed forests should stay relatively stable.
Keywords: fire history reconstruction; fire cycle; fire risk; black spruce–moss forests; lichen woodlands; boreal ecosystems; fire weather; survival analyses
Forests 2016, 7, 211 2 of 23
1. Introduction
By controlling structural and compositional attributes, fire is the main disturbance shaping the North American boreal forest [1,2]. Fires affect the forest’s structure by creating a mosaic of stands of different ages and sizes [3,4], thus constantly rejuvenating stands and landscapes. Fire cycles, defined as the time required to burn an area equivalent to that of the study area [5,6], determine the age structure of forest stands [7,8] across the landscape. Fires also influence stands’ composition by controlling succession patterns, for instance, by favoring fire-adapted species such as jack pine (Pinus banksiana) or black spruce (Picea mariana) [9–11]. Fire regimes are highly variable in space as a result of various environmental factors acting on different scales [12–14]. Climate acts as a top-down factor from regional to continental scales. In Canada, for instance, the increasing gradient of fire activity observed from east to west is caused by the spatial variability in the frequency of drought events [15,16]. However, topography [14,17], surficial deposits and drainage [18], or fuel type and availability [19] are bottom-up factors which act from stand to regional scales. Fire regimes also vary in time; for example, the end of the Little Ice Age that occurred around 1850 represents a well-known transition to lower fire cycles in eastern Canada [8,20]. Temporal variations in fire activity are mainly driven by climatic factors such as shifting air masses responsible for dry conditions [20–22].
The coniferous boreal forest of Quebec, eastern Canada, experiences a gradient of dense, continuous forests to the south that transition to discontinuous, less productive forests [23,24], and finally to the forest tundra in the north [2]. The northern open forests are mainly constituted of lichen woodlands resulting from numerous factors such as limited post-fire regeneration due to low seed production [25], unfavorable climate, short intervals between successive fires [26–29], and high severity of large fires [30].
Transition ecosystems are known to be extremely vulnerable to climate change [31], and particularly so for the boreal forest where fire activity is expected to increase [32]. Because the opening of these forests is closely related to fire activity, studying their fire regime is crucial. In Quebec, there is evidence that current fire activity is higher in northern discontinuous forests than in the commercial boreal forest further south [24]. However, it is not clear whether climate is responsible for this latitudinal gradient, or if the underlying climate factors are constant.
Moreover, from a forest management perspective, it is important to understand how fire regimes vary depending on the latitude. In Quebec, northern discontinuous forests are protected from commercial forest harvesting by the legal limit of the commercial forest. It is thought that forest management could worsen the problem of regeneration failures at high northern latitudes under climatic influence. However, the spatial and temporal variability of fire regimes along the latitudinal gradient is still poorly known. The zonation of fire activity is also of interest, as zones with high annual area burned can jeopardize forests’ post-fire recovery [29], although recent studies have shown that the boreal forest could express a certain resistance toward high burn rates [33]. Learning more about the spatial consistency of high fire risk zones is particularly important in the context of the northern limit of the commercial forest because their expansion to the south could lead to a reduction in the area available for forest management.
The objective of this research is to assess the latitudinal variability of fire regime at the transition between continuous and discontinuous coniferous boreal forests in Quebec over the last 150–300 years, and its relation to climatic conditions. Even if a zonation of fire activity had been developed in previous studies based on current fire regimes [24], the spatiotemporal consistency of the fire zones over a longer temporal scale has not been explored. The first step of this study was to reconstruct the fire history along four north-south roads almost equally distributed over the black spruce forest of Quebec, using fire archives and dendroecological surveys. We used survival models to assess whether climate was influencing fire risk—defined here as the relative hazard of burning compared with the road average—along each road. The latitudinal distribution of fire risk was then used to delimit homogeneous fire risk zones for each road. Then, the fire cycle of each fire risk zone was calculated allowing for an assessment of fire risk variability along the longitudinal gradient. Finally, fire cycles
were compared to previous estimates based on the recent fire history in order to highlight the temporal variability of the fire regime in the study area.
2. Materials and Methods 2.1. Study Area
The study area is located in the boreal zone of Quebec and lies between latitudes 49.5◦N and 53◦N. The region is mainly coniferous and dominated by black spruce. It covers a gradient from closed, dense forests in the spruce-moss domain to the south, to more open and fragmented forests in the spruce-lichen domain to the north (Figure1b). The limit of the commercial forest crosses the study area separating managed forests in the south from unmanaged ones in the north.
1
Figure 1.Maps of the study area showing the four transects being analyzed, along with (a) the elevation profile and (b) the live aboveground biomass in tons per hectare from Beaudoin et al. [34] of the study area. The northern limit of the commercial forest in Quebec is also shown.
Forests 2016, 7, 211 4 of 23
In order to cover the latitudinal gradient and because access is difficult in the north of the study area, four north-south roads that are almost evenly distributed from west to east were chosen as a means in which to reach forest stands and served as a basis for our sampling design. Those roads were divided into consecutive 2500 ha-cells (5 km long by 5 km wide) and will hereafter be referred to as transects (Figures1and2).
1
Figure 2.Detailed maps of the four transects showing the corresponding 2500 ha-cells. Fire archives (from 1924 to 2014) and the northern limit of the commercial forest in Quebec are also shown. Each cell that is not overlapped by a recent fire has been subject to a dendroecological survey at a randomly located point in order to determine its time-since-fire (TSF). Latitudinal breakpoints between the fire risk zones are also presented; the two smaller lines in panel (b) delimit the mountainous area excluded for the calculation of fire cycles.
The transects are located in the James Bay region (A), the Chibougamau area (B), the North Shore (C), and along the Romaine River (D). They are 81, 94, 83, and 34-cell-long, respectively. Transect D comprises less cells because of a shorter road. However, 28 cells were added to the original dataset using plots previously sampled for the Northern Forest Inventory Program of the Ministère des Forêts, de la Faune et des Parcs (MFFP) (NFIP; 2005 to 2009). These additional cells are located at a maximum distance of 45 km on either side of the transect.
2.2. Time-Since-Fire Data
As the study area is remote and not easily accessible, we developed a data collection strategy which attempts to maximize the use of fire archive data available for the area between 1924 and 2014 and to complement it with field sampling.
2.2.1. Fire Archive Data (1924–2014)
First, fire archives for the 1924–2014 period obtained from the MFFP were used to reconstruct the most recent fire history (FigureA1). However, this database may gradually become less complete or lose dating precision with time, particularly towards the northern areas, as it becomes more likely that some fires were either overlapped by most recent fires, or not detected, reported, and archived. The database precision is excellent after 1972 [24], very good after 1940, but some small fires can be missing or not perfectly delimited between 1924 and 1940. In some cases—mainly in the north and for the oldest fires recorded—the fire date is noted to the nearest five- to ten year interval. For those fires, the middle year of the range was used in the analyses.
Using ArcGIS 10.0, fires at least partially overlapping a cell were identified for each transect. The corresponding time-since-fire (TSF) was then assigned to the cells regardless of the relative importance of the area burned in the cell. When more than one fire partly overlapped a cell, only the most recent TSF was kept. This last situation concerned mostly areas where fires are recurrent (Figure2). 2.2.2. Field Sampling Design
The field campaign took place in 2013 for transects A, B, and C, and in 2014 for transect D. In the north of transect A, from the top of the transect to Broadback River, the TSF data from Héon et al. and Erni et al. [33,35] collected along a 200 km long transect was used. The data was adapted to our study design and sampling effort by rescaling their original 2 km by 1 km sampling cells.
In each cell where no TSF was assigned from the fire archives, a point corresponding to a sampling plot was randomly generated from 100 m to 750 m on either side of the road. We assumed that those random points are representative of their corresponding cells in terms of TSF because in our study area, the mean fire size—calculated over the 1924–2014 period—is 5200 ha while our cells are 2500 ha. For this reason, a random point is very likely to capture the most representative fire that occurred in a cell.
In our effort to compare our results with those of Gauthier et al. [24] who studied the fire regime between 1972 and 2009, all cells that burned between 1972 and 2014 needed to be assigned with a pre-1972 TSF. Therefore, an additional point was sampled outside the polygon of the post-1972 fire in those cells if no pre-1972 fire date was recorded in the fire archives.
For each plot, 10-dominant trees were sampled (section or core taken as close to the ground as possible), with priority given first to jack pine (Pinus blanksiana), and then to black spruce (Picea mariana), paper birch (Betula papyfera), trembling aspen (Populus tremuloides) and, lastly, to balsam fir (Abies balsamea). This order of priority was determined based on the rapidity of these species to regenerate after a fire in order to better approximate the real TSF. The trees’ age was determined by counting their annual growth rings. In a given cell, if all trees were the same age plus or minus 20 years, the TSF of the cell was considered equal to the age of the oldest tree. Otherwise, the age of the oldest tree was considered a minimum TSF, and therefore right-censored. Because post-fire trees
Forests 2016, 7, 211 6 of 23
are eventually replaced by new ones as succession proceeds, assessing the exact TSF becomes more difficult as a stand ages.
2.2.3. Relative Importance of Recent Fires
Road layout depends on different physical attributes of the landscape as they are usually built on specific surficial deposits. They are also more used by humans than the rest of the landscape. Both these particularities of our transect roads, which have all been built after 1924, can bias the TSF distribution toward more recent fires, thereby affecting estimations of burn rate. Moreover, in some areas, fires can be rare and yet very large. When roads cross such large fires, it can lead to an overestimation of the number of burned cells compared with the average burn rate of the corresponding region. For all those reasons, we computed for each transect the proportion of recent fires (after 1924) in the cells as well as in a 45 km-wide buffer around the transect. Because recent fires were slightly overestimated in all transects comparatively to the 45 km-wide buffers, the cells that burned after 1924 were down-weighted in the analyses. Weights were calculated in each transect in order to match the relative frequency of recent fires with the relative area recently burned in the surrounding landscape. Weights of cells burned between 1924 and 2014 of transects A, B, C, and D are 0.57, 0.41, 0.36, and 0.46, respectively; while all other cells were assigned a weight of 1.
2.3. Climate Data
The Fire Weather Index (FWI) System consists of six indices derived from meteorological observations—namely temperature, relative humidity, wind speed, and 24-h rainfall—which provide numeric ratings of relative potential for wildland fire. The Fine Fuel Moisture Code (FFMC), the Duff Moisture Code (DMC), and the Drought Code (DC) constitute the fuel moisture codes, and the Initial Spread Index (ISI), the Buildup Index (BUI), and the Fire Weather Index (FWI) constitute the fire behaviour indices. We extracted the value of these indices for each cell within each transect using the BioSIM 9 software [36]. BioSIM allows the user to compensate for the scarcity of weather stations in a study area by interpolating climate data from nearby weather stations, with adjustments for elevation, latitude, and longitude [36]. We extracted the mean value of each index in the FWI system over the period of 1971 to 2000 at the cell’s centroids. Means of each index in each cell were calculated for spring months (April to June), summer months (July to September), and fire season months (May to August). 2.4. Statistical Analyses
Survival analyses are often used in fire studies because of their ability to examine the time required for an event to occur, which in our case refers to the TSF, and its relationship with one or more covariates. They produce a survival distribution function corresponding to the probability of having gone without fire at each time t, from which a fire cycle can be calculated. Not only are survival analyses adapted to time to event data, but they also allow for censored observations in the modelling process. This is a major advantage compared to regular fire cycle analyses, which strictly assume that TSF is given by the stand age, with no distinction in stands that have been attributed a minimum age. This often leads to an underestimation of the fire cycle that can be attenuated with survival analyses [37].
Among the different types of survival analyses available, we selected a semi-parametric model known as the Cox proportional hazard regression [38]. Although this model is one of the most commonly used for survival analyses in other fields—mainly in medicine—still very few fire studies have explored its potential (e.g., [39,40]).
The Cox proportional hazard model is made of two distinct parts. The first part corresponds to the baseline hazard function (cumulative hazard function when all covariates values are set to zero), i.e., the non-parametric portion of the model, which is initially left unspecified. This has great advantage over parametric models (such as the Weibull distribution, which has been widely used in fire cycle studies) because it avoids making arbitrary and possibly incorrect assumptions about the form of
the baseline hazard function. Instead, it is derived from the empirical TSF distribution. In terms of fire history, it means that since the model does not assume a constant risk of burning through time, it allows for variations in the fire regime that could have happened in the past, resulting, for example, from human activities or climate change. Those variations are therefore taken into account while calculating the fire cycle, giving a more precise fire history estimate [37]. The second part of the Cox model is parametric and is estimated using the method of partial likelihood [38]. It is used to evaluate the relationship between the tested covariates and survival. Our survival models were built using the coxph function of the survival R package [41].
Cox proportional hazard models were used all along the analysis process. They were built either with covariates in order to test the effect of climate on fire risk and delimitate fire risk zones along the transects, or as null models in order to calculate the fire cycle of each fire risk zone previously determined. Analyses were performed for each transect separately, as four independent entities, each representative of their surrounding region. Indeed, the four transects are under very different climatic regimes, and merging them into the same analysis process would make impossible the estimation of the climate effect at the scale of one particular transect. Moreover, we wanted to identify variables affecting the fire risk independently for each transect. Although analyses are realized per transect and allow for the latitudinal assessment of the fire risk variability, calculating fire cycles provides a means of assessing the longitudinal variability by comparing fire activity among transects. 2.4.1. Climate Influence on Fire Risk
For each transect, survival models were built in order to examine the influence of the different FWI indices—hereafter referred to as climate variables—on TSF. A supervised forward model selection was conducted in order to select the climate variables that best explained the fire risk. This multi-step process was conducted using the Akaike Information Criterion (AIC). Figure 3summarizes the different steps of the model selection process. First, univariate models were built in order to test for each climate variable individually. For each model, the AIC and∆AIC(i.e., the difference from the model having the lowest AIC) were calculated. Models with a∆AIChigher than 6 from the best univariate model were discarded [42]. The second step consisted in adding a second variable to each model selected. Only variables that were not collinear with the first one (threshold: correlation coefficient of Pearson < 0.7) were tested as second variables. A second variable was kept only if the model with two variables showed a lower AIC value by at least 2 than the AIC of the corresponding univariate model, in which case the univariate model was discarded. The same process of adding variables was repeated until the model could not be improved by any additional variable. The AIC of all selected models were compared and those having a∆AICvalue higher than 2 from the best model were discarded. Among all models having a∆AIClower than 2, only the most parsimonious ones were retained, and the one with the lowest AIC value was kept as the final model. The AIC of this model was finally compared with the AIC of a null model to ensure the overall improvement. Bootstrap was then applied by randomly sampling with replacement (1000 iterations) the original dataset containing TSF and climate variables to extract a 95% confidence interval on the variables’ estimates using the lower and upper percentiles.
Forests 2016, 7, 211 8 of 23
Forests 2016, 7, 211 8 of 23
Figure 3. Diagram summarizing the different steps of the model selection process using Akaike
Information Criterion (AIC). This procedure is applied to each transect individually. The set of univariate survival models is built using each climate variable separately. 2.4.2. Relative Fire Risk and Latitudinal Risk Zonation For each transect, the predicted fire risk of each cell was extracted from the final best‐fitted model containing the selected climate variables (Figure 3). A 95% confidence interval on the fire risk was calculated using the same bootstrapping process detailed in the previous section. Because the Cox model is a relative risk model, the predicted risk is relative to the sample used in the model, so it can only be interpreted within a transect. The mean risk of a transect is set to one, and is associated with the mean value of the variables used in the model. The value of the risk can then take any positive
Figure 3. Diagram summarizing the different steps of the model selection process using Akaike Information Criterion (AIC). This procedure is applied to each transect individually. The set of univariate survival models is built using each climate variable separately.
2.4.2. Relative Fire Risk and Latitudinal Risk Zonation
For each transect, the predicted fire risk of each cell was extracted from the final best-fitted model containing the selected climate variables (Figure3). A 95% confidence interval on the fire risk was calculated using the same bootstrapping process detailed in the previous section. Because the Cox model is a relative risk model, the predicted risk is relative to the sample used in the model, so it can only be interpreted within a transect. The mean risk of a transect is set to one, and is associated with the mean value of the variables used in the model. The value of the risk can then take any positive
value and show how many times the risk equals the mean risk of the transect. We chose to graphically represent the results using the log-transformed values of the predicted risk. This scale indeed implies the same range of risk values on both sides of the mean risk value, which on this scale equals zero. For each transect, the log-transformed predicted fire risk variations along the latitudinal gradient allowed us to identify fire risk zones where the fire risk was diverging significantly from the mean risk of the transect. Each transect was thereby separated into different zones, where each was attributed either a low, moderate, or high fire risk relative to the mean risk of the entire transect.
2.4.3. Fire Cycle
Calculating the fire cycle of each transect zone allows for the comparison of fire activity between transects, as we are no longer dealing with relative estimates within transects. Fire cycles can therefore be used to assess the fire activity variability along both latitudinal and longitudinal gradients. Moreover, in order to compare our results with those of Gauthier et al. [24] who regionalized the entire coniferous boreal vegetation domain based on fire cycles over the period 1972–2009, fire cycles were calculated for two different periods (i.e., previous to 2014 and to 1972). Calculating fire cycles with and without the 1973–2014 years also allows for the ability to highlight the impact of recent years (post-1972) on past fire regimes, and therefore to assess the temporal variability of fire activity over these two periods.
In order to calculate the observed fire cycle of each transect zone, a stratified null Cox model was built for each transect. No variables were added to the models in order to capture the observed fire cycle per zone, as opposed to a predicted fire cycle, based on the prevailing climate conditions. A special strata term specifying which cell belongs to which transect zone was added to the models in order to take into account how transects were split into different zones. The estimated cumulative hazard of burning (baseline hazard function) could then be extracted for each transect zone [41], representing the accumulated hazard of burning through time. The time it takes for the cumulative hazard to reach 1 is equivalent to the fire cycle [37,39]. To estimate the fire cycle, the time at which the cumulative hazard reached or exceeded 1 was then divided by its associated cumulative hazard. In case the cumulative hazard never reached 1, the fire cycle was calculated as the time at which the cumulative hazard reached its maximum value, divided by this maximum cumulative hazard value. A 95% bootstrap confidence interval on the fire cycle was calculated using 1000 randomizations with replacement of the original TSF dataset. The confidence interval was computed using the lower and upper percentiles.
3. Results
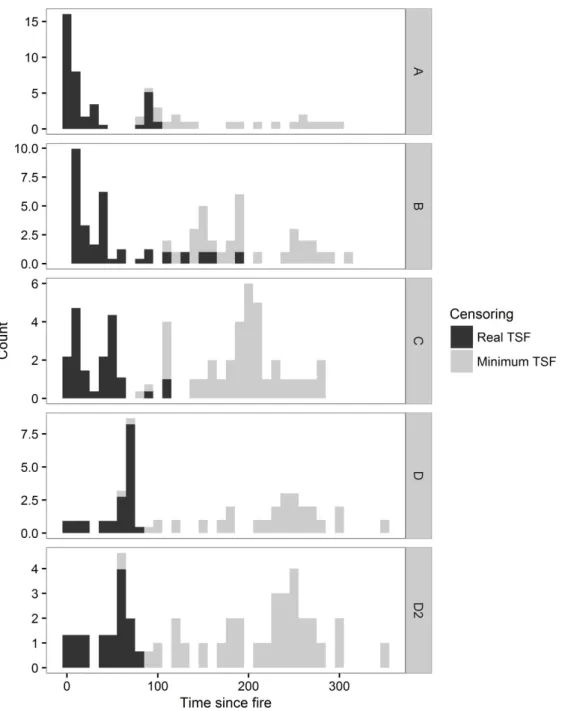
The frequency distributions of TSF (Figure4) show that whereas most recent fires are dated to the year, they are mostly dated with a minimum TSF beyond 90–100 years. Transects A, B, C, and D show 26%, 32%, 43%, and 44% of minimum TSF data, respectively, thus underlining the importance of considering censored data in survival analyses. Transects C and D are located in the North Shore region of Quebec where the proportion of balsam fir, a fire-sensitive species, is much greater than in the other transects, suggesting that these stands did not establish themselves immediately after a fire event. In these old stands, it is usually difficult to date the TSF precisely, which explains the higher percentage of censored data in these two transects. The minimum dates we recorded for transects A, B, C, and D are 1719, 1703, 1731, and 1663, respectively.
Peaks of TSF can sometimes correspond to single fires. For example, the most recent peak in transect A results at 80% from a very large 2013 fire, although immense fires are common in this region [33,35]. In transect D, a large fire occurred in the 1940s in its southernmost part that covered close to 26% of the entire transect. Unlike in transect A, this fire appears as an exceptional event when compared to the surrounding landscape. It is not only the largest, it also covers more than 31% of the area burned since 1924 within a 200 km-wide area centered on the transect and delimited in the north by the breakpoint in the latitudinal zonation section (see below), and in the south, by the bottom of the transect. Moreover, the fire is about 16 times larger than the mean size of all fires that have
Forests 2016, 7, 211 10 of 23
occurred in this area since 1924. For this reason, the cells associated to this particular fire were either removed or re-associated with a previous TSF (obtained from field data or fire archives). We will refer to this configuration as transect D2. This approach also allows for a clearer demonstration of how this fire is influencing our results, as it could either lead to an overestimation of the fire risk or to a misinterpretation of the climate’s influence on the fire risk.
Forests 2016, 7, 211 10 of 23 removed or re‐associated with a previous TSF (obtained from field data or fire archives). We will refer to this configuration as transect D2. This approach also allows for a clearer demonstration of how this fire is influencing our results, as it could either lead to an overestimation of the fire risk or to a misinterpretation of the climate’s influence on the fire risk.
Figure 4. Decadal weighted frequency distribution of TSF for each transect. Weights are calculated in
the same way that they were in the survival analyses in order to compensate for the over‐ representation of recent fires (after 1924) in transects. The non‐weighted frequency distribution of TSF is presented in Figure A2. The proportion of right‐censored data (minimum TSF) and real TSF are shown in grey and black, respectively.
3.1. Climate Influence on Fire Risk
Figure 4.Decadal weighted frequency distribution of TSF for each transect. Weights are calculated in the same way that they were in the survival analyses in order to compensate for the over-representation of recent fires (after 1924) in transects. The non-weighted frequency distribution of TSF is presented in FigureA2. The proportion of right-censored data (minimum TSF) and real TSF are shown in grey and black, respectively.
3.1. Climate Influence on Fire Risk
In all transects, the selected models have a lower AIC than the null models with∆AICvalues higher than 7 (Table1), meaning that null models can be discounted [43]. Moreover, in all transects
except B, the ∆AIC values with null models are higher than 10, a threshold indicating with high certainty that the selected models are highly plausible [44]. Pseudo-R2are all above 0.35, except for transect B.
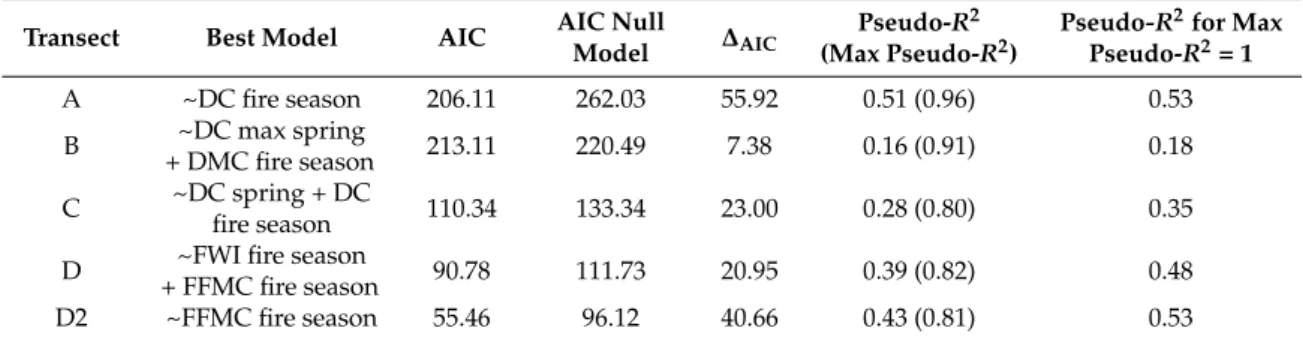
Table 1.Best models according to the supervised forward model selection procedure for each transect. AIC of the best and null models are given as well as their difference (∆AIC). Cox and Snell’s pseudo-R2 of best models, their associated maximum value, and the corresponding pseudo-R2value for max pseudo-R2= 1 are also shown.
Transect Best Model AIC AIC Null
Model ∆AIC
Pseudo-R2
(Max Pseudo-R2)
Pseudo-R2for Max
Pseudo-R2= 1 A ~DC fire season 206.11 262.03 55.92 0.51 (0.96) 0.53 B ~DC max spring + DMC fire season 213.11 220.49 7.38 0.16 (0.91) 0.18 C ~DC spring + DC fire season 110.34 133.34 23.00 0.28 (0.80) 0.35 D + FFMC fire season~FWI fire season 90.78 111.73 20.95 0.39 (0.82) 0.48 D2 ~FFMC fire season 55.46 96.12 40.66 0.43 (0.81) 0.53
DC, Drought Code; DMC, Duff Moisture Code; FWI, Fire Weather Index; FFMC, Fine Fuel Moisture Code.
All variables in AIC selected models have significant effects on the fire risk (Table2). In transect A, the Drought Code (DC) during the fire season increases the fire risk. In transects B and C, models with two variables were selected. The first variables (lowest p-value) with the most important positive effect on the fire risk, are maximum DC and DC during spring, respectively. The second variables selected show a slight negative effect on the fire risk for both transects, suggesting an adjustment to the positive effects of the first variables. In transects D and D2, the main climatic factor selected is the Fine Fuel Moisture Code (FFMC) during fire season. In contrast to the other transects, FFMC decreases the fire risk even though it is an indicator of sustained flaming ignition and fire spread [45,46].
Table 2. Coefficients of models presented in Table1. The 95% confidence interval (CI95) for each coefficient was obtained after 1000 randomizations with replacement of the original dataset. p-values and exponentiated coefficients with their CI are also shown.
Transect Variables Coefficient (CI95) exp (Coefficient) p-value exp (CI95))
A DC fire season 0.16 (0.13; 0.19) 1.17 (1.14; 1.21) 3.61e−11 B DC max spring 0.30 (0.21; 0.40) 1.35 (1.23; 1.49) 9.32e
−5 DMC fire season −0.61 (−0.89;−0.35) 0.54 (0.41; 0.70) 5.67e−4 C DC spring 0.75 (0.55; 1.00) 2.12 (1.73; 2.72) 8.59e
−6 DC fire season −0.23 (−0.38;−0.08) 0.79 (0.68; 0.92) 3.08e−2 D FFMC fire season −3.97 (−5.42;−2.88) 0.02 (0.00; 0.06) 1.14e
−5 FWI fire season 4.11 (1.66; 6.80) 60.95 (5.26; 897.85) 1.25e−2 D2 FFMC fire season −2.73 (−3.62;−2.14) 0.07 (0.03; 0.12) 2.10e−6
In the Cox proportional hazard model, the relevant estimates are the exponentiated coefficients, which represent the multiplicative effect on the risk of burning. Thus, if we take the example of transect C (Table2), when holding the DC fire season constant, an increase of 1 in the DC spring value increases the risk of burning by an average factor of 2.12. Likewise, an increase of 1 in the DC fire season value decreases the risk of burning by a factor of 0.79 on average.
Forests 2016, 7, 211 12 of 23
3.2. Relative Fire Risk and Latitudinal Risk Zonation
For each transect, we defined homogeneous fire risk zones based on whether or not the predicted risk diverged from the mean fire risk of the transect (Figures2and5). Because the predicted fire risks extracted from the models are relative to each transect, relative risk values cannot be compared from one transect to another.
Forests 2016, 7, 211 12 of 23 For each transect, we defined homogeneous fire risk zones based on whether or not the predicted risk diverged from the mean fire risk of the transect (Figures 2 and 5). Because the predicted fire risks extracted from the models are relative to each transect, relative risk values cannot be compared from one transect to another.
Figure 5. Log‐Transformed predicted fire risk according to latitude for each transect. Zero represents the mean fire risk of each transect. Vertical lines separate fire risk zones where for each transect the relative fire risk differs from the mean fire risk of the transect. 95% bootstrap confidence intervals (CI95) are represented by shaded areas. CI95 were obtained after 1000 randomizations with replacement of the original dataset. The two vertical dashed lines in panel (b) delimit the non‐ representative mountainous area excluded for the calculation of fire cycles.
In transect A, the fire risk gradually increases from south to north, thus allowing two zones (north and south) to emerge. On average, the northern zone shows a fire risk 15.61 times higher than the mean risk of the transect, while the southern zone shows a risk 3.33 times lower. 95% confidence intervals (CI95) for the average relative fire risk of each zone can be found in Table A1.
Figure 5.Log-Transformed predicted fire risk according to latitude for each transect. Zero represents the mean fire risk of each transect. Vertical lines separate fire risk zones where for each transect the relative fire risk differs from the mean fire risk of the transect. 95% bootstrap confidence intervals (CI95) are represented by shaded areas. CI95 were obtained after 1000 randomizations with replacement of the original dataset. The two vertical dashed lines in panel (b) delimit the non-representative mountainous area excluded for the calculation of fire cycles.
In transect A, the fire risk gradually increases from south to north, thus allowing two zones (north and south) to emerge. On average, the northern zone shows a fire risk 15.61 times higher than the mean risk of the transect, while the southern zone shows a risk 3.33 times lower. 95% confidence intervals (CI95) for the average relative fire risk of each zone can be found in TableA1.
In transect B, the predicted fire risk increases from moderate (not significantly different from the mean fire risk of the transect) in the south to high in the north, except within the zone between
latitudes 51.707◦N and 52.105◦N (coinciding with the plateau located between the Otish Mountains to the east and the Tichegami Mountains to the west, Figure1a), where the risk abruptly drops (dashed lines in Figure5b). The fire regimes of high elevation areas are often idiosyncratic because hilltops and upperslopes can be subject to lower fire frequency [40] due to shorter fire seasons and lower temperatures. Because those mountains are not representative of the regions they cross, this section has been removed from the rest of the analyses. Transect B was divided into a southern zone with an average fire risk similar to the mean risk of the transect (1.05 times higher), and a northern zone with a fire risk 3.70 times higher than the mean risk of the transect (excluding the plateau near the Otish Mountains).
In transect C, the predicted fire risk increases stepwise from south to north. This transect was therefore split into a high risk zone in the north, with a risk 10.48 times higher than the mean risk of the transect, a moderate risk zone in the center, with a risk 1.92 times higher than the mean risk, and a low risk zone in the south, showing a risk 2.63 times lower than the mean risk.
In transect D, the fire risk increases from south to north, although the southernmost portion was highly influenced by the 1940s fire (Figure5d,e). The transect was thus split into three zones when this fire is included in the analysis, with the southernmost zone—almost exclusively inside the 1940s fire area—showing a moderate to high fire risk 3.75 times higher than the mean risk of the transect. The rest of the transect includes a high fire risk zone in the north and a low fire risk zone in the center, showing fire risks 48.14 times higher and 1.75 times lower than the mean risk of the transect, respectively. When removing the 1940s fire from the analysis, transect D2 could be split into two zones (north and south) with risks 21.30 times higher and 1.45 times lower than the mean risk of the transect, respectively. The breakpoint separating the northern and southern zones in D2 was located 4.4 km south of the northern breakpoint in D. This slight difference results from the increased mean fire risk of the transect due to the 1940s fire in transect D.
3.3. Fire Cycles
In all transects, fire cycles (Table3) calculated over the whole period are seen to lengthen from north to south. Globally, there is also a lengthening from west to east. Fire cycles were calculated over two different periods, prior to 1972 and prior to 2014, in order to check for recent changes in fire regimes. Except for zones A north and B north, the fire cycles calculated for the period before 1972 are shorter in all zones than those calculated over the whole period (prior to 2014). The temporal variability in fire activity in each transect zone (FigureA3) also shows that over the last 300 years most fire activity recorded in each transect zone occurred before 1972, except for A north and B north.
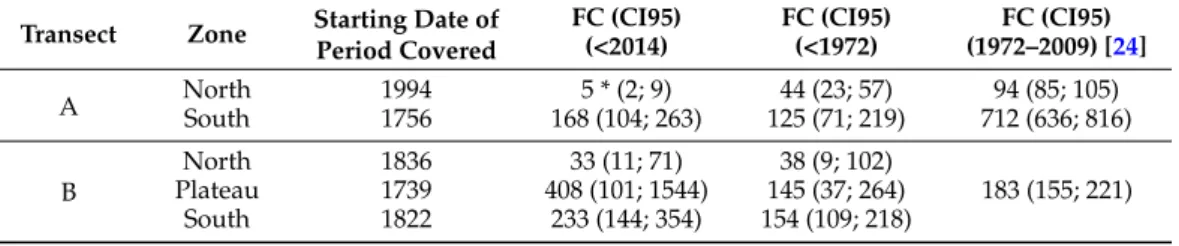
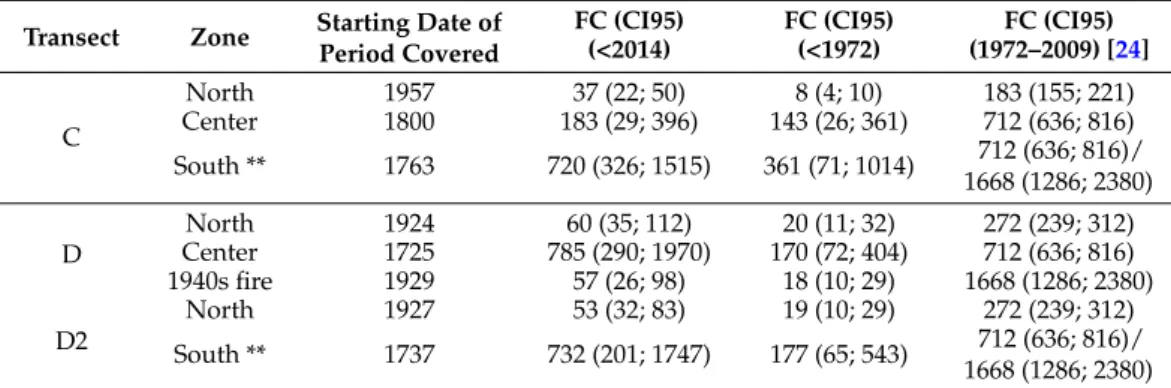
Table 3.Fire cycle (FC) of each transect zone calculated from the cumulative baseline survival function of stratified null models. For each transect zone, we assume that the FC calculated is representative of a period starting with the 10th percentile of the TSF data (i.e., from that date on, 90% of the cells in that particular transect zone were burned). The 95% bootstrap confidence interval (CI95) was obtained after 1000 randomizations with replacement of the original dataset and computation of the FC for each transect using the upper and lower percentiles. FC are calculated for the entire period (prior to 2014) and for the period prior to 1972. FC calculated over the 1972–2009 period by Gauthier et al. [24] in the corresponding regions are also given.
Transect Zone Starting Date of Period Covered
FC (CI95) FC (CI95) FC (CI95)
(<2014) (<1972) (1972–2009) [24] A NorthSouth 19941756 168 (104; 263)5 * (2; 9) 125 (71; 219)44 (23; 57) 712 (636; 816)94 (85; 105) B North 1836 33 (11; 71) 38 (9; 102) 183 (155; 221) Plateau 1739 408 (101; 1544) 145 (37; 264) South 1822 233 (144; 354) 154 (109; 218)
Forests 2016, 7, 211 14 of 23
Table 3. Cont.
Transect Zone Starting Date of Period Covered
FC (CI95) FC (CI95) FC (CI95)
(<2014) (<1972) (1972–2009) [24] C North 1957 37 (22; 50) 8 (4; 10) 183 (155; 221) Center 1800 183 (29; 396) 143 (26; 361) 712 (636; 816) South ** 1763 720 (326; 1515) 361 (71; 1014) 712 (636; 816)/ 1668 (1286; 2380) D North 1924 60 (35; 112) 20 (11; 32) 272 (239; 312) Center 1725 785 (290; 1970) 170 (72; 404) 712 (636; 816) 1940s fire 1929 57 (26; 98) 18 (10; 29) 1668 (1286; 2380) D2 North 1927 53 (32; 83) 19 (10; 29) 272 (239; 312) South ** 1737 732 (201; 1747) 177 (65; 543) 712 (636; 816)/ 1668 (1286; 2380)
*89% of the cells in this zone have a TSF of <13 years; the remaining 11% have a TSF of <40. Moreover, an important fire that occurred in 2013 burned 51% of the cells, also highly influencing the FC estimate. As large fires are common in this region, the size of the transect zone is small when taking the full variability of the fire regime of that region into account when using TSF data. We thus consider the five-years FC observed here to be highly underestimated. ** As both C South and D2 South cross two fire regions delimited by Gauthier et al. [24], two corresponding FC values are shown for each of these zones, respectively.
4. Discussion
4.1. Climate Influence on Fire Risk
The Drought Code (DC) significantly increased the fire risk in the three westernmost transects (i.e., A, B, and C) while no climate influence was detected in transect D. This result is consistent with other studies that have shown a similar effect of the DC on fire risk [16,21,47] and on the number of fires and annual area burned [48] in the Canadian boreal forest. The DC is a numeric rating of the average moisture content of deep, compact organic layers and is an indicator of seasonal droughts [45,46]. This suggests that drought conditions are partly responsible for the variability of the fire risk along the latitudinal gradient over most of our study area. However, the better model fit for transects A and C compared with transect B may indicate that climate is not the only factor influencing the fire risk. In particular, the large Mistassini Lake to the west and the Tichégami and Otish Mountains to the southern and northern zones (Figure1a), respectively, may have acted as large firebreaks. Indeed, in Quebec, prevailing winds blow predominantly from west to east. These geographical features may thus be accompanied by large fire shadows that attenuate the effect of climate in this region.
As Cox survival models from both transects D and D2 show good fits (pseudo-R2 ≥ 0.48), the negative, counterintuitive effect of the FFMC on the fire risk could reflect the influence of some bottom-up drivers. For instance, this region is known for its complex topography, from plains on the edge of St. Lawrence River to mountains toward the north [49] (Figure1a). The region is also characterized by an important variability of surficial deposits, from organic deposits and bedrock to till dominance from south to north [49]. Topography and surficial deposits are two significant factors of fire risk because they influence the drying potential of the forest floor as well as fuel composition and structure [14,18,40]. Well-drained stands are more likely to burn [18], and the slopes found in the northern portion of the transect could, for example, help with draining and thus drying the forest floor, thereby facilitating fire spread. Moreover, a limited fire ignition due to a very low occurrence of lightning strikes [50] is an additional factor that may explain the low fire activity of this region, as well as the difficulty to detect any climate effect on fire risk. When lightning strikes happen in conjunction with weather favorable to fire spread, the accumulated fuel can, therefore, allow for very large fires to occur. This control over fire activity could therefore prevail over other factors in this transect. 4.2. Fire Cycle
The computation of the fire cycle of each fire risk zone allowed the assessment of the spatiotemporal variability of fire activity within the study area. Although recent fires (after 1924) were over-represented in our transects, we trust the down-weighting applied to recently burned cells
significantly reduced this bias and allowed for the calculation of realistic fire cycles. On a broad scale, other studies have shown the same gradient of increasing fire activity from south to north [24,48] and from east to west [21,24,48,51] in eastern Canada.
On a narrower spatial scale, our fire cycle estimates are consistent with values calculated for similar regions over the same time period. In the southern zone of transect A, our fire cycle is consistent with previous estimates made in the commercial forest further south [51–53]. In the northern zone of the same transect, one of the most fire-prone regions of boreal Canada where very large fires occur at a high frequency [33,35], we estimated a fire cycle of five years. However, compared to the size of those fires, our transect zone is relatively small, meaning that individual fires can intersect a large fraction of the transect (Figure2a). In this particular region where very large fires occur, thus regularly erasing marks of older fires, a method using TSF data over a relatively short transect in order to estimate fire cycles does not appear to be well suited. In this situation, the use of archive data to compute annual area burned, or a different sampling design covering a larger area better adapted to accounting for immense fires could be used instead. Based on fire interval data for the same transect zone, Héon et al. [33] estimated a fire cycle of 42 years for the time period 1910–2013. With such a short fire cycle, shifts of vegetation from black spruce- to jack pine- dominated stands can occur in this area [54,55]. Short fire intervals are also likely to limit stand regeneration and consequently lead to an opening of the forest [55,56], possibly into lichen-woodlands [55]. However, recent studies have shown that a negative feedback between fuel availability and fire activity has strongly limited the occurrence of these short intervals during the last two centuries [33,57]. The whole landscape could nonetheless burn regardless of the fuel continuity if either the number of ignition points or the frequency of extremely severe weather events are high enough. The northern zone of transect A thus constitutes a very interesting area to monitor in the future in order to better understand how strong the forest’s resilience to high fire activity is in this boreal ecosystem [35].
Our fire cycle estimates along transect B are similar to values obtained in previous studies of the same region. Indeed, in the southern zone and in the plateau near the Otish Mountains, Mansuy et al. [18] calculated fire cycles of 205 (CI95: 128; 502) and 237 (CI95: 136; 929), respectively. Southeast of the transect, Bélisle et al. [39] also found a similar fire cycle (247 (CI95: 187; 309)) to our southern zone. Mansuy et al. [18] did estimate a longer fire cycle (129 (CI95: 86; 257)) in the region corresponding to the northern zone of our transect. However, our estimate may have been highly influenced by the most recent decades as 60% of the cells in this zone have a TSF of <14 years.
Transects C and D are both located in the North Shore region where fire cycles have been shown to lengthen on an eastward course. Previous studies have estimated fire cycles varying from 250 years around the southern and center zones of transect C [9] to between 295 (40,51,58) and 600 years [9] further east, toward transect D. Those values are in agreement with our results as they are included within the confidence intervals of our fire cycle estimates of these regions. Furthermore, our study is one of the first that analyzes the fire regime from empirical data in the area covered by the northern zones of transects C and D, thus making it difficult to compare our results with others. However, we assume our fire cycle estimates are realistic based on the overall consistency between our results and those of other studies as well as the reliability of the estimates produced by the Cox analyses [37]. 4.3. Fire Risk Zonation and Temporal Variability
Our study indicates that the fire risk increases from south to north, either gradually as in transects A, B, and D2, or stepwise as in transect C. In all transects, high and low fire risk zones could be delimited in the north and south, respectively. The localization of the breakpoints between fire risk zones is generally consistent with the regional boundaries set by Gauthier et al. [24] based on the recent fire regime (1972–2009), except for transect B which they consider to be more homogeneous.
The fire cycles estimated by Gauthier et al. [24] are longer than ours for all transect zones (Table3). Temporal variations in the fire regime can explain these differences. Indeed, our fire cycle estimates for the time period prior to 1972 are generally shorter than estimates for the entire study period, suggesting
Forests 2016, 7, 211 16 of 23
a decrease in fire activity during the last four decades. Similar shifts were previously observed in Quebec around the middle of the 20th century, thus f the decrease in fire activity experienced since the end of the Little Ice Age that occurred around 1850 [51,58,59]. Moreover, previous studies targeting the fire activity of the last 150–300 years (e.g., [9,18,39,40,53]) have estimated fire cycles similar to ours. In the northern zone of transect A however, the difference between our estimates and the ones calculated by Gauthier et al. [24] seems to results from the most recent years (i.e., after 2009) when most of this zone was burned (FigureA3). This is consistent with previous studies showing that fire activity has been increasing since 1980 in this area [35].
All indices of the FWI, particularly the DC, are expected to increase in the future in response to climate change [60,61]. During the last few decades, the northern zone of transect A, which is the driest sector of the study area, has experienced very high fire activity (Figure2a and FigureA3). With climate change, this phenomenon could propagate over the whole study area, leading to a large scale increase of fire activity in the near future [48], possibly returning to the fire regime levels of the last 150–300 years.
The relative stability of fire zone boundaries in the past may have resulted either from top-down or bottom-up processes. The climatic zonation may have remained somewhat constant with proportional changes among regions. Alternatively, bottom-up factors, such as fuel availability or surficial deposits, may have determined the observed spatial variability. As these factors are spatially stationary, they could account for the inertia of the limit between fire risk zones regardless of any changes in climate, provided that future fire risks remain in the range of past ones. In both cases, this could suggest that if climate and fire regimes are predicted to change in the future, the limits between fire risk zones might remain stable. This has great implications for forest management planners, as if they have to adjust for future changes in fire activity they will nonetheless be able to rely on the stability of their management unit layout in regards to fires. However, this should be accepted with caution as Boulanger et al. [48] have shown that in the future slight changes in fire regions could occur based on the projected area burned and the number of fires.
5. Conclusions
Considered as a whole, the latitudinal breakpoints separating our fire risk zones are largely consistent with the recent evaluation of the northern limit of the commercial forest. This limit has been drawn across the coniferous boreal forest of Quebec to delineate the more opened forests to the north from the tall and dense forests that are suitable for forest management to the south [23,62]. As there is a direct link between high fire activity and the opening of forests [26–29], as we have shown that fire risk appears to be higher in the northern zones over the last 150–300 years, and as these zones have been relatively stable through time, it seems reasonable to conclude that the limit between open and closed forests has also been somewhat stable. If the expected climate change leads to a fire activity level that remains in the same range of variability as the last 150–300 years, which Girardin et al. [63] consider a plausible scenario, this limit may also remain stable in the future. Indeed, boreal forests south of the northern limit of the commercial forest seem to be well-adapted to large changes in fire activity [63,64]. However, if fire activity increases beyond its range of variability in the south, dense forests could start opening [2,56] and thus eventually change the location of the limit.
Acknowledgments:We are grateful to André Robitaille (MFFP), Alain Tremblay (Hydro-Québec), and Danielle Charron (UQAM) for their help with field logistic. We thank Mélanie Desrochers (CFR), Aurélie Terrier (UQAM), Annie Claude Bélisle (UQAT), and Dominic Cyr (CFS) for their valuable technical advices. We heartily thank Sylvain Larouche, Alix Daguzan, Dave Gervais, Aurélie Terrier, and Joannie Hébert for their assistance in the field and Evick Mestre in the lab. We finally thank two anonymous reviewers for their helpful comments on an earlier version of the paper.
We also acknowledge the MFFP for providing us with forest inventory and fire archive data. This work was supported by a Natural Sciences and Engineering Research Council of Canada strategic partnership grant awarded to Y.B. and S.G. and by a Mitacs Accelerate grant awarded to J.P. in partnership with Hydro-Quebec.
Author Contributions:J.P., S.G., and Y.B. conceived and designed the study; J.P. and D.A. provided TSF data; J.P., S.G., and A.L. performed the statistical analyses; J.P., S.G., A.L., and Y.B. interpreted the results; J.P. wrote the paper and all authors revised it.
Conflicts of Interest:The authors declare no conflict of interest. Abbreviations
The following abbreviations are used in this manuscript: AIC Akaike Information Criterion
BUI Buildup Index CI Confidence Interval
DC Drought Code
DMC Duff Moisture Code
FC Fire Cycle
FFMC Fine Fuel Moisture Code FWI Fire Weather Index ISI Initial Spread Index
MFFP Ministère des Forêts, de la Faune et des Parcs (Québec) TSF Time Since Fire
Appendix A
1
Figure A1.Map of the study area showing the four transects being analyzed, along with the recent fires from 1924 to 2014. The northern limit of the commercial forest in Quebec is also shown.
Forests 2016, 7, 211Forests 2016, 7, 211 18 of 23 18 of 23
Figure A2. Decadal frequency distribution of TSF for each transect. No weights are applied to cells
where a fire occurred between 1924 and 2014. The proportion of right‐censored data (minimum TSF) and real TSF are shown in grey and black, respectively.
Figure A2.Decadal frequency distribution of TSF for each transect. No weights are applied to cells where a fire occurred between 1924 and 2014. The proportion of right-censored data (minimum TSF) and real TSF are shown in grey and black, respectively.
Figure A3. Reverse weighted cumulative proportion of cells that burned per decade in each transect
zone. Weights are calculated in the same way that they were in the survival analyses in order to compensate for the over‐representation of recent fires (after 1924) in transects. The shaded area shows the 1972–2009 period covered by the fire cycle estimates calculated by Gauthier et al. [24]. Table A1. Mean relative fire risk of transect zones compared to mean risk of the transect with 95% bootstrap confidence intervals (CI95) (e.g., zone north of transect A has a risk 15.61 times higher than the mean risk of the transect, while zone south of the same transect has a risk 3.33 times lower or equals to 0.30 times the mean risk of the transect). Relative fire risk values take into account the down‐ weighting of recently burned cells.
Figure A3.Reverse weighted cumulative proportion of cells that burned per decade in each transect zone. Weights are calculated in the same way that they were in the survival analyses in order to compensate for the over-representation of recent fires (after 1924) in transects. The shaded area shows the 1972–2009 period covered by the fire cycle estimates calculated by Gauthier et al. [24].
Forests 2016, 7, 211 20 of 23
Table A1. Mean relative fire risk of transect zones compared to mean risk of the transect with 95% bootstrap confidence intervals (CI95) (e.g., zone north of transect A has a risk 15.61 times higher than the mean risk of the transect, while zone south of the same transect has a risk 3.33 times lower or equals to 0.30 times the mean risk of the transect). Relative fire risk values take into account the down-weighting of recently burned cells.
Transect Zone Mean Relative Risk CI95
A NorthSouth 0.30 (15.61−3.33) (7.96; 34.91)(0.18; 0.47) B North 3.70 (2.16; 6.76) Plateau 0.33 (−3.03) (0.18; 0.59) South 1.05 (0.75; 1.56) C North 10.48 (5.29; 24.09) Center 1.92 (1.00; 4.09) South 0.38 (−2.63) (0.19; 0.70) D NorthSouth 0.57 (48.14−1.75) (14.66; 306.15)(0.29; 1.06) 1940s fire 3.75 (1.59; 11.64) D2 NorthSouth 0.69 (21.30−1.45) (8.40; 98.19)(0.43; 1.16) References
1. Johnson, E.A. Fire and Vegetation Dynamics: Studies from the North American Boreal Forest; Cambridge: Cambridge, UK, 1992.
2. Payette, S. Fire as a controlling process in the North American boreal forest. In A System Analysis of the Global Boreal Forest; Shugart, H.H., Leemans, R., Bonan, G.B., Eds.; Cambridge University Press: Cambridge, UK, 1992; pp. 144–169.
3. Gauthier, S.; Leduc, A.; Bergeron, Y. Forest dynamics modelling under natural fire cycles: A tool to define natural mosaic diversity for forest management. Environ. Monit. Assess. 1996, 39, 417–434. [CrossRef] [PubMed]
4. Johnson, E.A.; Miyanishi, K.; Weir, J.M.H. Wildfires in the western Canadian boreal forest: Landscape patterns and ecosystem management. J. Veg. Sci. 1998, 9, 603–610. [CrossRef]
5. Johnson, E.A.; Gutsell, S.L. Fire frequency models, methods and interpretations. Adv. Ecol. Res. 1994, 25, 239–287.
6. Li, C. Estimation of fire frequency and fire cycle: A computational perspective. Ecol. Modell. 2002, 154, 103–120. [CrossRef]
7. Van Wagner, C.E. Age-Class distribution and the forest fire cycle. Can. J. For. Res. 1978, 8, 220–227. [CrossRef] 8. Cyr, D.; Gauthier, S.; Bergeron, Y.; Carcaillet, C. Forest management is driving the eastern North American
boreal forest outside its natural range of variability. Front. Ecol. Environ. 2009, 7, 519–524. [CrossRef] 9. Bouchard, M.; Pothier, D.; Gauthier, S. Fire return intervals and tree species succession in the North Shore
region of eastern Quebec. Can. J. For. Res. 2008, 38, 1621–1633. [CrossRef]
10. Gauthier, S.; De Grandpré, L.; Bergeron, Y. Differences in forest composition in two boreal forest ecoregions of Quebec. J. Veg. Sci. 2000, 11, 781–790. [CrossRef]
11. Girard, F.; Payette, S.; Gagnon, R. Origin of the lichen-spruce woodland in the closed-crown forest zone of eastern Canada. Glob. Ecol. Biogeogr. 2009, 18, 291–303. [CrossRef]
12. Senici, D.; Chen, H.Y.H.; Bergeron, Y.; Cyr, D. Spatiotemporal variations of fire frequency in central boreal forest. Ecosystems 2010, 13, 1227–1238. [CrossRef]
13. Parisien, M.-A.; Parks, S.A.; Miller, C.; Krawchuk, M.A.; Heathcott, M.; Moritz, M.A. Contributions of ignitions, fuels, and weather to the spatial patterns of burn probability of a boreal landscape. Ecosystems 2011, 14, 1141–1155. [CrossRef]
14. Bélisle, A.; Leduc, A.; Gauthier, S.; Desrochers, M.; Mansuy, N.; Morin, H.; Bergeron, Y. Detecting local drivers of fire cycle heterogeneity in boreal forests: A scale issue. Forests 2016, 7, 1–21. [CrossRef]
15. Flannigan, M.D.; Harrington, J.B. A study of the relation of meteorological variables to monthly provincial area burned by wildfire in Canada (1953–80). J. Appl. Meteorol. 1988, 27, 441–452. [CrossRef]
16. Girardin, M.P.; Wotton, B.M. Summer moisture and wildfire risks across Canada. J. Appl. Meteorol. Climatol. 2009, 48, 517–533. [CrossRef]
17. Van Wagner, C.E. Effect of slope on fires spreading downhill. Can. J. For. Res. 1988, 18, 818–820. [CrossRef] 18. Mansuy, N.; Gauthier, S.; Robitaille, A.; Bergeron, Y. The effects of surficial deposit-drainage combinations
on spatial variations of fire cycles in the boreal forest of eastern Canada. Int. J. Wildl. Fire 2010, 19, 1083–1098. [CrossRef]
19. Hély, C.; Fortin, C.M.-J.; Anderson, K.R.; Bergeron, Y. Landscape composition influences local pattern of fire size in the eastern Canadian boreal forest: Role of weather and landscape mosaic on fire size distribution in mixedwood boreal forest using the Prescribed Fire Analysis System. Int. J. Wildl. Fire 2010, 19, 1099–1109. [CrossRef]
20. Ali, A.A.; Carcaillet, C.; Bergeron, Y. Long-Term fire frequency variability in the eastern Canadian boreal forest: The influences of climate vs. local factors. Glob. Chang. Biol. 2009, 15, 1230–1241. [CrossRef]
21. Girardin, M.P.; Tardif, J.C.; Flannigan, M.D.; Bergeron, Y. Forest fire-conducive drought variability in the southern Canadian boreal forest and associated climatology inferred from tree rings. Can. Water Resour. J. 2006, 31, 275–296. [CrossRef]
22. Girardin, M.P.; Tardif, J.; Flannigan, M.D.; Wotton, B.M.; Bergeron, Y. Trends and periodicities in the Canadian Drought Code and their relationships with atmospheric circulation for the southern Canadian boreal forest. Can. J. For. Res. 2004, 34, 103–119. [CrossRef]
23. Jobidon, R.; Bergeron, Y.; Robitaille, A.; Raulier, F.; Gauthier, S.; Imbeau, L.; Saucier, J.-P.; Boudreault, C. A biophysical approach to delineate a northern limit to commercial forestry: The case of Quebec’s boreal forest. Can. J. For. Res. 2015, 45, 515–528. [CrossRef]
24. Gauthier, S.; Raulier, F.; Ouzennou, H.; Saucier, J.-P. Strategic analysis of forest vulnerability to risk related to fire: An example from the coniferous boreal forest of Quebec. Can. J. For. Res. 2015, 45, 553–565. [CrossRef] 25. Sirois, L. Spatiotemporal variation in black spruce cone and seed crops along a boreal forest-tree line transect.
Can. J. Bot. 2000, 30, 900–909. [CrossRef]
26. Jasinki, J.P.P.; Payette, S. The creation of alternative stable states in the southern boreal forest, Québec, Canada. Ecol. Monogr. 2005, 75, 561–583. [CrossRef]
27. Payette, S.; Bhiry, N.; Delwaide, A.; Simard, M. Origin of the lichen woodland at its southern range limit in eastern Canada: The catastrophic impact of insect defoliators and fire on the spruce-moss forest. Can. J. For. Res. 2000, 30, 288–305. [CrossRef]
28. Girard, F.; Payette, S.; Gagnon, R. Rapid expansion of lichen woodlands within the closed-crown boreal forest zone over the last 50 years caused by stand disturbances in eastern Canada. J. Biogeogr. 2008, 35, 529–537. [CrossRef]
29. Jayen, K.; Leduc, A.; Bergeron, Y. Effect of fire severity on regeneration success in the boreal forest of northwest Québec, Canada. Ecoscience 2006, 13, 143–151. [CrossRef]
30. Arseneault, D. Impact of fire behavior on postfire forest development in a homogeneous boreal landscape. Can. J. For. Res. 2001, 31, 1367–1374. [CrossRef]
31. IPCC Climate Change 2014. Synthesis Report: Contribution of Working Groups I, II and III to the Fifth Assessment Report of the Intergovernmental Panel on Climate Change; Core Writing Team, Pachauri, R.K., Meyer, L.A., Eds.; IPCC: Geneva, Switzerland, 2014.
32. Flannigan, M.D.; Logan, K.A.; Amiro, B.D.; Skinner, W.R.; Stocks, B.J. Future area burned in Canada. Clim. Change 2005, 72, 1–16. [CrossRef]
33. Héon, J.; Arseneault, D.; Parisien, M.-A. Resistance of the boreal forest to high burn rates. Proc. Natl. Acad. Sci. USA 2014, 111, 13888–13893. [CrossRef] [PubMed]
34. Beaudoin, A.; Bernier, P.Y.; Guindon, L.; Villemaire, P.; Guo, X.J.; Stinson, G.; Bergeron, T.; Magnussen, S.; Hall, R.J. Mapping attributes of Canada’s forests at moderate resolution through kNN and MODIS imagery. Can. J. For. Res. 2014, 44, 521–532. [CrossRef]
35. Erni, S.; Arseneault, D.; Parisien, M.-A.; Bégin, Y. Spatial and temporal dimensions of fire activity in the fire-prone eastern Canadian taiga. Glob. Chang. Biol. 2016. [CrossRef] [PubMed]
36. Régnière, J.; Saint-Amant, R. BioSIM 9-User’s Manual, Information Report LAU-X-134; Natural Resources Canada: Quebec, Canada, 2008.
Forests 2016, 7, 211 22 of 23
37. Cyr, D.; Gauthier, S.; Boulanger, Y.; Bergeron, Y. Quantifying fire cycle from dendroecological records using survival analyses. Forests 2016, 7, 1–21. [CrossRef]
38. Cox, D.R. Regression models and life-tables. J. R. Stat. Soc. Ser. B 1972, 34, 187–220.
39. Bélisle, A.C.; Gauthier, S.; Cyr, D.; Bergeron, Y.; Morin, H. Fire regime and old-growth boreal forests in central Quebec, Canada: An ecosystem management perspective. Silva Fenn. 2011, 45, 889–908. [CrossRef] 40. Cyr, D.; Gauthier, S.; Bergeron, Y. Scale-Dependent determinants of heterogeneity in fire frequency in a
coniferous boreal forest of eastern Canada. Landsc. Ecol. 2007, 22, 1325–1339. [CrossRef]
41. Therneau, T.M. Package “Survival”. Available online: https://cran.r-project.org/web/packages/survival/ survival.pdf (accessed on 12 July 2016).
42. Symonds, M.R.E.; Moussalli, A. A brief guide to model selection, multimodel inference and model averaging in behavioural ecology using Akaike’s information criterion. Behav. Ecol. Sociobiol. 2011, 65, 13–21. [CrossRef] 43. Richards, S.A. Testing ecological theory using the information-theoretic approach: Examples and cautionary
results. Ecology 2005, 86, 2805–2814. [CrossRef]
44. Burnham, K.P.; Anderson, D.R. Model Selection and Multimodel Inference: A Practical Information-Theoretic Approach, 2nd ed.; Springer: New York, NY, USA, 2002.
45. Amiro, B.D.; Logan, K.A.; Wotton, B.M.; Flannigan, M.D.; Todd, J.B.; Stocks, B.J.; Martell, D.L. Fire weather index system components for large fires in the Canadian boreal forest. Int. J. Wildl. Fire 2004, 13, 391–400. [CrossRef]
46. Van Wagner, C.E. Development and Structure of the Canadian Forest Fire Weather Index System; Canadian Forestry Service: Ottawa, Canada, 1987.
47. Girardin, M.P.; Ali, A.A.; Carcaillet, C.; Mudelsee, M.; Drobyshev, I.; Hély, C.; Bergeron, Y. Heterogeneous response of circumboreal wildfire risk to climate change since the early 1900s. Glob. Chang. Biol. 2009, 15, 2751–2769. [CrossRef]
48. Boulanger, Y.; Gauthier, S.; Gray, D.R.; Le Goff, H.; Lefort, P.; Morissette, J. Fire regime zonation under current and future climate over eastern Canada. Ecol. Appl. 2013, 23, 904–923. [CrossRef] [PubMed] 49. Robitaille, A.; Saucier, J.-P.; Chabot, M.; Côté, D.; Boudreault, C. An approach for assessing suitability for
forest management based on constraints of the physical environment at a regional scale. Can. J. For. Res. 2015, 45, 529–539. [CrossRef]
50. Morissette, J.; Gauthier, S. Study of cloud-to-ground lightning in Quebec: 1996–2005. Atmosphere-Ocean 2008, 46, 443–454. [CrossRef]
51. Bergeron, Y.; Cyr, D.; Drever, C.R.; Flannigan, M.; Gauthier, S.; Kneeshaw, D.; Lauzon, È.; Leduc, A.; Le Goff, H.; Lesieur, D.; et al. Past, current, and future fire frequencies in Quebec’s commercial forests: Implications for the cumulative effects of harvesting and fire on age-class structure and natural disturbance-based management. Can. J. For. Res. 2006, 36, 2737–2744. [CrossRef]
52. Bergeron, Y.; Gauthier, S.; Kafka, V.; Lefort, P.; Lesieur, D. Natural fire frequency for the eastern Canadian boreal forest: Consequences for sustainable forestry. Can. J. For. Res. 2001, 31, 384–391. [CrossRef]
53. Bergeron, Y.; Gauthier, S.; Flannigan, M.; Kafka, V. Fire regimes at the transition between mixedwood and coniferous boreal forest in northwestern Quebec. Ecology 2004, 85, 1916–1932. [CrossRef]
54. Le Goff, H.; Sirois, L. Black spruce and jack pine dynamics simulated under varying fire cycles in the northern boreal forest of Quebec, Canada. Can. J. For. Res. 2004, 34, 2399–2409. [CrossRef]
55. Lavoie, L.; Sirois, L. Vegetation changes caused by recent fires in the northern boreal forest of eastern Canada. J. Veg. Sci. 1998, 9, 483–492. [CrossRef]
56. Brown, C.D.; Johnstone, J.F. Once burned, twice shy: Repeat fires reduce seed availability and alter substrate constraints on Picea mariana regeneration. For. Ecol. Manag. 2012, 266, 34–41. [CrossRef]
57. Parisien, M.-A.; Parks, S.A.; Krawchuk, M.A.; Little, J.M.; Flannigan, M.D.; Gowman, L.M.; Moritz, M.A. An analysis of controls on fire activity in boreal Canada: Comparing models built with different temporal resolutions. Ecol. Appl. 2014, 24, 1341–1356. [CrossRef]
58. Gauthier, S.; Leduc, A.; Bergeron, Y.; Le Goff, H. La fréquence des feux et l’aménagement forestier inspiré des perturbations naturelles. In Aménagement Écosystémique en Forêt Boréale; Gauthier, S., Vaillancourt, M.-A., Leduc, A., De Grandpré, L., Kneeshaw, D.D., Morin, H., Drapeau, P., Bergeron, Y., Eds.; Presses de l’Université du Québec: Québec, QC, Canada, 2009; pp. 61–78. (In French)
59. Le Goff, H.; Flannigan, M.D.; Bergeron, Y.; Girardin, M.P. Historical fire regime shifts related to climate teleconnections in the Waswanipi area, central Quebec, Canada. Int. J. Wildl. Fire 2007, 16, 607–618. [CrossRef]
60. Wang, X.; Thompson, D.K.; Marshall, G.A.; Tymstra, C.; Carr, R.; Flannigan, M.D. Increasing frequency of extreme fire weather in Canada with climate change. Clim. Chang. 2015, 130, 573–586. [CrossRef]
61. Flannigan, M.D.; Wotton, B.M.; Marshall, G.A.; de Groot, W.J.; Johnston, J.; Jurko, N.; Cantin, A.S. Fuel moisture sensitivity to temperature and precipitation: Climate change implications. Clim. Chang. 2016, 134, 59–71. [CrossRef]
62. Ministère des Ressources Naturelles du Québec. Rapport du Comité Scientifique Chargé d’Examiner la Limite Nordique Des Forêts Attribuables; Gouvernement du Québec Secteur des Forêts: Québec, Canada, 2013. (In French)
63. Girardin, M.P.; Ali, A.A.; Carcaillet, C.; Gauthier, S.; Hély, C.; Le Goff, H.; Terrier, A.; Bergeron, Y. Fire in managed forests of eastern Canada: Risks and options. For. Ecol. Manag. 2013, 294, 238–249. [CrossRef] 64. Bergeron, Y.; Cyr, D.; Girardin, M.P.; Carcaillet, C. Will climate change drive 21st century burn rates in
Canadian boreal forest outside of its natural variability: Collating global climate model experiments with sedimentary charcoal data. Int. J. Wildl. Fire 2010, 19, 1127–1139. [CrossRef]
© 2016 by the authors; licensee MDPI, Basel, Switzerland. This article is an open access article distributed under the terms and conditions of the Creative Commons Attribution (CC-BY) license (http://creativecommons.org/licenses/by/4.0/).