Abstract
Large areas of mine tailings are reclaimed by applying organic amendments such as paper mill sludge (PMS). Although mining industries can use PMS freshly generated by paper mills, operational constraints on paper industries make temporary landfilling of this material an unavoidable alternative for the paper industries, creating the most prominent PMS source for mining industries. This study aimed to quantify soil greenhouse gas (GHG) emissions (N2O, CO2, and CH4) after application of landfilled PMS (LPMS; i.e., excavated from a landfill site at a paper mill) and LPMS combined with a seeding treatment of white clover (Trifolium
repens L.) on nonacidic mine tailings site prior to reforestation.
Soil N2O, CO2, and CH4 fluxes were measured after applications of 50 and 100 Mg dry LPMS ha−1 during two consecutive
snow-free seasons on two adjacent sites; LPMS was applied once in the first season. The LPMS application increased N2O emissions (7.6 to 34.7 kg N2O-N ha−1, comprising 1.04 to 2.43% of applied N)
compared with the unamended control during the first season; these emissions were negligible during the second season. The LPMS application increased CO2 emissions (~5800 to 11,400 kg CO2–C ha−1, comprising 7 to 27% of applied C) compared with
the unamended control on both sites and in both seasons. Fluxes of CH4 were negligible. White clover combined with LPMS treatments did not affect soil GHG emissions. These new GHG emission factors should be integrated into life-cycle analyses to evaluate the C footprint of potential symbioses between the mining and paper industries. Future research should focus on the effect of PMS applications on soil GHG emissions from a variety of mine tailings under various management practices and climatic conditions to plan responsible and sustainable land reclamation.
Greenhouse Gas Emissions after Application of Landfilled Paper Mill
Sludge for Land Reclamation of a Nonacidic Mine Tailings Site
Patrick Faubert,* Simon Durocher, Normand Bertrand, Rock Ouimet, Philippe Rochette, Pascal Tremblay, Jean-François Boucher, and Claude Villeneuve
T
he mining industry is responsible for restoring andreclaiming extensive areas of land degraded by the tailings produced by underground mining. Mine tail-ings can be reclaimed by importing topsoil, but this practice is often expensive. Alternatively, land can also be reclaimed using organic amendments such as paper mill sludge (PMS; Larney and Angers, 2012). Paper mill sludge is the main organic resi-due generated by wastewater treatments in the pulp and paper industry. Application of PMS on degraded lands has been shown to have positive impacts on several soil characteristics, such as organic matter content, microorganism activity, aggre-gate formation, water-holding capacity, and nutrient availability (Fierro et al., 1999; Piearce et al., 2003; Camberato et al., 2006; Shipitalo and Bonta, 2008; Larney and Angers, 2012; Faubert et al., 2016). Mining industries can use PMS freshly generated by pulp and paper mills, but operational constraints such as winter conditions, hauling distances, and the timing mismatch between PMS production (daily) and land application for rec-lamation purposes (yearly) make temporary landfilling of PMS both an unavoidable practice for pulp and paper industries and the most prominent PMS source for mining industries. In this industrial symbiosis, landfilled PMS (LPMS) from the pulp and paper industry becomes a valuable resource for the mining indus-try for the reclamation of mine tailings. However, greenhouse gas (GHG) emissions from LPMS (i.e., PMS excavated from a landfill site at a paper mill) applied to reclaim mine tailings are unknown (Larney and Angers, 2012). Therefore, a responsible PMS management plan regarding its global impact on climate change (Faubert et al., 2016) is needed, as both industries are subject to GHG inventories in the jurisdiction where the present study was conducted (the province of Quebec, Canada).
The land application of organic amendments modifies soil GHG fluxes (Thangarajan et al., 2013). Nitrous oxide (N2O) is mostly produced in amended soils by nitrification and denitri-fication processes (Thangarajan et al., 2013). Availabilities of N
Abbreviations: GHG, greenhouse gas; LPMS, landfilled paper mill sludge; LPMS-IEF, landfilled paper mill sludge-induced emission factor; PMS, paper mill sludge; S1, Site 1; S2, Site 2; VWC, volumetric water content.
P. Faubert, S. Durocher, and C. Villeneuve, Chaire en éco-conseil, Dép. des sciences fondamentales, Univ. du Québec à Chicoutimi, 555 boulevard de l’Université, Chicoutimi, QC, Canada, G7H 2B1; N. Bertrand, and P. Rochette, Agriculture and Agri-Food Canada, Quebec Research and Development Centre, 2560 Hochelaga Blvd., Québec, QC, Canada, G1V 2J3; R. Ouimet, Ministère des Forêts, de la Faune et des Parcs, Direction de la recherche forestière, Complexe scientifique, 2700 Einstein St., Québec, QC, Canada, G1P 3W8; P. Tremblay and J.-F. Boucher, Dép. des sciences fondamentales, Univ. du Québec à Chicoutimi, 555 boulevard de l’Université, Chicoutimi, QC, Canada, G7H 2B1. P. Faubert and S. Durocher contributed equally to this work. Assigned to Associate Editor Claudia Wagner-Riddle.
Copyright © American Society of Agronomy, Crop Science Society of America, and Soil Science Society of America. 5585 Guilford Rd., Madison, WI 53711 USA. All rights reserved.
J. Environ. Qual. 46:950–960 (2017) doi:10.2134/jeq2017.03.0119
This is an open access article distributed under the terms of the CC BY-NC-ND license (http://creativecommons.org/licenses/by-nc-nd/4.0/)
Received 22 Mar. 2017. Accepted 25 June 2017.
*Corresponding author (patrick1_faubert@uqac.ca).
Journal of Environmental Quality
ATMOSPHERIC POLLUTANTS ANd TRACE GASES
TECHNICAL REPORTS
Core Ideas
• Applied PMS for mine tailings reclamation affected GHG emis-sions.
• PMS application increased N2O and CO2 emissions, whereas CH4 fluxes were negligible.
• White clover combined with PMS treatments did not affect soil GHG emissions.
• Mine and paper industries can integrate these GHG emissions into industrial symbioses.
and C often control the rate of these reactions (Bouwman et al., 2002). In C-poor soils, denitrification is limited by C availability (Chantigny et al., 2010; Pelster et al., 2012) and is usually stimu-lated by the addition of organic amendments (Loro et al., 1997; Mogge et al., 1999; Tenuta et al., 2000; Dambreville et al., 2006a, 2006b) such as PMS (Baggs et al., 2002; Chantigny et al., 2013). In contrast, lower emissions from soils receiving deinking PMS (C/N ratios of 61–71) than from an unamended control have been attributed to soil N immobilization during amendment decomposition (Chantigny et al., 2013).
The decomposition of land-applied organic amendments increases carbon dioxide (CO2) emissions from soils (Thangarajan
et al., 2013). The large amounts of PMS-organic C are known to influence several active soil C pools (Chantigny et al., 1999) and to increase microbial biomass and activity rate (Chantigny et al., 2000). Although several examples are known, using a variety of methods, where organic amendments stimulate GHG emissions (Boeckx and Van Cleemput, 1996; Chantigny et al., 1999; Fierro et al., 2000; Rochette et al., 2000a; Thangarajan et al., 2013; Oliveira et al., 2017), there is no known report on the in situ monitoring of soil-surface CO2 emissions to assess the decomposition rate of PMS
in reclaimed soils. Decomposition of organic matter at low redox potentials also produces methane (CH4), large emissions of which
have been reported after the addition of organic amendments to saturated soils (Boeckx and Van Cleemput, 1996). In contrast, dis-turbance of well-aerated soils has resulted in decreased oxidation of atmospheric CH4 by methanotrophs (Hansen et al., 1993). The
addition of LPMS to C-poor mine tailings mixed with C-rich top-soil could therefore have positive or negative impacts on the contri-bution of CH4 net emissions to the soil GHG balance. However,
no study has reported CH4 emissions relative to the application of
LPMS on reclaimed and degraded soil such as nonacidic mine tail-ings (Larney and Angers, 2012; Faubert et al., 2016).
The Intergovernmental Panel on Climate Change (IPCC) ruled on a default emission factor of 1% of N added in the form of mineral or organic fertilizer on agricultural soils that is emitted as N2O-N (Eggleston et al., 2006). No emission factor has been
rec-ommended so far for N applications on reclaimed lands to favor the establishment and growth of vegetation (Larney and Angers, 2012; Faubert et al., 2016). Policymakers, the mining industry, and the pulp and paper industry need to know LPMS-induced emission factors (LPMS-IEF), as there is a potential demand for LPMS amendments to reclaim mine tailings. For instance, in the province of Quebec, ~12,000 ha of degraded lands (on 322 mine sites) potentially need to be restored and reclaimed after mining activities (MERN, 2017), creating a substantial demand for LPMS amendments. In this jurisdiction, 25% of the annual PMS produc-tion of 1.3 Tg is currently landfilled; this practice will be banned by the provincial government by 2020 in favor of land application, which has been promoted as an alternative to landfilling (MDDEP, 2011; Gouvernement du Québec, 2012; MDDELCC, 2016). In this study, it is expected that LPMS application will increase N2O
and CO2 emissions as a consequence of the increased mineral N
(NO3 and NH4) and C availability, favoring denitrification,
nitri-fication, and soil respiration in the C-poor study soil (Chantigny et al., 2010; Pelster et al., 2012; Oliveira et al., 2017). The CH4
emissions are expected to be negligible after LPMS application on this well-drained soil (Le Mer and Roger, 2001; Thangarajan et al., 2013), possibly favoring methanotrophy.
This study aimed (i) to quantify the soil GHG emissions (N2O, CO2, and CH4) after a single application of LPMS and
LPMS combined with a seeding treatment of white clover (Trifolium repens L.) on a nonacidic mine tailings site prior to
reforestation during two consecutive snow-free seasons on two adjacent sites, and (ii) to provide field-measured LPMS-IEFs, which could decrease the uncertainty related to the GHG emis-sions associated with this practice (Larney and Angers, 2012; Faubert et al., 2016). White clover was selected because it is used as a perennial soil cover for site preparation prior to reclamation by reforestation on these tailings.
Materials and Methods
Study Site and Experimental Design
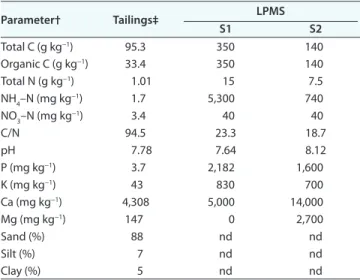
The study was conducted on a nonacidic tailings impound-ment facility located on a private underground mine property (Niobec, Saint-Honoré, QC, Canada; 48°32¢ N, 71°08¢ W). Mining activities started in 1975, and the mine tailings site has a total area of 62 ha. The area on which the tailings site was installed at the beginning of mining activities was first prepared by harvesting trees and removing the forest floor, which was stored on the mine site. Once a tailings area had reached its full height capacity, the forest floor removed in the past was used to cover the surface to limit spreading of the tailings particles in the surrounding environment through wind dispersion. Although forest floor materials covered the tailings, a natural mixing occurred over time with tailings from neighboring active sites. Thus, the soil is classified as a Technosol (IUSS Working Group, 2015) made from calcareous tailings (150–180 mm) covered and naturally mixed with endemic forest floor (Table 1).
The experimental sites were installed on a portion of the tail-ings site that was previously plowed with a rotary tiller (0- to 20-cm depth). The portion was divided into two adjacent experi-mental sites (S1 and S2), each covering a 625-m2 area. The
exper-imental design on each site included three LPMS treatments Table 1. Physical and chemical characteristics of the nonacidic mine tailings on the experimental sites (S1 and S2, top 30 cm) and landfilled paper mill sludge (LPMS) applied during the first year of the experiment. Parameter† Tailings‡ LPMS S1 S2 Total C (g kg−1) 95.3 350 140 Organic C (g kg−1) 33.4 350 140 Total N (g kg−1) 1.01 15 7.5 NH4–N (mg kg−1) 1.7 5,300 740 NO3–N (mg kg−1) 3.4 40 40 C/N 94.5 23.3 18.7 pH 7.78 7.64 8.12 P (mg kg−1) 3.7 2,182 1,600 K (mg kg−1) 43 830 700 Ca (mg kg−1) 4,308 5,000 14,000 Mg (mg kg−1) 147 0 2,700 Sand (%) 88 nd nd Silt (%) 7 nd nd Clay (%) 5 nd nd
†All values are expressed on a dry matter basis; nd, not determined; NO3–N is the concentration of (NO2+NO3)-N for the tailings. ‡ Mixture of calcareous tailings covered and naturally mixed with
and two seeding treatments of white clover, replicated in three blocks and organized in a full factorial randomized complete block design with 18 experimental plots (2 ´ 2 m each) per site. The LPMS treatments consisted of targeted application rates of 0, 50, or 100 Mg dry LPMS ha−1 (Table 2). The seeding
treat-ments of white clover consisted of absence and presence at rates of 0 and 12 kg ha−1, respectively. This plant species was selected
prior to reclamation of the site on these tailings for the following reasons: (i) to limit dust transport by wind, (ii) to control the competition of other undesired plant species, (iii) to avoid light competition with tree seedlings for reforestation due clover’s low height, and (iv) to fix atmospheric N2 in the soil through clover’s
root nodules. Buffer strips of 2.5 and 5 m were inserted between each plot and block, respectively.
The LPMS was excavated from a landfill site at a nearby (25.9 km) paper mill (Resolute Forest Products, Jonquière, QC, Canada; 48°25¢ N, 71°14¢ W). The S1 was set up on 9 to 10 July 2012 and used excavated LPMS transported to the site on 5 July 2012. The S2 was established on 4 to 5 July 2013 and used exca-vated LPMS that was transported to the site on 4 July 2013. On both sites, the LPMS was manually incorporated into the soil at a 10-cm depth, using a digging fork and a hand rake for surface leveling, to mimic the operational application of LPMS during reclamation on this site. White clover was seeded by hand on 17 July 2012 and 9 July 2013 for S1 and S2, respectively.
LPMS Characteristics
The LPMS consisted of mixed primary and secondary sludge generated from thermomechanical pulp and paper manufacturing processes and landfilled for ~1 yr (Tables 1 and 2). The excavated sludge was sampled (composite subsampling) for characterization on 6 July 2012 (S1) and 5 July 2013 (S2). Dry matter content was measured by oven drying at 105°C to a constant weight (Sheppard and Addison, 2008). The mineral N concentration was measured by extraction with 2 mol L−1 KCl (1:10, ratio LPMS:extractant)
followed by filtration (Maynard et al., 2008). Total N content was determined after a Kjeldahl digestion (Rutherford et al., 2008). The N concentration in the extracts was measured by an auto-mated colorimeter (S1: Technicon Autoanalyzer II, Technicon Instruments Corporation; S2: Konelab Aqua 20, Thermo Fisher Scientific). For LPMS used on S1, the total C content was mea-sured by loss on ignition at 485°C for a minimum of 12 h (con-version factor from organic matter to total C of 0.5; Giroux and Audesse, 2004). For LPMS used on S2, total C was determined by dry combustion (Skjemstad and Baldock, 2008; LECO C230 Carbon Analyzer, LECO Corporation).
Gas Flux Measurement
Experimental designs S1 and S2 were monitored during two consecutive snow-free seasons after LPMS application (S1: 5 July to 23 Oct. 2012 and 23 Apr. to 24 Oct. 2013; S2: 4 July to 23 Oct. 2013 and 30 Apr. to 6 Oct. 2014). Soil-surface N2O, CO2, and CH4 fluxes were measured simultaneously using non-flow-through non-steady-state chambers (Rochette and Bertrand, 2008) during the first season as follows: thrice a week for the first month after LPMS application, twice a week for the second month, and weekly throughout the remaining season. During the second season, the sampling frequency was decreased and fluxes were measured after snow melt until late October. Systematic sampling was performed up to twice a week from April until mid-May, up to once every second week from mid-May until late June, and monthly until late October, for a total of 15 sampling days throughout the second season in 2013 (S1) and 11 sampling days in 2014 (S2). Acrylic enclosures were composed of a permanent frame (0.75 ´ 0.15 ´ 0.14 m high) inserted at the center of each plot to a 0.1-m depth, and a removable chamber (0.75 ´ 0.15 ´ 0.15 m high) was sealed to the frame at the time of measurement. The height of frames above the soil surface was measured on each sampling date for the first month, then after precipitation events for the remainder of the season. The frames were accessed from the same direction in the plot, and a wood board was placed on the soil surface during GHG measurements to avoid soil compaction around the chamber caused by repeated walking. The air in the chamber headspace was sampled (20 mL) at 0, 6, 12, and 18 min after chamber deployment with a syringe through a rubber septum, and the sample was transferred imme-diately to pre-evacuated 12-mL glass vials (Exetainer, Labco). Gas samples, along with known standards, were analyzed within 15 d of collection using a gas chromatograph (Bruker, model 450) with Ar/CH4 (95/5) carrier gas through a 1.75-m-long Porapak Q 80/100 column (60°C) equipped with an electron capture detector for N2O, and with He carrier gas through a 3.6-m-long Hayesep A 80/100 column equipped with a flame ionization detector for CH4, and for CO2 after passing through a methanizer (catalyst column, Ni Nitrate 10%, 400°C). Soil N2O, CO2, and CH4 fluxes were calculated using equations proposed by Rochette and Bertrand (2008), in which the rate of change of chamber GHG concentration was estimated using linear or nonlinear methods. The GHG fluxes were considered greater than zero (i.e., minimum detectable flux) when changes in gas concentrations during deployment were above the analyti-cal variability levels (N2O: 0.005 mmol mol−1; CH
4: 0.05 mmol
Table 2. Mean (± Sd, n = 6) chemical characteristics of the applications of landfilled paper mill sludge (LPMS) on two experimental sites (S1 and S2) for the first year of the experiment on nonacidic mine tailings.
Targeted LPMS rate† Applied LPMS rate‡ Total N NH4–N Total C
————————————————————————————————— Mg ha−1 ————————————————————————————————— S1 50 47.3 ± 0.01 0.709 ± 0.0002 0.251 ± 0.0001 16.52 ± 0.004 100 94.5 ± 0.02 1.418 ± 0.0003 0.501 ± 0.0001 33.03 ± 0.008 S2 50 68.0 ± 0.05 0.510 ± 0.0004 0.050 ± 0.00004 9.52 ± 0.007 100 135.9 ± 0.05 1.020 ± 0.0004 0.101 ± 0.00004 19.03 ± 0.008
†Application rates are expressed on a dry-matter basis.
mol−1; CO
2: 1 mmol mol−1). Vegetation inside gas measurement
frames was removed by hand on each sampling date, but it was left undisturbed on the remaining part of each plot. Removal was necessary to measure solely soil GHG emissions and eliminate the effect of C and N mineralization by plants on the measure-ment surface. The effect of white clover on soil GHG fluxes was determined indirectly.
Cumulative area-based N2O, CO2, and CH4 emissions were calculated for the snow-free season using numerical integration and following the assumption that changes between sampling dates were linear (Chantigny et al., 2013; de Klein and Harvey, 2015). The LPMS-IEFs were calculated by subtracting cumu-lative gaseous emissions from 0-Mg LPMS ha−1 plots from the
cumulative gaseous emissions of 50- and 100-Mg LPMS ha−1
plots and dividing by the total amount of N or C applied during the first season.
Soil Sampling and Analyses
Soil samples were collected in 2013 during the first year of the experiment on S2 plots. Soil mineral N [(NO2+NO3)-N and NH4–N] was analyzed at regular intervals. Samples were taken weekly before and after LPMS application (4 and 11 July, respectively) for a month (18, 25, and 30 July and 6 August) and then monthly for the rest of the snow-free season (12 Aug., 18 Sept., and 21 Oct. 2013). Four soil cores were taken from the top 30 cm using a stainless steel probe sampler (2-cm diam.). Composite samples were made for each plot and stored in a plastic bag at 4°C within 4 h. The extraction was performed within 24 h with 1 mol L−1 KCl (1:5, soil:extractant ratio). The
soil-solution mixture was agitated on a reciprocal shaker for 1 h, followed by centrifugation at 3000g for 10 min. The
superna-tant was filtered using Whatman #42 papers prewashed with 1 mol L−1 KCl. The extracts were stored at −18°C until
analy-sis for (NO2+NO3)-N and NH4–N concentrations by an auto-mated colorimeter (Model QuickChem 8000 FIA+, Lachat Instruments). The soil NO2+NO3 and NH4 exposures, which are integrated measures of the daily exposure of soil microor-ganisms to NO2+NO3 and NH4 over time, were calculated for the snow-free season using numerical integration and following the assumption that changes between sampling dates were linear (Burton et al., 2008). On each gas sampling date, soil volumet-ric water content (VWC) at 20-cm depth was also measured using a portable time domain reflectometry meter (TDR 100, Fieldscout, Spectrum Technologies). Precipitation was moni-tored at the Environment and Climate Change Canada weather station at St-Ambroise, QC, located 17 km from the experimen-tal site (48°34¢ N, 71°20¢ W).
Statistical Analyses
Statistical analyses were performed using JMP Pro (SAS Institute, 2015). The treatment effects on the cumulative area-based N2O, CO2, and CH4 emissions were tested separately for each site (S1 and S2) and snow-free season (2012: S1 [Year 1]; 2013: S1 [Year 2], S2 [Year 1]; 2014: S2 [Year 2]) using linear mixed model ANOVA. The experimental plan modeled was a randomized complete block design, with LPMS rate and seed-ing treatments and their interactions as fixed factors and block as a random factor. Linear and quadratic contrasts (single degree
of freedom, a priori comparisons) were used to test treatment effects when the fixed factors and their interactions resulted in significant differences between the treatments. The same linear mixed model was used to test the treatment effects on the soil NO2+NO3 and NH4 exposures (2013: S2 [Year 1]). Data were
log10–transformed when necessary to comply with assumption
of homogeneity of variances. Spearman’s nonparametric correla-tion coefficients (r) were used to test the relacorrela-tionships between soil VWC and soil-surface N2O and CO2 fluxes. Spearman’s
cor-relations were also performed to test the cor-relationships between cumulative area-based N2O emissions and soil NO2+NO3 and
NH4 exposures.
Results
Soil-Surface N
2O Emissions
Soil-surface N2O fluxes were relatively low in control plots
(0 Mg LPMS ha−1) throughout the first season of the experiment
on both sites (<0.13 mg N2O-N m−2 h−1, Fig. 1a). On
LPMS-amended plots, fluxes peaked after 7 and 6 d following applica-tion, reaching values up to 24.2 and 10.6 mg N2O-N m−2 h−1 on
S1 and S2, respectively. On both sites, fluxes from amended plots gradually decreased to the level of unamended control during the 40 d after LPMS application and remained at this level for the remainder of the season (Fig. 1a). There was a significant correla-tion between soil VWC and soil-surface N2O fluxes (Spearman’s
r = 0.2367, p < 0.0001) on S1 during the first season after appli-cation; no correlation was observed on S2. On S1, peaks in the fluxes coincided with a short period of rainfall reaching up to 28 mm (13 July 2012), whereas no such high rainfalls occurred during the peak period on S2 (Fig. 1c). Rainfall events did not seem to affect N2O fluxes after the 4-wk peak period following
LPMS application during the first season on both sites.
Landfilled PMS application significantly increased the cumu-lative area-based N2O emissions at both sites during the first
season (Tables 3 and 4). Cumulative area-based N2O emissions
from LPMS-amended plots varied from 7.56 to 34.7 kg N2O-N
ha−1 during the first season after application and were 23 to
297 times greater than values from control plots, which ranged between 0.117 and 0.331 kg N2O-N ha−1 (Table 3). Cumulative
N2O emissions were 2.2 to 4.6 times higher for plots receiving
100 Mg LPMS ha−1 than for plots receiving 50 Mg LPMS ha−1
on both sites (Table 3). Nitrous oxide losses were negligible during the second season after LPMS application (Table 3). On S1 during the second season, LPMS had no significant effect on the cumulative N2O emissions while the effect was significant
on S2, although the absolute values were still within the range of very low values for Year 2 on each site and a clear trend was not obvious from the data (Tables 3 and 4). On both sites and seasons, the presence of T. repens had no significant effect on
cumulative N2O emissions (Tables 3 and 4). The LPMS-IEFs
ranged from 0.0104 to 0.0243 kg N2O-N kg−1 N applied during
the first season (highest LPMS-IEF measured for 100 Mg LPMS ha−1) and were negligible during the second season (Table 3).
The correlations between cumulative area-based N2O emissions
and soil NO2+NO3 and NH4 exposures were significant on S2
during the first season (N2O emissions vs. NO2+NO3 exposure:
Spearman’s r = 0.8989, p < 0.0001; N2O emissions vs. NH4
Fig. 1. Mean daily area-based (a) N2O, (b) CO2 fluxes, and (c) soil volumetric water content (VWC) and precipitation after the applications of land-filled paper mill sludge (LPMS) combined with a seeding of white clover (Trifolium repens) on two experimental sites (S1 and S2) during the first snow-free seasons (Year 1) of the experiment on nonacidic mine tailings. The LPMS application rates were of 0, 50, and 100 Mg dry LPMS ha−1, and
seeding rates of white clover were of 0 and 12 kg ha−1 (n = 3). Vertical dashed lines indicate LPMS application dates.
Table 3. Mean cumulative (± Sd, n = 3) area-based N2O emissions and induced emission factors (IEF) after the applications of landfilled paper mill sludge (LPMS) combined with a seeding of white clover (Trifolium repens) on two experimental sites (S1 and S2) and during two snow-free seasons (Years 1 and 2, LPMS applied in Year 1) on nonacidic mine tailings.
Site Clover LPMS application rate Year 1 Year 2
Area-based N2O emissions LPMS-IEF Area-based N2O emissions LPMS-IEF
Mg dry LPMS ha−1 kg N
2O-N ha−1 kg N2O-N kg−1 N kg N2O-N ha−1 kg N2O-N kg−1 N
1 Absence 0 0.216 ± 0.099 – 0.0937 ± 0.0573 – 50 7.56 ± 2.45 0.0104 ± 0.0035 0.159 ± 0.071 9.25 ´ 10−5 ± 1.2 ´ 10−4 100 34.7 ± 11.6 0.0243 ± 0.0082 0.127 ± 0.148 2.32 ´ 10−5 ± 1.3 ´ 10−4 Presence 0 0.117 ± 0.029 – 0.0576 ± 0.026 – 50 7.87 ± 0.105 0.0109 ± 0.0001 0.305 ± 0.427 3.49 ´ 10−4 ± 5.66 ´ 10−4 100 31.6 ± 7.44 0.0222 ± 0.0052 0.114 ± 0.130 3.99 ´ 10−5 ± 8.09 ´ 10−5 2 Absence 0 0.217 ± 0.101 – 0.231 ± 0.075 – 50 9.35 ± 0.285 0.0179 ± 0.0007 0.0762 ± 0.0936 −3.03 ´ 10−4 ± 3.31 ´ 10−4 100 20.8 ± 4.2 0.0202 ± 0.0040 0.0118 ± 0.0074 −2.15 ´ 10−4 ± 6.83 ´ 10−5 Presence 0 0.331 ± 0.257 – 0.0864 ± 0.0733 – 50 8.73 ± 1.37 0.0165 ± 0.0031 0.100 ± 0.044 2.71 ´ 10−5 ± 2.11 ´ 10−4 100 22.0 ± 1.84 0.0213 ± 0.0019 0.0886 ± 0.0822 2.08 ´ 10−6 ± 1.32 ´ 10−4
Soil-Surface CO
2Emissions
Soil-surface CO2 fluxes in control plots were <480 mg
CO2–C m−2 h−1 on both sites throughout the first season of the
experiment period (Fig. 1b). Fluxes from LPMS-amended plots reached values up to 1531 and 681 mg CO2–C m−2 h−1 on S1
and S2, respectively. On S1, CO2 fluxes reached a peak 7 d after
LPMS application and returned to near-background levels at the end of the first season. On S2, large fluxes were sporadically observed on control and amended plots (i.e., at Days 8, 26, 36, and 54; Fig. 1b). There was a significant correlation between soil VWC and CO2 fluxes on S1 (Spearman’s r= 0.2164, p < 0.0001)
during the first season after application, whereas this correlation was not observed on S2.
The LPMS application significantly increased the cumula-tive area-based CO2 emissions on both sites during both seasons,
whereas white clover did not have significant effects (Tables 4 and 5). Cumulative CO2 emissions ranged from 5784 to 11,423
kg CO2–C ha−1 on amended plots and from 3481 to 7635 kg
CO2–C ha−1 on control plots. Cumulative CO2 emissions were
1.05 to 1.31 times higher for plots receiving 100 Mg LPMS ha−1
than for plots receiving 50 Mg LPMS ha−1 (Table 5). On both
sites, LPMS-IEFs ranged from 0.0787 to 0.222 and 0.0715 to 0.272 kg CO2–C kg−1 C applied for the first and second years
after application, respectively (Table 5).
Soil-Surface CH
4Fluxes
The cumulative area-based CH4 fluxes were mainly negative
at both sites and for both seasons from LPMS-amended and unamended control plots, ranging from −0.413 to −0.0121 kg CH4–C ha−1 (data not shown), which may have been a slight
uptake as it is considered negligible in terms of contribution to overall GHG emissions. On S1, a significant interaction was observed between LPMS and T. repens treatments on the second
year after LPMS application (Table 4), but values obtained were again considered negligible (data not shown).
Soil Mineral N Concentrations
During the first season on S2, the soil (NO2+NO3)-N concen-trations increased gradually after LPMS application until a peak was reached on Day 33; near-background levels were reached at the end of the season (109 d, Fig. 2a). The soil NH4–N concen-trations peaked 1 wk after land application and returned to near-background levels after 39 d (Fig. 2b). The LPMS application significantly increased the soil NO2+NO3 and NH4 exposures, whereas T. repens treatments had no effect (Table 6).
Discussion
Soil-Surface N
2O Emissions
Cumulative area-based N2O emissions on control plots after one growing season (0.117 to 0.331 kg N2O-N ha−1) were lower
than documented average emissions for unamended agricultural soils (0.405 to 1 kg N2O-N ha−1; Granli and Bøckman, 1994;
Bouwman, 1996; Mosier et al., 1996; Helgason et al., 2005) and within the documented range for managed boreal forest soils (0.1 to 0.6 kg N2O-N ha−1; Eggleston et al., 2006). Cumulative
emissions during the second season were even lower (0.0576 to 0.231 kg N2O-N ha−1), suggesting low anthropogenic N
2O
emis-sions from the nonacidic mine tailings site where endemic forest floor (topsoil) was mixed prior to reforestation.
Table 4. The P values of the ANOVA testing the effects of the applications of landfilled paper mill sludge (LPMS) combined with a seeding of white clover (Trifolium repens) on the cumulative area-based N2O, CO2, and CH4 emissions on two experimental sites (S1 and S2) and during two snow-free seasons (Years 1 and 2, LPMS applied in Year 1) on nonacidic mine tailings. differences were considered statistically significant at P < 0.05. Linear (Lin) and quadratic (Quad) contrasts were performed when the fixed factors, and their interactions resulted in significant differences between the treatments.
Site Year Source Numerator df denominator df P value
N2O CO2 CH4 1 1 LPMS 2 10 <0.0001 <0.0001 0.5050 Lin 1 10 <0.0001 <0.0001 – Quad 1 10 <0.0001 0.0176 – Clover 1 10 0.2483 0.1152 0.3953 LPMS × Clover 2 10 0.2558 0.1204 0.9803 1 2 LPMS 2 10 0.5104 0.0043 0.0705 Lin 1 10 – 0.0018 – Quad 1 10 – 0.2059 – Clover 1 10 0.7091 0.1770 0.9487 LPMS × Clover 2 10 0.9370 0.2229 0.0347 Lin 1 10 – – 0.0209 Quad 1 10 – – 0.1794 2 1 LPMS 2 10 <0.0001 0.0045 0.0876 Lin 1 10 <0.0001 0.0013 – Quad 1 10 <0.0001 0.9843 – Clover 1 10 0.6989 0.1830 0.6250 LPMS × Clover 2 10 0.6868 0.2303 0.6419 2 2 LPMS 2 10 0.0499 0.0040 0.1357 Lin 1 10 0.0173 0.0011 – Quad 1 10 0.7449 0.9450 – Clover 1 10 0.3460 0.3285 0.7337 LPMS × Clover 2 10 0.0564 0.8735 0.5022
To the best of our knowledge, this is one of the first studies reporting N2O emissions from LPMS application for the
recla-mation of mine tailings (Larney and Angers, 2012; Faubert et al., 2016). In this context, comparisons of the trends observed in the N2O emissions can only be made with studies reporting
the effect of organic amendments applied on agricultural soils, the type of soil for which most of this kind of knowledge exists.
Delays of 6 to 7 d between LPMS application and N2O
peak fluxes were observed. Similar delays have been observed by Chadwick et al. (2000) and Chantigny et al. (2001) with farm animal manures applied on agricultural soils, but other studies have reported much shorter periods (e.g., 18 to 24 h; Rochette et al., 2000a, 2004). Delays between LPMS applica-tion and soil (NO2+NO3)-N and NH4–N peak concentrations
were also observed. The delays for N2O peak fluxes were likely
influenced by NO3 availability through denitrification, which
gradually increased after LPMS application (Burton et al., 2008; Thangarajan et al., 2013). The N2O peak fluxes were short lived
and declined progressively to reach near-background levels after 40 d. This duration is in agreement with periods ranging from 40 to 55 d for mixed primary and secondary PMS applied on agri-cultural clayey soils cropped to corn (Zea mays L.; Chantigny et
al., 2013) and less than 60 d in manure-amended soils (Rochette Table 5. Mean cumulative (± Sd, n = 3) area-based CO2 emissions and induced emission factors (IEF) after the applications of landfilled paper mill sludge (LPMS) combined with a seeding of white clover (Trifolium repens) on two experimental sites (S1 and S2) and during two snow-free seasons (Years 1 and 2, LPMS applied in Year 1) on nonacidic mine tailings.
Site Clover LPMS application rate Year 1 Year 2
Area-based CO2 emissions LPMS-IEF Area-based CO2 emissions LPMS-IEF
Mg dry LPMS ha−1 kg CO 2–C ha−1 kg CO2–C kg−1 C kg CO2–C ha−1 kg CO2–C kg−1 C 1 Absence 0 3,481 ± 355 – 5,271 ± 1,550 – 50 6,741 ± 858 0.197 ± 0.045 9,768 ± 758 0.272 ± 0.089 100 8,834 ± 1,536 0.162 ± 0.037 11,173 ± 2,035 0.179 ± 0.027 Presence 0 3,737 ± 226 – 6,149 ± 2,213 – 50 5,784 ± 612 0.124 ± 0.024 8,075 ± 1,420 0.117 ± 0.160 100 7,362 ± 280 0.110 ± 0.012 8,510 ± 1,040 0.0715 ± 0.0422 2 Absence 0 7,635 ± 900 – 7,537 ± 750 – 50 8,383 ± 593 0.0787 ± 0.152 9,227 ± 335 0.178 ± 0.096 100 9,313 ± 1,195 0.0882 ± 0.110 11,423 ± 612 0.204 ± 0.072 Presence 0 5,616 ± 1,155 – 6,895 ± 1,417 – 50 7,726 ± 1,301 0.222 ± 0.213 8,951 ± 1,042 0.216 ± 0.251 100 9,700 ± 927 0.215 ± 0.099 10,301 ± 2,541 0.179 ± 0.115
Fig. 2. Mean soil (a) NO2+NO3 and (b) NH4 concentrations after the applications of landfilled paper mill sludge (LPMS) combined with a seeding of white clover (Trifolium repens) on Site 2 during the first snow-free season of the experiment on nonacidic mine tailings. The LPMS application rates were of 0, 50, and 100 Mg dry LPMS ha−1, and seeding rates of white clover were of 0 and 12 kg ha-1 (n = 3). Vertical dashed lines indicate LPMS
application dates.
Table 6. Mean (± Sd, n = 3) soil NO2+NO3 and NH4 exposures after the applications of landfilled paper mill sludge (LPMS) combined with a seeding of white clover (Trifolium repens) on Site 2 during the first snow-free season of the experiment on nonacidic mine tailings. The P values of the ANOVA testing the treatment effects are presented with the linear (Lin) and quadratic (Quad) contrasts performed when the fixed factors and their interactions resulted in significant differences between the treatments. differences were considered statistically significant at P < 0.05.
Clover LPMS application rate NO2+NO3 exposure NH4 exposure
Mg dry LPMS ha−1 g (NO 2+NO3)-N d kg−1 g NH4–N d kg−1 Absence 0 0.258 ± 0.014 0.157 ± 0.075 50 0.755 ± 0.403 0.217 ± 0.117 100 2.12 ± 0.42 0.456 ± 0.174 Presence 0 0.207 ± 0.123 0.085 ± 0.035 50 0.781 ± 0.331 0.229 ± 0.051 100 1.78 ± 0.39 0.447 ± 0.11 ANOVA Source P values LPMS <0.0001 0.0015 Lin <0.0001 0.0005 Quad 0.0301 0.2904 Clover 0.3443 0.6744 LPMS × clover 0.4658 0.8048
et al., 2008a). These results suggest that most of the LPMS-induced N2O fluxes likely occur within the first 60 d after LPMS
application, which may have been controlled by soil NO2+NO3
and NH4 availabilities through denitrification and nitrification
(Thangarajan et al., 2013).
Nitrous oxide is produced in soils mostly as a byproduct of nitrification and an intermediate of denitrification (Davidson et al., 1986; Thangarajan et al., 2013). Soil water content is known to influence N2O emissions through its effect on
micro-bial activity and O2 availability (Knowles, 1982). In this study,
soil moisture content was correlated with N2O fluxes during
the first season on S1, but no correlation was observed on S2. Interestingly, N2O peak fluxes on S1 were associated with higher
soil moisture and rainfall events, especially during the week after LPMS application, whereas no such correlations were observed on S2. Rainfall events during the first season on S2 occurred once N2O fluxes had declined to near-background levels, which may
partly explain the lack of correlation with soil moisture. These results indicate that soil moisture content does not conclusively explain soil-surface N2O fluxes in this study, probably caused
by different meteorological conditions on both sites for which the LPMS application (i.e., first season of measurements) were done in different years. Other studies documented a significant relationship of this variable (expressed as water-filled pore space) with N2O fluxes after PMS or manure application on agricultural
soils (Rochette et al., 2008a; Chantigny et al., 2010, 2013; Smith and Owens, 2010; Pelster et al., 2012), although Jarecki et al. (2008) did not observe a strong relationship between soil water content and N2O flux levels in either sandy or clayey soils.
Easily oxidizable C and mineral N availability have been documented to influence N2O emissions through nitrification
and denitrification, both in laboratory (Azam et al., 2002) and field experiments (Petersen et al., 2008; Rochette et al., 2008a). Anoxic conditions prevailing in PMS disposal sites create suit-able conditions for the production of NH4 and easily
biode-gradable C compounds such as volatile fatty acids, alcohols, and phenols (Spoelstra, 1979). This phenomenon has been docu-mented for several organic amendments, such as pig and cattle slurries (Kirchmann and Lundvall, 1993) and poultry manure (Kirchmann and Witter, 1989), and for organic marine sedi-ments (Valdemarsen and Kristensen, 2010). Easily oxidizable C compounds are rapidly used by soil microorganisms in aero-bic conditions (Paul and Beauchamp, 1989; Chantigny et al., 2004). This is consistent with N2O and CO2 peak fluxes in the
days after LPMS application on both sites, since respiration rate is indicative of soil available C levels and low soil O2
concentra-tion, thereby favoring N2O emissions through denitrification
(Rochette et al., 2000a; van Groenigen et al., 2005; Thangarajan et al., 2013).
Soil NH4 availability promotes microbial activity, which may
stimulate O2 consumption and maintain anaerobic conditions
at the microsite levels, in turn favoring denitrification (Azam et al., 2002), even under apparent aerobic conditions (Beauchamp et al., 1989). Also, N2O emissions have been documented to
be correlated with soluble organic C availability in coarse-tex-tured soils (Petersen et al., 2008; Chantigny et al., 2010), likely through increased heterotrophic respiration and denitrifier activity (Azam et al., 2002). The N2O emissions showed a
posi-tive relationship with soil NO2+NO3 exposure during the first
season after LPMS application on S2; soil NO2+NO3 exposure
was also increased by LPMS application. These observations sug-gest that denitrification played a role in N2O production in this
study and was limited by labile C and NO3 availability (Azam
et al., 2002; Rochette et al., 2004, 2008a; Burton et al., 2008). Moreover, the rapid increase and subsequent decrease in CO2
fluxes after LPMS application observed during the first season on S1 suggest that easily oxidizable C was rapidly metabolized by soil microbes, leaving recalcitrant C material such as lignin and cellulose (Camberato et al., 2006) and limited available C for denitrification.
The observed N2O peaks on S2 were followed by a rapid
increase and subsequent decrease in NH4 availability during the
first 3 wk after application, with a peak reached after 1 wk. The N2O emissions were also positively correlated with soil NH4
expo-sure, which was also increased by LPMS application. These results suggest that nitrification may have induced N2O emissions. This
is in agreement with field assays reporting complete nitrification of NH4 within 10 to 30 d after pig slurry application on
agricul-tural soils (Chantigny et al., 2001, 2010; Rochette et al., 2004). In laboratory assays led by Stevens et al. (1997), denitrification was the dominant process at the beginning of the incubation, whereas nitrification was more important for the remainder of the experi-ment, contributing 70% of the overall N2O fluxes, regardless of soil
moisture content. Nitrification was also documented to continue longer than observed N2O fluxes (Mulvaney et al., 1997; Williams
et al., 1998), which is coherent with the observed late NO2+NO3
soil buildup observed in our experiment.
Soil-Surface CO
2Emissions
Soil-surface CO2 fluxes have been documented as a good
indicator of organic amendment decomposition and C miner-alization rates (Rochette et al., 2006). Soil-surface CO2 fluxes
were coherent with the two phases of organic amendment decomposition generally observed (i.e., rapid decomposition fol-lowed by slow and long-term decomposition; Fierro et al., 2000; Camberato et al., 2006). High rates of C mineralization imme-diately after organic amendment application are well known for liquid manures, which are rich in volatile organic compounds (Rochette et al., 2004). The cumulative area-based CO2
emis-sions were significantly increased by LPMS application. This result is consistent with increased CO2 emissions from poultry
litter application combined with cultivation of Brachiaria bri-zantha (Hochst. ex A. Rich.) Stapf in a bauxite-mined area under
reclamation (Oliveira et al., 2017).
N
2O and CO
2Emission Factors
The average LPMS-IEF values for N2O emissions of 1.04 to 2.43% of total applied N during the first season on both sites were higher than the averages of 0.9 and 1% reported for land application of mixed PMS on clayey soils (Chantigny et al., 2013; Faubert et al., 2015). The LPMS-IEFs measured in the present study were also higher than the mean weighted induced emission factor of 0.02% reported in a meta-analysis on organic amend-ments applied to agricultural soils, for which PMS was classified in the low-risk group (Charles et al., 2017). On the other hand, an emission factor as high as 5% was reported for PMS appli-cation on a soil that had been cropped with calabrese (Brassica oleracea italica var. cymosa; Baggs et al., 2002). No emission factor
has been reported so far for LPMS application on reclaimed land (Larney and Angers, 2012; Faubert et al., 2016). The LPMS-IEF values obtained were generally higher than the IPCC default value of 1%, although within the range of 0.3 to 3% for mineral and organic N applications on agricultural lands (Eggleston et al., 2006). The LPMS-IEF values reported here are consistent with other studies in Eastern Canada documenting N2O emissions
from organic fertilizers (animal slurries and manures) applied on coarse-textured soils, with IEFs ranging between 0.2 and 2.73% (Rochette et al., 2000b, 2004; Gregorich et al., 2005; Chantigny et al., 2010; Pelster et al., 2012). Differences between emission factors are caused by multiple variables such as soil preparation, texture, and chemical characteristics; source of applied N (min-eral vs. organic); and climatic conditions (Rochette et al., 2008b; Thangarajan et al., 2013).
The LPMS-IEFs for CO2 emissions were between 8 and 22%
of total applied C after the first season and 7 to 27% after the second season. These values are much lower than the emission factors reported from land application of animal slurries and manures on agricultural soils ranging between 42 and 105% (Bernal and Kirchmann, 1992; Kirchmann and Lundvall, 1993; Gregorich et al., 1998; Rochette et al., 2004). This is probably due to the higher content of recalcitrant C such as cellulose and lignin in LPMS compared with animal manures (Camberato et al., 2006). Our results are also consistent with results from previ-ous studies reporting that 40% of deinking PMS remained in the soil 2 yr after application (Chantigny et al., 1999).
Implications for Land Reclamation of Nonacidic Mine
Tailings Sites
The LPMS-IEFs reported here for N2O and CO2 emissions were generally similar to or lower than the emission factors mea-sured for land application of PMS, animal slurries, and manures on agricultural soils. In a life-cycle perspective, the direct GHG emis-sions from land application of LPMS for mine tailings reclamation could be offset through various ways. The LPMS used as amend-ments on mine tailings could decrease global GHG emissions as compared with the use of mineral N fertilizers, for which the C footprint of production is between 0.4 and 13.4 kg CO2 eq. kg−1 N
(Wood and Cowie, 2004; Brown et al., 2010). Land reclamation of mine tailings with LPMS amendments would provide ecosys-tem-regulating services through C storage and sequestration and climate regulation (Larney and Angers, 2012). The C-poor mine tailings (Table 1) have a great potential to store C through the input of organic matter enhanced by LPMS application (Shipitalo and Bonta, 2008; Larney and Angers, 2012) or other types of organic amendments (Shrestha and Lal, 2006; Shrestha et al., 2009; Torri et al., 2014; del Mar Montiel-Rozas et al., 2016). Part of the C applied with LPMS could be stocked in the tailings, as reported for deinking PMS on agricultural soils (Chantigny et al., 1999). Input of organic matter through fallen litter and roots from perennial vegetation, such as the white clover used in this study, and trees could increase the tailings C stock (Shrestha et al., 2009; Frouz, 2017; Gregorich et al., 2017; Oliveira et al., 2017). Tree plantations on reclaimed mine tailings could benefit from fertiliza-tion with LPMS amendment, as reported in silviculture (Jackson et al., 2000). Increased net primary productivity through plant growth on reclaimed mine tailings could increase C sequestration
(Lal, 2003; Shipitalo and Bonta, 2008; Larney and Angers, 2012; Oliveira et al., 2017), which could offset GHG emissions from reclamation operations and mine industrial processes (Shrestha and Lal, 2006; Boucher et al., 2012). This still needs further inves-tigation before making general assumptions.
The application of LPMS for land reclamation of mine tail-ings could enhance the industrial symbioses in which the residue of one industry becomes a resource for another industry (Faubert et al., 2016). In the present case study, PMS from the landfill site of a pulp and paper mill benefitted a mine company located in the same region through tailings reclamation. Such industrial symbioses could be a sustainable solution to meet the objectives of certain jurisdictions that tend to reduce or ban landfilling of PMS (Faubert et al., 2016), as slated by 2020 in the province of Quebec (MDDEP, 2011; Gouvernement du Québec, 2012). In this jurisdiction, there is also a high potential for using LPMS for mine land reclamation as an alternative to landfilling, with a territory of >12,000 ha that needs to be restored or is in the restoration process (MERN, 2017). This practice should also be examined for its potential to generate C-offset credits that could be traded on the voluntary C market, as well as on the regulated C market (e.g., the Western Climate Initiative in North America). Therefore, further research should concentrate on quantifying the direct GHG emissions from PMS landfilling, the business-as-usual scenario, compared with the alternative scenario of LPMS application for mine tailings reclamation, using life-cycle analyses (Faubert et al., 2016). In this context, other studies are also needed on the GHG emissions from LPMS application to reduce the uncertainty of the emission factors in a variety of mine tailings, reclamation scenarios, and climatic conditions.
Conclusion
This study provided field-measured emission factors for LPMS that could be helpful in reducing the uncertainties related to the GHG emissions after land application of this soil amendment on reclaimed lands. Our results show that LPMS application on a nonacidic mine tailings site during two consecutive snow-free sea-sons increased soil N2O emissions compared with the unamended
control during the first season of application, whereas the increase of CO2 emissions lasted over both seasons. The CH4 fluxes after
LPMS application were negligible; a slight oxidation occurred on this well-drained site. The perennial white clover used for tailings reclamation did not affect soil GHG emissions. These results indi-cate that GHG emissions from this practice should be considered in life-cycle analyses evaluating the C footprint of industrial sym-bioses between the mine and pulp and paper industries, as well as by governmental authorities in their policies on PMS management practices and mine tailings reclamation. Future research should be pursued to assess the effect of LPMS and PMS applications on soil GHG emissions from a variety of mine tailings under a wide array of management and climatic conditions to plan responsible and sustainable land reclamation.
Acknowledgments
The study was financially supported by Niobec, Chaire en éco-conseil (Université du Québec à Chicoutimi) and Programme Carbone boréal (Université du Québec à Chicoutimi). A research fellowship from the Mitacs Elevate program was awarded to Patrick Faubert. Research fellowships from the Fonds québécois de Recherche sur la Nature et les Technologies and RECYC-QUÉBEC were awarded to Simon
Durocher. We thank the operational partners of this study: Niobec and Resolute Forest Products–Kénogami Mill. We are also thankful to Olivier Fradette, Frédéric Gagnon, and Stéphanie Girard for the data collection on the field, as well as to Catherine Lemay-Bélisle for her contribution to data collection and analysis. We finally thank Denis Walsh for his input on the statistical analyses, Martin Chantigny for comments provided on this work, and anonymous reviewers for their very helpful comments.
References
Azam, F., C. Müller, A. Weiske, G. Benckiser, and J. Ottow. 2002. Nitrifica-tion and denitrificaNitrifica-tion as sources of atmospheric nitrous oxide– role of oxidizable carbon and applied nitrogen. Biol. Fertil. Soils 35:54–61. doi:10.1007/s00374-001-0441-5
Baggs, E.M., R.M. Rees, K. Castle, A. Scott, K.A. Smith, and A.J.A. Vinten. 2002. Nitrous oxide release from soils receiving N-rich crop residues and paper mill sludge in eastern Scotland. Agric. Ecosyst. Environ. 90:109– 123. doi:10.1016/S0167-8809(01)00175-X
Beauchamp, E.G., J.T. Trevors, and J.W. Paul. 1989. Carbon sources for bacterial denitrification. In: B.A. Stewart, editor, Advances in soil science. Springer, New York. p. 113–142. doi:10.1007/978-1-4613-8847-0_3
Bernal, M.P., and H. Kirchmann. 1992. Carbon and nitrogen mineralization and ammonia volatilization from fresh, aerobically and anaerobically treated pig manure during incubation with soil. Biol. Fertil. Soils 13:135–141. doi:10.1007/BF00336268
Boeckx, P., and O. Van Cleemput. 1996. Flux estimates from soil methanogenesis and methanotrophy: Landfills, rice paddies, natural wetlands and aerobic soils. Environ. Monit. Assess. 42:189–207. doi:10.1007/BF00394050 Boucher, J.F., P. Tremblay, S. Gaboury, and C. Villeneuve. 2012. Can boreal
afforestation help offset incompressible GHG emissions from Cana-dian industries? Process Saf. Environ. Prot. 90:459–466. doi:10.1016/j. psep.2012.10.011
Bouwman, A.F. 1996. Direct emission of nitrous oxide from agricultural soils. Nutr. Cycling Agroecosyst. 46:53–70. doi:10.1007/BF00210224 Bouwman, A.F., L.J.M. Boumans and N.H. Batjes. 2002. Emissions of N2O and
NO from fertilized fields: Summary of available measurement data. Global Biogeochem. Cycles 16:6-1–6-13. doi:10.1029/2001gb001811
Brown, S., N. Beecher, and A. Carpenter. 2010. Calculator tool for determining greenhouse gas emissions for biosolids processing and end use. Environ. Sci. Technol. 44:9509–9515. doi:10.1021/es101210k
Burton, D.L., B.J. Zebarth, K.M. Gillam, and J.A. MacLeod. 2008. Effect of split application of fertilizer nitrogen on N2O emissions from potatoes. Can. J. Soil Sci. 88:229–239. doi:10.4141/CJSS06007
Camberato, J.J., B. Gagnon, D.A. Angers, M.H. Chantigny, and W.L. Pan. 2006. Pulp and paper mill by-products as soil amendments and plant nutrient sources. Can. J. Soil Sci. 86:641–653. doi:10.4141/S05-120
Chadwick, D.R., B.F. Pain, and S.K.E. Brookman. 2000. Nitrous oxide and meth-ane emissions following application of animal manures to grassland. J. Envi-ron. Qual. 29:277–287. doi:10.2134/jeq2000.00472425002900010035x Chantigny, M.H., D.A. Angers, and C.J. Beauchamp. 1999. Aggregation and or-ganic matter decomposition in soils amended with de-inking paper sludge. Soil Sci. Soc. Am. J. 63:1214–1221. doi:10.2136/sssaj1999.6351214x Chantigny, M.H., D.A. Angers, and C.J. Beauchamp. 2000. Active carbon pools
and enzyme activities in soils amended with de-inking paper sludge. Can. J. Soil Sci. 80:99–105. doi:10.4141/S99-050
Chantigny, M.H., D.E. Pelster, M.-H. Perron, P. Rochette, D.A. Angers, L.-É. Parent, D. Massé, and N. Ziadi. 2013. Nitrous oxide emissions from clayey soils amended with paper sludges and biosolids of separated pig slurry. J. Environ. Qual. 42:30–39. doi:10.2134/jeq2012.0196
Chantigny, M.H., P. Rochette, and D.A. Angers. 2001. Short-term C and N dy-namics in a soil amended with pig slurry and barley straw: A field experi-ment. Can. J. Soil Sci. 81:131–137. doi:10.4141/S00-046
Chantigny, M.H., P. Rochette, D.A. Angers, S. Bittman, K. Buckley, D. Massé et al. 2010. Soil nitrous oxide emissions following band-incorporation of fertilizer nitrogen and swine manure. J. Environ. Qual. 39:1545–1553. doi:10.2134/jeq2009.0482
Chantigny, M.H., P. Rochette, D.A. Angers, D. Massé, and D. Côté. 2004. Am-monia volatilization and selected soil characteristics following applica-tion of anaerobically digested pig slurry. Soil Sci. Soc. Am. J. 68:306–312. doi:10.2136/sssaj2004.3060
Charles, A., P. Rochette, J.K. Whalen, D.A. Angers, M.H. Chantigny, and N. Bertrand. 2017. Global nitrous oxide emission factors from agricultural soils after addition of organic amendments: A meta-analysis. Agric. Eco-syst. Environ. 236:88–98. doi:10.1016/j.agee.2016.11.021
Dambreville, C., S. Hallet, C. Nguyen, T. Morvan, J.-C. Germon, and L. Philippot. 2006a. Structure and activity of the denitrifying com-munity in a maize-cropped field fertilized with composted pig ma-nure or ammonium nitrate. FEMS Microbiol. Ecol. 56:119–131. doi:10.1111/j.1574-6941.2006.00064.x
Dambreville, C., C. Hénault, F. Bizouard, T. Morvan, R. Chaussod, and J.-C. Germon. 2006b. Compared effects of long-term pig slurry ap-plications and mineral fertilization on soil denitrification and its end products (N2O, N2). Biol. Fertil. Soils 42:490–500. doi:10.1007/
s00374-005-0040-y
Davidson, E.A., W.T. Swank, and T.O. Perry. 1986. Distinguishing between ni-trification and denini-trification as sources of gaseous nitrogen production in soil. Appl. Environ. Microbiol. 52:1280–1286.
de Klein, C.A.M., and M.J. Harvey. 2015. Nitrous oxide chamber methodology guidelines. Version 1.1. Global Res. Alliance on Agric. Greenhouse Gases, Wellington, New Zealand.
del Mar Montiel-Rozas, M., M. Panettieri, P. Madejón, and E. Madejón. 2016. Carbon sequestration in restored soils by applying organic amendments. Land Degrad. Dev. 27:620–629. doi:10.1002/ldr.2466
Eggleston, H.S., L. Buendia, K. Miwa, T. Ngara, and K. Tanabe, editors. 2006. 2006 IPCC guidelines for national greenhouse gas inventories, prepared by the National Greenhouse Gas Inventories Programme. Inst. Global En-viron. Strat., Hayama, Kanagawa, Japan.
Faubert, P., S. Barnabé, S. Bouchard, R. Côté, and C. Villeneuve. 2016. Pulp and paper mill sludge management practices: What are the challenges to as-sess the impacts on greenhouse gas emissions? Resour. Conserv. Recycl. 108:107–133. doi:10.1016/j.resconrec.2016.01.007
Faubert, P., C. Lemay-Bélisle, N. Bertrand, S. Bouchard, M. Chantigny, S. Duro-cher et al. 2015. Pulp and paper mill sludge management in Quebec: What should be the best option to reduce greenhouse gas emissions? (In French, with English abstract.) Vecteur Environ. 48:50–58.
Fierro, A., D.A. Angers, and C.J. Beauchamp. 1999. Restoration of ecosystem func-tion in an abandoned sandpit: Plant and soil responses to paper de-inking sludge. J. Appl. Ecol. 36:244–253. doi:10.1046/j.1365-2664.1999.00395.x Fierro, A., D.A. Angers, and C.J. Beauchamp. 2000. Decomposition of paper
de-inking sludge in a sandpit minesoil during its revegetation. Soil Biol. Biochem. 32:143–150. doi:10.1016/S0038-0717(99)00123-6
Frouz, J. 2017. Effects of soil development time and litter quality on soil car-bon sequestration: Assessing soil carcar-bon saturation with a field transplant experiment along a post-mining chronosequence. Land Degrad. Dev. 28:664–672. doi:10.1002/ldr.2580
Giroux, M., and P. Audesse. 2004. Comparison of two methods for the determi-nation of organic carbon, total nitrogen and C/N ratio of different organic amendments and manures. (In French, with English abstract.) Agrosol 15:107–110.
Gouvernement du Québec. 2012. Québec in action greener by 2020. 2013–2020 climate change action plan. Phase 1. Gouvernement du Québec, Quebec City, QC, Canada.
Granli, T., and O.C. Bøckman. 1994. Nitrous oxide from agriculture. Nor. J. Ag-ric. Sci. Suppl. 12:1–128.
Gregorich, E.G., H. Janzen, B.H. Ellert, B.L. Helgason, B. Qian, B.J. Zebarth et al. 2017. Litter decay controlled by temperature, not soil properties, affect-ing future soil carbon. Glob. Change Biol. 23:1725–1734. doi:10.1111/ gcb.13502
Gregorich, E.G., P. Rochette, S. McGuire, B.C. Liang, and R. Lessard. 1998. Soluble organic carbon and carbon dioxide fluxes in maize fields receiv-ing sprreceiv-ing-applied manure. J. Environ. Qual. 27:209–214. doi:10.2134/ jeq1998.00472425002700010029x
Gregorich, E.G., P. Rochette, A.J. VandenBygaart, and D.A. Angers. 2005. Greenhouse gas contributions of agricultural soils and potential mitigation practices in eastern Canada. Soil Tillage Res. 83:53–72. doi:10.1016/j. still.2005.02.009
Hansen, S., J.E. Mæhlum, and L.R. Bakken. 1993. N2O and CH4 fluxes in soil
influenced by fertilization and tractor traffic. Soil Biol. Biochem. 25:621– 630. doi:10.1016/0038-0717(93)90202-M
Helgason, B.L., H.H. Janzen, M.H. Chantigny, C.F. Drury, B.H. Ellert, E.G. Gregorich et al. 2005. Toward improved coefficients for predicting direct N2O emissions from soil in Canadian agroecosystems. Nutr. Cycling
Agro-ecosyst. 72:87–99. doi:10.1007/s10705-004-7358-y
IUSS Working Group (International Union of Soil Sciences Working Group). 2015. World reference base for soil resources 2014, update 2015. Interna-tional soil classification system for naming soils and creating legends for soil maps. FAO, Rome, Italy.
Jackson, M.J., M.A. Line, S. Wilson, and S.J. Hetherington. 2000. Application of composted pulp and paper mill sludge to a young pine plantation. J. Envi-ron. Qual. 29:407–414. doi:10.2134/jeq2000.00472425002900020006x
Jarecki, M.K., T.B. Parkin, A.S.K. Chan, J.L. Hatfield, and R. Jones. 2008. Greenhouse gas emissions from two soils receiving nitrogen fertilizer and swine manure slurry. J. Environ. Qual. 37:1432–1438. doi:10.2134/ jeq2007.0427
Kirchmann, H., and A. Lundvall. 1993. Relationship between N immobilization and volatile fatty acids in soil after application of pig and cattle slurry. Biol. Fertil. Soils 15:161–164. doi:10.1007/BF00361605
Kirchmann, H., and E. Witter. 1989. Ammonia volatilization during aerobic and anaerobic manure decomposition. Plant Soil 115:35–41. doi:10.1007/ BF02220692
Knowles, R. 1982. Denitrification. Microbiol. Rev. 46:43–70.
Lal, R. 2003. Offsetting global CO2 emissions by restoration of degraded soils
and intensification of world agriculture and forestry. Land Degrad. Dev. 14:309–322. doi:10.1002/ldr.562
Larney, F.J., and D.A. Angers. 2012. The role of organic amendments in soil rec-lamation: A review. Can. J. Soil Sci. 92:19–38. doi:10.4141/cjss2010-064 Le Mer, J., and P. Roger. 2001. Production, oxidation, emission and consumption
of methane by soils: A review. Eur. J. Soil Biol. 37:25–50. doi:10.1016/ S1164-5563(01)01067-6
Loro, P.J., D.W. Bergstrom, and E.G. Beauchamp. 1997. Intensity and duration of denitrification following application of manure and fertilizer to soil. J. Envi-ron. Qual. 26:706–713. doi:10.2134/jeq1997.00472425002600030016x Maynard, D.G., Y.P. Kalra, and J.A. Crumbaugh. 2008. Nitrate and exchangeable
ammonium nitrogen. In: M.R. Carter and E.G. Gregorich, editors, Soil sampling and methods of analysis. CRC Press, Boca Raton, FL. p. 71–80. MDDELCC (Ministère du Développement durable, de l’Environnement et de
laLutte contre les changements climatiques). 2016. Bilan annuel de con-formité environnementale 2013. Secteur des pâtes et papiers. (In French.) Gouvernement du Québec, Quebec City, QC, Canada.
MDDEP (Ministère du Développement durable, de l’Environnement et des Parcs). 2011. Québec residual materials management policy. (In French.) Gouvernement du Québec, Quebec City, QC, Canada.
MERN (Ministère de l’Énergie et des Ressources naturelles). 2017. Gestim plus. Gestion des titres miniers. (In French.) Gouvernement du Qué-bec. https://gestim.mines.gouv.qc.ca/MRN_GestimP_Presentation/ ODM02101_login.aspx (accessed on 23 Feb. 2017).
Mogge, B., E.-A. Kaiser, and J.-C. Munch. 1999. Nitrous oxide emissions and de-nitrification N-losses from agricultural soils in the Bornhöved lake region: Influence of organic fertilizers and land-use. Soil Biol. Biochem. 31:1245– 1252. doi:10.1016/S0038-0717(99)00039-5
Mosier, A.R., J.M. Duxbury, J.R. Freney, O. Heinemeyer, and K. Minami. 1996. Nitrous oxide emissions from agricultural fields: Assessment, measurement and mitigation. Plant Soil 181:95–108. doi:10.1007/BF00011296 Mulvaney, L.R., A.S. Khan, and S.C. Mulvaney. 1997. Nitrogen fertilizers
promote denitrification. Biol. Fertil. Soils 24:211–220. doi:10.1007/ s003740050233
Oliveira, D.M.S., I.R.d. Silva, G.O. Mendes, A.A. Vasconcelos, G.C.V. Mayrink, and E.E.J. Verburg. 2017. Carbon fluxes from different pools in a mined area under reclamation in Minas Gerais State, Brazil. Land Degrad. Dev. 28:507–514. doi:10.1002/ldr.2601
Paul, J.W., and E.G. Beauchamp. 1989. Effect of carbon constituents in ma-nure on denitrification in soil. Can. J. Soil Sci. 69:49–61. doi:10.4141/ cjss89-006
Pelster, D.E., M.H. Chantigny, P. Rochette, D.A. Angers, C. Rieux, and A. Vanasse. 2012. Nitrous oxide emissions respond differently to mineral and organic nitrogen sources in contrasting soil types. J. Environ. Qual. 41:427–435. doi:10.2134/jeq2011.0261
Petersen, S., P. Schjonning, I. Thomsen, and B. Christensen. 2008. Nitrous oxide evolution from structurally intact soil as influenced by tillage and soil water content. Soil Biol. Biochem. 40:967–977. doi:10.1016/j. soilbio.2007.11.017
Piearce, T.G., T. Budd, J.M. Hayhoe, D. Sleep, and P.J. Clasper. 2003. Earth-worms of a land restoration site treated with paper mill sludge: The 7th international symposium on earthworm ecology, Cardiff, Wales, 2002. Pe-dobiolgia 47:792–795. doi:10.1078/0031-4056-00260
Rochette, P., D.A. Angers, M.H. Chantigny, N. Bertrand, and D. Côté. 2004. Carbon dioxide and nitrous oxide emissions following fall and spring ap-plications of pig slurry to an agricultural soil. Soil Sci. Soc. Am. J. 68:1410– 1420. doi:10.2136/sssaj2004.1410
Rochette, P., D.A. Angers, M.H. Chantigny, B. Gagnon, and N. Bertrand. 2006. In situ mineralization of dairy cattle manures as determined using soil-sur-face carbon dioxide fluxes. Soil Sci. Soc. Am. J. 70:744–752. doi:10.2136/ sssaj2005.0242
Rochette, P., D.A. Angers, M.H. Chantigny, B. Gagnon, and N. Bertrand. 2008a. N2O fluxes in soils of contrasting textures fertilized with liquid
and solid dairy cattle manures. Can. J. Soil Sci. 88:175–187. doi:10.4141/ CJSS06016
Rochette, P., D.A. Angers, and D. Côté. 2000a. Soil carbon and nitrogen dy-namics following application of pig slurry for the 19th consecutive year I. Carbon dioxide fluxes and microbial biomass carbon. Soil Sci. Soc. Am. J. 64:1389–1395. doi:10.2136/sssaj2000.6441389x
Rochette, P., and N. Bertrand. 2008. Soil-surface gas emissions. In: M.R. Carter and E.G. Gregorich, editors, Soil sampling and methods of analysis. CRC Press, Boca Raton, FL. p. 851–861.
Rochette, P., E. van Bochove, D. Prévost, D.A. Angers, D. Côté, and N. Ber-trand. 2000b. Soil carbon and nitrogen dynamics following application of pig slurry for the 19th consecutive year II. Nitrous oxide fluxes and mineral nitrogen. Soil Sci. Soc. Am. J. 64:1396–1403. doi:10.2136/ sssaj2000.6441396x
Rochette, P., D.E. Worth, R.L. Lemke, B.G. McConkey, D.J. Pennock, C. Wag-ner-Riddle, and R.J. Desjardins. 2008b. Estimation of N2O emissions from
agricultural soils in Canada. I. Development of a country-specific method-ology. Can. J. Soil Sci. 88:641–654. doi:10.4141/CJSS07025
Rutherford, P.M., W.B. McGill, C.T. Figueiredo, and J.M. Arocena. 2008. To-tal nitrogen. In: M. Carter and E.G. Gregorich, editors, Soil sampling and methods of analysis. CRC Press, Boca Raton, FL. p. 239–250.
SAS Institute. 2015. JMP Pro software. Release 12.0.1. SAS Inst., Cary, NC. Sheppard, S.C., and J.A. Addison. 2008. Soil sample handling and storage. In:
M.R. Carter and E.G. Gregorich, editors, Soil sampling and methods of analysis. CRC Press, Boca Raton, FL. p. 39–49.
Shipitalo, M.J., and J.V. Bonta. 2008. Impact of using paper mill sludge for sur-face-mine reclamation on runoff water quality and plant growth. J. Envi-ron. Qual. 37:2351–2359. doi:10.2134/jeq2007.0648
Shrestha, R.K., and R. Lal. 2006. Ecosystem carbon budgeting and soil car-bon sequestration in reclaimed mine soil. Environ. Int. 32:781–796. doi:10.1016/j.envint.2006.05.001
Shrestha, R.K., R. Lal, and P.-A. Jacinthe. 2009. Enhancing carbon and nitrogen sequestration in reclaimed soils through organic amendments and chisel-ing. Soil Sci. Soc. Am. J. 73:1004–1011. doi:10.2136/sssaj2008.0216 Skjemstad, J.O., and J.A. Baldock. 2008. Total and organic carbon. In: M.R.
Carter and E.G. Gregorich, editors, Soil sampling and methods of analysis. CRC Press, Boca Raton, FL. p. 225–237.
Smith, D.R., and P.R. Owens. 2010. Impact of time to first rainfall event on greenhouse gas emissions following manure applications. Commun. Soil Sci. Plant Anal. 41:1604–1614. doi:10.1080/00103624.2010.485240 Spoelstra, S.F. 1979. Volatile fatty acids in anaerobically stored piggery wastes.
Neth. J. Agric. Sci. 27:60–66.
Stevens, R.J., R.J. Laughlin, L.C. Burns, J.R.M. Arah, and R.C. Hood. 1997. Measuring the contributions of nitrification and denitrification to the flux of nitrous oxide from soil. Soil Biol. Biochem. 29:139–151. doi:10.1016/ S0038-0717(96)00303-3
Tenuta, M., D.W. Bergstrom, and E.G. Beauchamp. 2000. Denitrifying enzyme activity and carbon availability for denitrification follow-ing manure application. Commun. Soil Sci. Plant Anal. 31:861–876. doi:10.1080/00103620009370483
Thangarajan, R., N.S. Bolan, G. Tian, R. Naidu, and A. Kunhikrishnan. 2013. Role of organic amendment application on greenhouse gas emission from soil. Sci. Total Environ. 465:72–96. doi:10.1016/j.scitotenv.2013.01.031 Torri, S.I., R.S. Corrêa, and G. Renella. 2014. Soil carbon sequestration
result-ing from biosolids application. Appl. Environ. Soil Sci. 2014:821768. doi:10.1155/2014/821768
Valdemarsen, T., and E. Kristensen. 2010. Degradation of dissolved organic monomers and short-chain fatty acids in sandy marine sediment by fer-mentation and sulfate reduction. Geochim. Cosmochim. Acta 74:1593– 1605. doi:10.1016/j.gca.2009.12.009
van Groenigen, J.W., P.J. Kuikman, W.J.M. de Groot, and G.L. Velthof. 2005. Nitrous oxide emission from urine-treated soil as influenced by urine com-position and soil physical conditions. Soil Biol. Biochem. 37:463–473. doi:10.1016/j.soilbio.2004.08.009
Williams, P.H., S.C. Jarvis, and E. Dixon. 1998. Emission of nitric oxide and nitrous oxide from soil under field and laboratory conditions. Soil Biol. Biochem. 30:1885–1893. doi:10.1016/S0038-0717(98)00052-2 Wood, S. and C. Cowie. 2004. A review of greenhouse gas emission factors for