L E T T E R T O T H E E D I T O R
Open Access
Combining omics data to identify genes
associated with allergic rhinitis
Andréanne Morin
1,2, Michel Laviolette
3, Tomi Pastinen
1, Louis-Philippe Boulet
3and Catherine Laprise
2*Abstract
Allergic rhinitis is a common chronic disorder characterized by immunoglobulin E-mediated inflammation. To identify new genes associated with this trait, we performed genome- and epigenome-wide association studies and linked marginally significant CpGs located in genes or its promoter and SNPs located 1 Mb from the CpGs, by identifyingcis methylation quantitative trait loci (mQTL). This approach relies on functional cellular aspects rather than stringent statistical correction. We were able to identify one gene with significantcis-mQTL for allergic rhinitis, caudal-type homeobox 1 (CDX1). We also identified 11 genes with marginally significant cis-mQTLs (p < 0.05) including one with both allergic rhinitis with or without asthma (RNF39). Moreover, most SNPs identified were not located closest to the gene they were linked to throughcis-mQTLs counting the one linked to CDX1 located in a gene previously associated with asthma and atopic dermatitis. By combining omics data, we were able to identify new genes associated with allergic rhinitis and better assess the genes linked to associated SNPs.
Keywords: Allergic rhinitis, Asthma, GWAS, EWAS, mQTLs, Omics
Introduction
Allergic rhinitis is one of the most common allergies worldwide and one of the most common chronic disor-ders among children and adults [1]. Early sensitization to aeroallergens and food combined with the presence of atopic dermatitis, characterized by an immunoglobulin E (IgE)-mediated inflammation, can result in the develop-ment of asthma and/or allergic rhinitis later in life in a
process called “atopic march” [2]. Genetic studies
identified hundreds of genes associated with allergic rhinitis, and genome-wide association studies (GWASs) pinpointed single nucleotide polymorphisms (SNPs) asso-ciated with its development [3, 4]. However, a majority of identified SNPs lie in the non-coding genomic region, making it difficult to identify the targeted genes. Given that DNA methylation may have an impact on gene regulation [5], the probability of detecting true posi-tive associations should be improved by combining nominally significant data from genomics and epige-nomics and linking them by quantitative trait loci (QTL) analysis. Methylation QTLs (mQTLs) allow
assessing the impact of DNA-sequenced variations (SNPs) on DNA methylation. They have been assessed in different tissues and cell types and were shown to overlap with GWAS hits [6–9]. We used this ap-proach to identify allergic rhinitis genes and illustrate its usefulness in the context of a complex trait.
Materials and methods
Individual selection, characterization, and sample preparation
We used data available from the Saguenay–Lac-Saint-Jean (SLSJ) asthma familial collection from Québec, Canada, that has data for rhinitis and allergies (Table 1). This population is known for its founder effect and is more homogeneous than a cosmopolitan population [10, 11]. Individuals affected with rhinitis and allergies, with or without asthma, were analyzed as cases. Individuals with no rhinitis, allergies, and asthma were considered as con-trols. In this study, patients were defined as asthmatics based on if they either had a reported history of asthma (validated by a physician) or if at recruitment they mani-fested asthma-related symptoms and positive PC20 (<8 mg/ml) [12]. Rhinitis was self-reported, and the sub-ject had to answer “yes” to at least one of the following questions: Have you ever had rhinitis?; Have you ever had
* Correspondence:[email protected]
2Département des sciences fondamentales, Université du Québec à
Chicoutimi, 555 boulevard de l’Université, Saguenay, Québec G7H 2B1, Canada
Full list of author information is available at the end of the article
© The Author(s). 2017 Open Access This article is distributed under the terms of the Creative Commons Attribution 4.0 International License (http://creativecommons.org/licenses/by/4.0/), which permits unrestricted use, distribution, and reproduction in any medium, provided you give appropriate credit to the original author(s) and the source, provide a link to the Creative Commons license, and indicate if changes were made. The Creative Commons Public Domain Dedication waiver (http://creativecommons.org/publicdomain/zero/1.0/) applies to the data made available in this article, unless otherwise stated.
hay fever?; and Have you ever had sneeze or rheum after contact with the following: hay, flowers, animals, and dust? Allergy was defined by a skin prick test for 26 aero-allergens (≥3 mm). All subjects were recruited and evalu-ated out of the pollen season [12]. Recruitment and clinical evaluation of individuals as well as phenotype de-scription can be found in Laprise [12]. All subjects gave their informed consent, and the project was approved by the research ethic committee of the Centre intégré univer-sitaire de santé et de services sociaux du SLSJ.
Genome-wide association study
A total of 508 subjects (321 cases and 187 controls) and 312 subjects (125 cases and 187 controls) were included in the analysis for allergic rhinitis with or without asthma, respectively. The same group of controls was used to compare to both phenotypes (i.e., allergic rhinitis and al-lergic rhinitis with asthma). DNA extraction, genotyping methods, and statistical analyses were described previously [12]. Genotyping was performed using the Illumina 610K Quad array (Illumina, San Diego, CA, USA). Association test was performed using a quasi-likelihood score test using the MQLS program (Release 1.5, http://www.stat.u-chicago.edu/~mcpeek/software/MQLS/index.html), which allows performing case-control association analysis using related individuals [13]. The kinship coefficient was calculated using KinlnbCoef program (version 1.1, http://www.stat.uchicago.edu/~mcpeek/software/KinInbc oef/index.html). We included in the analysis SNPs with
minor allele frequency (MAF) >0.05, p value for Hardy-Weinberg equilibrium >0.0001, and overall call rate >95%. Samples with genotyping rate <95% were excluded. A total of 633 samples (321 subjects with allergic rhinitis with asthma, 125 subject with allergic rhinitis only, and 187 controls (used to compare to both phenotypes)) and 506,388 SNPs were included in the analysis.
Epigenome-wide association study
A total of 31 controls and 48 cases for allergic rhinitis with asthma or 30 cases for allergic rhinitis alone were included in the epigenome-wide association study (EWAS) analysis. These samples are a subset of the ones used in the GWAS analysis. Unrelated subjects were included based on having allergic rhinitis with or without asthma and hav-ing no asthma, allergies, or rhinitis and based on havhav-ing high or low levels of IgE. DNA extraction and sodium bisulfite conversion methods were described previously [14]. The assay was carried out on the Infinium HumanMethylation450 BeadChip array (Illumina, San Diego, CA, USA). The analysis was performed using the RnBeads Bioconductor R package [15]. We removed probes with at least one of the following characteristics: (1) weak signal (p > 0.01) (2128 CpG sites), (2) SNP-enriched sites (4100 sites), (3) out of a CpG context (not on a CG) (3149 sites), or (4) located on sex chro-mosomes (11,129 sites). A total of 465,071 CpG sites were analyzed initially. Signal was then normalized, first by scaling to the internal controls using the methylumi
Table 1 General characterization of individuals analyzed in the study
GWAS samples EWAS samples
Controlsa Allergic rhinitisb Allergic rhinitis combined
with asthmac Controls a
Allergic rhinitisb Allergic rhinitis combined with asthmac
Number of samples 187 125 321 31 30 48
M/F ratio 1:1.13 1:0.87 1:0.87 1:1.60 1:0.88 1:0.78
Age, mean (range)d 43 (3–85) 37 (5–93) 28 (5–83) 29 (1–53) 28 (1–59) 28 (5–55)
Age mediand 41 38 26 35 30 26 Smoking status,n (%)e Non-smoker 82 (44) 64 (51) 219 (68) 14 (45) 18 (60) 36 (75) Ex smoker 61 (33) 37 (30) 53 (17) 8 (26) 6 (20) 4 (8) Smoker 43 (23) 21 (17) 44 (14) 9 (29) 5 (17) 7 (15) IgE,μg/L (SD)f 202.85 (1373.66) 411.27 (852.17) 856.45 (2075.62) 67.10 (90.45) 575.40 (1380.45) 597.73 (242.50) a
Defined as not affected by either asthma, allergies, or rhinitis.bDefined as being affected with both allergy and rhinitis. Allergic rhinitis phenotype is available for all samples. Allergy is defined as at least one positive response on skin prick testing (wheal diameter≥3 mm at 10 min). Rhinitis is self-reported, and the subject had to answer“yes” to at least one of the following questions: Have you ever had rhinitis?; Have you ever had hay fever?; and Have you ever had sneeze or rheum after contact with hay, flowers, animals, and dust? Can be either combinedc
or notb
with asthma.d
Age difference between groups were assessed using an unpaired t test. GWAS: controls vs allergic rhinitis p = 0.078 and control vs allergic rhinitis combined with asthma p = 1.2e−15. EWAS: controls vs allergic rhinitis p = 0.078 and control vs allergic rhinitis combined with asthma p = 0.43.e
Smoking status available for 186 controls, 122 allergic rhinitis, and 316 allergic rhinitis com-bined with asthma subjects for genome-wide association study (GWAS) samples and 31 controls, 29 allergic rhinitis, and 47 allergic rhinitis comcom-bined with asthma subjects for epigenome-wide association study (EWAS) samples. Differences between groups were assessed using a chi-square test. GWAS: controls vs allergic rhinitis p = 0.0045 and control vs allergic rhinitis combined with asthma p = 1.25e−19. EWAS: controls vs allergic rhinitis p = 0.049 and control vs allergic rhinitis combined with asthma p = 7.7e−3.f
Geometric mean and standard deviation (SD) for the immunoglobulin E (IgE) serum concentration calculated for 175 controls, 116 allergic rhinitis, and 302 allergic rhinitis combined with asthma subjects for GWAS samples and all subjects for EWAS samples. IgE level differences between groups were assessed using an unpaired t test. GWAS: controls vs allergic rhinitis p = 0.145 and control vs allergic rhinitis combined with asthma p = 2.2e−3. EWAS: controls vs allergic rhinitis p = 0.003 and control vs allergic rhinitis combined with asthma p = 0.90. Sex, age, cell count, and smoking status were used as covariates in the analyses
R package [16], then by applying the method of subset-quantile within array normalization (SWAN) imple-mented in the minfi R package [17, 18]. A total of 2203 sites were removed due to missing data. We removed probes that mapped multiple genomic regions (≥90% sequence similarity), that have a variant less than 10 bp
from the CpG, or that have ≥2 SNPs in it. A total of
374,498 CpG sites (80.5%) were analyzed for differential DNA methylation using limma R package [19]. All sam-ples had cell counts for eosinophils, basophils, monocytes, lymphocytes, and neutrophils. The cell percentages were used as covariates as well as sex, age, smoking status, and batch effect.
Methylation quantitative trait loci analysis
To perform the mQTL analyses, we used associated SNPs (p < 0.05) and CpGs (p < 0.05 and Δβ > 0.05) in the GWAS and EWAS for both traits. We kept associated CpGs that were located in either the gene body or 1.5-kb upstream of the transcription start site, keeping 88 and 144 CpGs for allergic rhinitis with or without asthma, respectively. SNPs were kept if present in all samples and if the three genotype groups (homozygous reference, heterozygous and homozygous alternative) were observed at least five times. A total of 529 and 625 SNPs were included in the analysis for allergic rhinitis
with or without asthma, respectively. We analyzed
cis-mQTLs where the CpG-SNP combination was less than 1 Mb apart from each other based on the distance used by the GTEX consortia for theircis expression quantita-tive trait loci (cis-eQTLs) (http://www.gtexportal.org/
home/documentationPage). We used a Bonferroni cor-rection to evaluate significance thresholds. We com-puted mQTLs for these SNP-CpG pairs using an additive linear model using the R package MatrixEQTL [20]. Same covariates as in EWAS were included in this analysis. A total of 274 (Bonferronip = 0.05/274 = 1.8e−4)
and 500 (Bonferronip = 0.05/500 = 1e−4) CpG-SNP
com-parisons were performed for allergic rhinitis with or with-out asthma, respectively.
Results and discussion
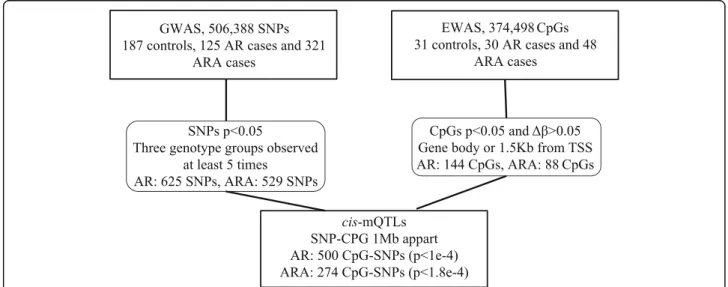
In this study, we used a novel approach that links gen-etic (SNPs) and functional (CpGs) data through the use of mQTLs identifying new genes associated with allergic rhinitis with or without asthma (Fig. 1). It relies on func-tional cellular data and reduces the stringent cutoff nor-mally used in GWAS. Even though this is a pilot experiment with small number of samples, we identified one significant cis-mQTL for allergic rhinitis located in caudal-type homeobox 1 (CDX1) (p = 6.41e−5) (Table 2).
We also observed nine nominally associated cis-mQTLs
located in five genes for allergic rhinitis and 16 located in nine genes for allergic rhinitis with asthma (Table 2). One gene was reported being associated in both traits: ring finger protein 39 (RNF39). It has the highest num-ber of mQTLs identified in both allergic rhinitis with (four) or without asthma (five).
The significantly or nominally associated genes were not associated with any related trait before. Interestingly,
the majority of the genes linked to a SNP by the
cis-mQTLs are not the closest ones, thus would not be the
Fig. 1 Flowchart presenting our approach combining genome-wide association study (GWAS) and epigenome-wide association study (EWAS) hits to identifycis methylation quantitative trait loci (mQTLs) that could be associated with allergic rhinitis with (ARA) or without asthma (AR). We first performed GWAS and EWAS separately for AR and ARA. We then selected marginally associated SNPs (p < 0.05) where the three genotyping groups were observed at least five times. We also selected marginally associated CpGs (p < 0.05) that had a Δβ > 0.05 and that were located in the gene body or 1.5-kb from the transcription start site (TSS). We then linked the SNPs and CpGs that were 1 Mb apart by performingcis-mQTLs for both AR and ARA. We used Bonferronip value cutoffs to assess significance
ones reported in a regular GWAS study. For example, all of the significant SNPs reported for theRNF39 cis-mQTLs are located 300 kb to 1 Mb away from the gene and are lo-cated closer to other genes, which were previously associ-ated with pulmonary function (rs2844833-HLA-F [21], rs2523872-MUC22 [21], rs2517504-HCG22 [21, 22], rs2535238-ZFP57 [21]). The best example remains the one for the significantly associated mQTL that links rs888989 to a CpG located in the promoter region of the CDX1 gene. The SNP is located in an intron of TNFAIP3
interacting protein 1 (TNIP1) and 900 kb from CDX1.
The former was previously associated with atopic derma-titis [23] and asthma [24]. According to the GTEx Portal
(http://www.gtexportal.org/), rs888989 andCDX1 form an
expression quantitative trait loci (eQTL) in the lungs (p = 0.04), which is not the case for TNIP1 (p = 0.94). This reinforces the possible implication of this gene in allergic rhinitis and shows that our method may better assess the true genes of interest linked to the associated SNPs.
The originality of our approach resides in combining GWAS and EWAS nominally associated SNPs and CpGs, usingcis-mQTL data, to identify genes of interest in this disease. This method has the potential to reduce false negative findings by relying on the cellular mecha-nisms of gene regulation compared to the use of strin-gent statistical corrections. The use of a well-described collection coming from a founder population and in-cluding subjects selected based on the same precise cri-teria allowed a more unified genetic background and phenotype. However, since this is a pilot study, the lim-ited number of samples included in the EWAS and the GWAS may constrain the power of the findings. We were not able to test SNPs previously associated with the trait in previous GWASs because they did not meet the criteria to be included in the mQTL analysis. We also analyzed SNPs and CpGs preselected in the arrays by the manufacturers, thus excluding potentially import-ant SNPs or CpG sites, which are not in linkage
Table 2 Genes withcis-mQTL sites significantly associated with allergic rhinitis with or without asthma
Trait Gene Locus mQTLs GWAS analysis EWAS analysis
p value SNP p value CpGs Δβa p value
Allergic rhinitis CDX1b chr5q32 6.41e−5 rs888989 0.0038 cg18424208 −5.19 0.0002 PPAN-P2RY11 chr19p13.2 0.0245 rs3752199 0.0346 cg24118856 7.51 4.39e−5 RNF39c chr6p22.1 0.0090 rs2844833 0.0270 cg05563515 10.11 0.0212 0.0229 rs2844833 0.0270 cg24637044 5.85 0.0132 0.0265 rs2844833 0.0270 cg01286685 7.78 0.0266 0.0411 rs2523872 0.0123 cg10930308 9.50 0.0255 0.0499 rs2523872 0.0123 cg01286685 7.78 0.0266 SRRT chr7q22.1 0.0412 rs6942824 0.0224 cg10426581 5.26 0.0096 Allergic rhinitis with asthma ADORA1 chr1q32.1 0.0337 rs6661284 0.0337 cg19315653 −6.26 0.0315 ITGB2 chr21q22.3 0.0381 rs7275203 0.0381 cg18012089 6.10 0.0068 LINC00336 chr6p21.31 0.0073 rs9461924 0.0073 cg04329454 −7.16 0.0015 MFSD6L chr17p13.1 0.0120 rs9895992 0.0120 cg11685316 5.01 0.0072 PCDH8 chr13q14.3 0.0152 rs732774 0.0295 cg14950829 7.53 0.0097 0.0135 rs3742297 0.0480 cg14950829 7.53 0.0097 0.0259 rs1801249 0.0296 cg14950829 7.53 0.0097 0.0259 rs4943046 0.0298 cg14950829 7.53 0.0097 PITX2 chr4q25 0.0257 rs2067004 0.0272 cg13385016 5.06 0.0240 0.0249 rs9992755 0.0289 cg13385016 5.06 0.0240 RNF180 chr5q12.3 0.0130 rs7713289 0.0130 cg17370163 5.43 0.0021 RNF39c chr6p22.1 0.0133 rs2517504 0.0047 cg03343571 9.19 0.0451 0.0171 rs2517504 0.0047 cg01286685 8.21 0.0478 0.0401 rs2535238 0.0248 cg01286685 8.21 0.0478 0.0499 rs2523872 0.0299 cg01286685 8.21 0.0478 ZFPM1 chr16q24.2 0.0304 rs750740 0.0304 cg04983687 5.53 0.0056 a
Δβ and p values for CpG sites and SNPs forming a cis-mQTL. A negative Δβ indicates a decrease in the percentage of methylation for cases compared to controls. All loci refer to the human hg19 reference genome
b
CDX1 is the only gene for which the mQTL p value survives multiple correction (p < 1e-4)
disequilibrium. DNA methylation analysis using whole blood could have limited the findings, even if correction for cell counts was included in our model. Apart from the limitations, we showed that our approach is promis-ing and acknowledgpromis-ing for the lack of power in future studies will permit to better pinpoint genes of interests for different traits. Studying other tissues implicated in allergic rhinitis trait, like nasal or lung cells, could also reveal other genes implicated in the physiopathology. Genes identified in this study, notablyCDX1, are worth-while to be further investigated to understand the aller-gic rhinitis pathogenesis and the atopic march.
Abbreviations
AR:Allergic rhinitis; ARA: Allergic rhinitis with asthma; CDX1: Caudal-type homeobox 1; eQTL: Expression quantitative trait loci; EWAS: Epigenome-wide association study; GWAS: Genome-Epigenome-wide association study; HCG22: HLA complex group 22; HLA-F: Major histocompatibility complex, class I, F; IgE: Immunoglobulin E; MAF: Minor allele frequency; mQTL: Methylation quantitative trait loci; MUC22: Mucin 22; RNF39: Ring finger protein 39; SLSJ: Saguenay–Lac-Saint-Jean; SNP: Single nucleotide polymorphism; SWAN: Subset-quantile within array normalization; TNIP1: TNFAIP3 interacting protein 1; TSS: Transcription start site; ZFP57: Zinc finger protein 57
Acknowledgements
This work was supported by Laprise and Pastinen operating grants from the Canadian Institute of Health Research (CIHR); AM was supported by the Fonds de Recherche du Québec—Santé (FRQS) doctoral training award. CL is the director of the Asthma Strategic Group of the Respiratory Health Network (RHN), investigator of CHILD Study, and is a member of the AllerGen NCE Inc. CL is the chairholder of the Canada Research Chair in the Environment and Genetics of Respiratory Disorders and Allergies, and TP is the chairholder of the Canada Research Chair in Human Genomics.
Funding
The study is funded by the Canadian Institute of Health research operating grant.
Availability of data and materials Data is available upon request. Authors’ contributions
CL collected the data and managed the SLSJ cohort and conceived and supervised the study. AM analyzed and interpreted the data and wrote the manuscript draft under the supervision of CL. CL, LPB, ML, and TP edited the manuscript. All authors reviewed and approved the final manuscript. Competing interests
The authors declare that they have no competing interests. Consent for publication
Not applicable
Ethics approval and consent to participate
All subjects gave their informed consent, and the project was approved by the research ethic committee of the Centre intégré universitaire de santé et de services sociaux du SLSJ.
Author details
1Department of Human Genetics, McGill University and Genome Quebec
Innovation Centre, 740 Dr. Penfield Avenue, Montréal, Québec H3A 1A5, Canada.2Département des sciences fondamentales, Université du Québec à Chicoutimi, 555 boulevard de l’Université, Saguenay, Québec G7H 2B1, Canada.3Institut Universitaire de Cardiologie et de Pneumologie de Québec,
Université Laval, 2725 chemin Sainte-Foy, Québec, Québec G1V 4G5, Canada.
Received: 6 October 2016 Accepted: 3 January 2017
References
1. Bousquet J, Khaltaev N, Cruz AA, Denburg J, Fokkens WJ, Togias A, Zuberbier T, Baena-Cagnani CE, Canonica GW, van Weel C, et al. Allergic Rhinitis and its Impact on Asthma (ARIA) 2008 update (in collaboration with the World Health Organization, GA(2)LEN and AllerGen). Allergy. 2008;63 Suppl 86:8–160.
2. Dharmage SC, Lowe AJ, Matheson MC, Burgess JA, Allen KJ, Abramson MJ. Atopic dermatitis and the atopic march revisited. Allergy. 2014;69(1):17–27. 3. Bunyavanich S, Schadt EE, Himes BE, Lasky-Su J, Qiu W, Lazarus R, Ziniti JP,
Cohain A, Linderman M, Torgerson DG, et al. Integrated genome-wide association, coexpression network, and expression single nucleotide polymorphism analysis identifies novel pathway in allergic rhinitis. BMC Med Genet. 2014;7:48.
4. Ramasamy A, Curjuric I, Coin LJ, Kumar A, McArdle WL, Imboden M, Leynaert B, Kogevinas M, Schmid-Grendelmeier P, Pekkanen J, et al. A genome-wide meta-analysis of genetic variants associated with allergic rhinitis and grass sensitization and their interaction with birth order. J Allergy Clin Immunol. 2011;128(5):996–1005.
5. Berger SL. The complex language of chromatin regulation during transcription. Nature. 2007;447(7143):407–12.
6. Hannon E, Spiers H, Viana J, Pidsley R, Burrage J, Murphy TM, Troakes C, Turecki G, O’Donovan MC, Schalkwyk LC, et al. Methylation QTLs in the developing brain and their enrichment in schizophrenia risk loci. Nat Neurosci. 2016;19(1):48–54.
7. Banovich NE, Lan X, McVicker G, van de Geijn B, Degner JF, Blischak JD, Roux J, Pritchard JK, Gilad Y. Methylation QTLs are associated with coordinated changes in transcription factor binding, histone modifications, and gene expression levels. PLoS Genet. 2014;10(9):e1004663.
8. Bell JT, Tsai PC, Yang TP, Pidsley R, Nisbet J, Glass D, Mangino M, Zhai G, Zhang F, Valdes A, et al. Epigenome-wide scans identify differentially methylated regions for age and age-related phenotypes in a healthy ageing population. PLoS Genet. 2012;8(4):e1002629.
9. McClay JL, Shabalin AA, Dozmorov MG, Adkins DE, Kumar G, Nerella S, Clark SL, Bergen SE, Swedish Schizophrenia C, Hultman CM, et al. High density methylation QTL analysis in human blood via next-generation sequencing of the methylated genomic DNA fraction. Genome Biol. 2015;16:291. 10. Madore AM, Houde L, Vezina H, Vohl MC, Perusse L, Mior N, Connelly PW,
Laberge C, Gaudet D, Laprise C. Contribution of hierarchical clustering techniques to the modeling of the geographic distribution of genetic polymorphisms associated with chronic inflammatory diseases in the Quebec population. Community Genetics. 2007;10(4):218–26.
11. Madore AM, Prevost C, Dorfman R, Taylor C, Durie P, Zielenski J, Laprise C. Distribution of CFTR mutations in Saguenay-Lac-Saint-Jean: proposal of a panel of mutations for population screening. Genet Med. 2008; 10(3):201–6.
12. Laprise C. The Saguenay-Lac-Saint-Jean asthma familial collection: the genetics of asthma in a young founder population. Genes and Immunity. 2014;15(4):247–55.
13. Thornton T, McPeek MS. Case-control association testing with related individuals: a more powerful quasi-likelihood score test. Am J Hum Genet. 2007;81(2):321–37.
14. Liang L, Willis-Owen SA, Laprise C, Wong KC, Davies GA, Hudson TJ, Binia A, Hopkin JM, Yang IV, Grundberg E, et al. An epigenome-wide association study of total serum immunoglobulin E concentration. Nature. 2015; 520(7549):670–4.
15. Assenov Y, Muller F, Lutsik P, Walter J, Lengauer T, Bock C. Comprehensive analysis of DNA methylation data with RnBeads. Nat Methods. 2014;11(11): 1138–40.
16. Davis SDP, Bilke S, Triche Jr T, Bootwalla M. methylumi: Handle Illumina methylation data, R package version 2.14.0 edn. 2015.
17. Aryee MJ, Jaffe AE, Corrada-Bravo H, Ladd-Acosta C, Feinberg AP, Hansen KD, Irizarry RA. Minfi: a flexible and comprehensive bioconductor package for the analysis of Infinium DNA methylation microarrays. Bioinformatics. 2014;30(10):1363–9.
18. Maksimovic J, Gordon L, Oshlack A. SWAN: subset-quantile within array normalization for Illumina Infinium HumanMethylation450 BeadChips. Genome Biol. 2012;13(6):R44.
19. Smyth GK. Limma: linear models for microarray data. In: Gentleman R, Carey V, Dudoit S, Irizarry R, Huber W, editors. Bioinformatics and computational biology solutions using R and Bioconductor. New York: Springer; 2005. 20. Shabalin AA. Matrix eQTL: ultra fast eQTL analysis via large matrix
operations. Bioinformatics. 2012;28(10):1353–8.
21. Hancock DB, Soler Artigas M, Gharib SA, Henry A, Manichaikul A, Ramasamy A, Loth DW, Imboden M, Koch B, McArdle WL, et al. Genome-wide joint meta-analysis of SNP and SNP-by-smoking interaction identifies novel loci for pulmonary function. PLoS Genet. 2012;8(12):e1003098.
22. Soler Artigas M, Loth DW, Wain LV, Gharib SA, Obeidat M, Tang W, Zhai G, Zhao JH, Smith AV, Huffman JE, et al. Genome-wide association and large-scale follow up identifies 16 new loci influencing lung function. Nat Genet. 2011;43(11):1082–90.
23. Baurecht H, Hotze M, Brand S, Buning C, Cormican P, Corvin A, Ellinghaus D, Ellinghaus E, Esparza-Gordillo J, Folster-Holst R, et al. Genome-wide comparative analysis of atopic dermatitis and psoriasis gives insight into opposing genetic mechanisms. Am J Hum Genet. 2015;96(1):104–20. 24. Li X, Ampleford EJ, Howard TD, Moore WC, Torgerson DG, Li H, Busse WW,
Castro M, Erzurum SC, Israel E, et al. Genome-wide association studies of asthma indicate opposite immunopathogenesis direction from autoimmune diseases. J Allergy Clin Immunol. 2012;130(4):861–8. e867.
• We accept pre-submission inquiries
• Our selector tool helps you to find the most relevant journal
• We provide round the clock customer support
• Convenient online submission
• Thorough peer review
• Inclusion in PubMed and all major indexing services
• Maximum visibility for your research Submit your manuscript at
www.biomedcentral.com/submit