HAL Id: hal-01924025
https://hal-mines-albi.archives-ouvertes.fr/hal-01924025
Submitted on 15 Nov 2018
HAL is a multi-disciplinary open access
archive for the deposit and dissemination of
sci-entific research documents, whether they are
pub-lished or not. The documents may come from
teaching and research institutions in France or
abroad, or from public or private research centers.
L’archive ouverte pluridisciplinaire HAL, est
destinée au dépôt et à la diffusion de documents
scientifiques de niveau recherche, publiés ou non,
émanant des établissements d’enseignement et de
recherche français ou étrangers, des laboratoires
publics ou privés.
Monitoring and analyzing patients’ pathways by the
application of Process Mining, SPC, and I-RTLS
Sina Namaki Araghi, Franck Fontanili, Elyes Lamine, Ludovic Tancerel,
Frederick Benaben
To cite this version:
Sina Namaki Araghi, Franck Fontanili, Elyes Lamine, Ludovic Tancerel, Frederick Benaben.
Mon-itoring and analyzing patients’ pathways by the application of Process Mining, SPC, and I-RTLS.
INCOM 2018 - 16th IFAC Symposium on Information Control Problems in Manufacturing, Jun 2018,
Bergame, Italy. pp.980-985, �10.1016/j.ifacol.2018.08.480�. �hal-01924025�
Sina Namaki Araghi*. Franck Fontanili.* Elyes Lamine.* Ludovic Tancerel.** Frederick Benaben.*
*Industrial Engineering Center, University of Toulouse, IMT Mines Albi, Albi 81000 France (e-mail: firstname.surname@ mines-albi.fr)
**Maple High Tech.CO, Toulouse 31000 France (e-mail: firstname.surname@ maplehightech.com)
Abstract: The strive of healthcare organizations for learning how their processes are influencing the
quality of their services and mostly the satisfaction level of their patients is encouraging this research work to propose a method which provides comprehensive knowledge in that regard for healthcare experts. This paper aims at suggesting an approach to model the pathways of patients as business processes and to measure the performance level of their executions based on the distance that patients take. In this order, Indoor-Real Time Localization Systems (I-RTLS) has been introduced as the tool to monitor patients’ pathways; Process Mining techniques will enrich the level of information by discovering the process models. Statistical Process Control (SPC) methods will help to measure the performance stability of processes. An outline of the approach is highlighted by a study case which had been designed at a hospital in France. The results show that the proposed approach could provide accurate data and comprehensive knowledge about patients’ pathways and the execution of the processes in hospitals.
Keywords: Indoor-Real-Time Localization Systems, Process Mining, Statistical Process Control.
1. INTRODUCTION
Healthcare organizations are pursuing different techniques, technologies and scientific approaches to understand how their processes are being executed and to observe the influence of their decisions on the quality of their services. Clinical or patients’ pathways are highly dependent on the structure of processes in the healthcare organizations. The clinical pathways have been defined as a structured, multidisciplinary care plan which defines the steps of patient care for a certain disease in a specific hospital (Rotter et al., 2012).
The patients’ pathways could contain numerous amount of information such as duration of activities for patients, and the taken distance by the patients, which should be extracted and presented with a meaningful approach. Several methods have been used to improve the management of clinical processes and pathways. It has been indicated that the objective of these methods is to enhance the quality of healthcare services by improving the risk-adjusted patients’ outcome, promoting patients’ safety, increasing patients’ satisfaction, and optimizing of resources (Vanhaecht et al., 2010). Corresponding to this desire of healthcare organizations, this paper describes the possible application of several technologies and techniques to monitor and investigate different aspects of patients’ pathways. The I-RTLS could provide a real-time monitoring of patients, staff, and medical instruments. The output of these systems could be used by process discovery algorithms to generate automatically a model of the patients’ pathways. Consequently, there is no
need to monitor, record and model the process executions manually. Additionally, a set of statistical process control techniques is proposed to enrich the extracted knowledge. The motivation for this work is to equip healthcare experts with capable tools and powerful techniques to facilitate and support their managerial actions.
This paper is structured to identify some aspects of I-RTLS and process mining in section 2. Also, the approach of this paper is identified through a study case in section 3. Finally, a summary and future perspective of the research work is presented in the last section.
2. STATE OF THE ART
2.1 I-RTLS
Indoor-real-time localization systems are emerging in the context of smart healthcare (Kamel Boulos and Berry, 2012) to help healthcare organizations to acquire a location awareness regarding the patients, staff, and their assets. The principle of indoor localization systems is similar to the Global Positioning Systems (GPS) (Van Haute et al., 2016). They consist of two main parts that communicate with each other thanks to a radiofrequency signal. The first component is the mobile nodes or tags which could be attached to the objects that need to be located. Second, satellites (for GPS) or sensors (for indoor localization systems) which find the position of the mobile nodes or tags. Concerning GPS, NAVSTAR satellites are being used to locate the objects in outdoor environments. However, for localizing objects inside
facilities, multiple communication technologies have been suggested. For instance, in hospitals’ environments, RFID (radio frequency identification) and wireless local area networks (Wi-Fi, ZigBee, Z-Wave, Bluetooth, etc) are playing key roles. These technologies are using electromagnetic wave frequencies in different ranges (LF, HG, UHF, UWB). This research work sought the application of a real-time localization system which is able to provide a robust event log related to the patients’ movements. This leads us to explain the applicability of I-RTLS. These systems provide log files which correspond to the coordinates of the objects (x, y, and z) with a given frequency (for example one event per second). Generally, these systems function by three main components:
1. Tags (or signal transmitters): these are the objects that could be attached to patients, staff, or assets. These tags are active that means they would emit signals.
2. Sensors (or anchors, or beacons, or antennas): these devices would receive the signal of the tags. At least three sensors would receive the signal of one tag then transfer it to a location engine in order to calculate the geometric location (x, y, z) of the tag. 3. Location engine: this software would use different
types of algorithms and localization techniques to calculate the positions of tags.
Some of these localization techniques are as follows.
Triangulation, a method to locate radio transmitters and it
could work by measuring different attributes, like radial distance, or direction of the received signal from multiple sources (Cotera et al., 2016). Trilateration, this is a mathematical technique. This approach would calculate the distance of a point from several known geometrical entities. Other similar methods are the Angle of Arrival (AOA), Time
Difference of Arrival (TDOA), and Received Signal Strength Indicator (RSSI). By using RSSI technique an access point or
radio frequency client would receive the signal and measure the strength of it. Calculating the intensity of signals could be useful to position different objects. This method is also being used in RFID infrastructures. However, it could fail in hospital’s building, because of its barriers in passing through heavy walls or finding objects on different floors. Also, it could be influenced by the noises coming from the other devices.
The application of I-RTLS could benefit the healthcare organizations in several ways. For instance, the addition of location awareness could help the healthcare staff to know the exact and real-time position of each patient and the mobile instruments. Also, it could increase the level of safety in the organization. Additionally, by cross-matching the position of tags, it is feasible to monitor which medical device is being used for which patient. This paper aims at applying the localization technology to analyze and monitor the patients’ data (especially related to the patients’ pathways) in real-time, which will be highlighted in the followings.
2.2 Process Mining
The application of process mining is basically concerned with the extraction of knowledge from event logs which are recorded in an information system. Process mining could be categorized as an evidence-based approach which uses the logs related to the execution of processes. Generally, to discover and map the process models there are several approaches such as interview-based, evidence-based, and workshop-based process discovery (Dumas et al., 2013). The interview-based method is related to extracting knowledge on the way processes are being executed in an organization. This method could be extremely time consuming and deceptive, as several actors in a process could have different visions of the process. The workshop-based method is about enriching the maturity of information by discussing different aspects of the process with process owners, stakeholders, and users of the process prior to the modeling phase. Here unlike the interview-based method, the modeler seeks the visions and knowledge of the bigger roles in the organization too, such as the domain experts, and process analysts. The evidence-based approach studies the execution of processes by going through the existing evidence. This evidence could be documentation of the process, observing the process at runtime, and automatic process discovery. The extracted knowledge by process mining is based on three activities: process discovery, conformance checking, and enhancement of business processes (Aalst, 2016).
The evolution of process mining begins with the work of Agrawal et al (Agrawal et al., 1998), where they explained an algorithmic method to generate process flow graphs from executions of processes which have been registered as workflow logs. Cook and Wolf also became one of the pioneers to use process mining techniques on event logs (Cook and Wolf, 1998). Weijters and Van der Aalst enriched the concept of process mining by proposing a discovering technique which deals with the noise and also capable to validate the workflow processes by measuring the differences between the perspective model and the real execution of the process (Weijters and Aalst, 2001).
Currently, the application of process mining in healthcare provides four main perspectives for the experts: control flow, performance, conformance, and organizational perspective (Rojas et al., 2016). The control flow perspective shows the execution of processes. The performance perspective provides an understanding related to the possible bottlenecks in a process and it evaluates performance level of a process. The conformance checking gives a view to compare the designed processes with the real discovered behavior of processes. The organizational perspective helps to see how an organization uses its resources to execute the processes. Process mining in healthcare has mainly received attentions towards designing and applying discovering algorithms. The enhancement aspect of process mining needs to be evolved by the application of robust techniques. Equally, process mining techniques need to be evolved for analyzing patients’ treatment data. As it has been seen in (Yang and Su, 2014) the current process mining techniques are not adequately capable of dealing with unstructured processes such as in
healthcare. This issue is also implied from the previous cases of analyzing patients’ pathways and in general patients’ behavior.
Recently the research team of Pontificia Universidad
Catolica de Chile described several cases of using real-time
location data and process mining for analyzing different aspects of healthcare processes, such as monitoring patients and staff in a hospital (Fernandez-Llatas et al., 2015). In their research work, they have designed a case study in a hospital in Valencia, Spain. They applied the PALIA (parallel activity based log inference algorithm) algorithm to analyze the location data generated by MySphera system. This system uses the ZigBee technology and RSSI method to localize the tags. Moreover, by the application of MY HOSPITAL, they were able to analyze different types of healthcare data. The PALIA algorithm has advantages in dealing with the healthcare data and especially the location data. In their analyses, they described the pathways as process maps and additionally they were able to monitor the accumulated duration that each room has been occupied. Furthermore, Fernandes-Llatas et al. succeeded to analyze the behavior of patients in a nursing home by enriching PALIA algorithm with the eMotiva additional analyzing algorithms (Fernández-Llatas et al., 2013). In their study case, they were able to visualize the execution of processes. Also by applying the heat map analysis, the motions of the patients in the nursing home were monitored.
Miclo presented a similar approach for the application of process mining and real-time location systems (Miclo et al., 2015). Based on their work, it could be inferred that use of process mining and localization systems could help information systems to initially gather events with a higher level of details and as a result, the discovered process models could be more accurate and compatible with reality. They have encountered several challenges during their experiment like the calibration of the system. From their experience, it seems that the configuration of the system and calibration of antennas and tags could be time-consuming. The implemented I-RTLS system was supplied by Purelink which uses RFID-UWB technology.
Nonetheless, the application of process mining for analyzing different steps of processes in hospitals’ sectors is emerging. Recently, Rojas et al applied process mining in ER (emergency rooms) domain and tried to answer the two challenges. First, they have tried to indicate what are the major activities and stages in ER and then the relationships among those different stages have been defined through the application of PALIA tool. Second, they have identified that what is the highest destination for the patients after arriving in ER, which in their case it was the hospitalization (Alvarez et al., 2018).
It could be inferred that most of the work in this area are related to offering observational analyses. These analyses are highly dependent on the discovered process model. However, the quantitative analyses aspect of patients’ processes is not sufficiently evolved. Therefore, the following approach tries to step forward to fill the illustrated gap.
3. DETAILED PROPOSAL AND THE EXPERIMENTAL RESULTS
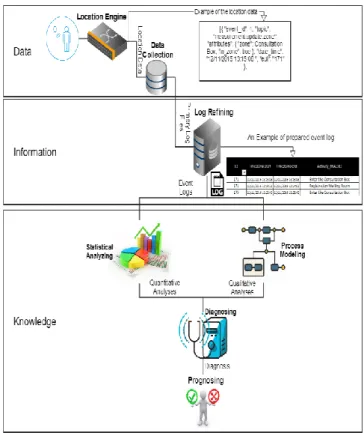
This research work aims at enriching the control-flow and performance evaluation perspectives for analyzing clinical processes by the application of I-RTLS and SPC. These processes are related to the movements of the patients in the hospitals, basically categorized as a part of patients’ pathways. To reach these objectives, an approach had been designed previously to this work. This approach has three main steps known as tracking, modeling, and assessing in (Namaki Araghi et al., 2017). Recently, this approach has been developed with the attention on the hierarchy of data, information, and knowledge (Kanehisa et al., 2014). Figure 1 presents this approach which has three levels. These levels represent the transformation of data to the knowledge through running six functions; data collection, log refining, modeling,
analyzing, diagnosing, and prognosing.
Fig. 1. The approach for monitoring and analyzing patients’ pathways
In the first function (data collection), thanks to the I-RTLS, movements of the patients will be analyzed, and the generated location data by the location engine will be collected in the information system. These sets of data should go through several actions in the log refining function to be prepared as event logs which could be the compatible inputs for modeling and analyzing functions. The log refining function would transform the primary data (as it has been shown by the example) to the usable information. These primary log files consist of noises and inconsistencies which should be removed for discovering the process models. In the modeling and analyzing functions, process models would be
discovered and analyzed thanks to several techniques such as process mining and SPC. The results of these functions would be sets of qualitative and quantitative analyses that could evaluate the performance level of the processes. Simultaneously, by acquiring the process models of pathways, one could see how processes are being executed and what the different steps within each patient’s pathway are. Additionally, in the diagnosing function, several root cause analyses would be performed to extract the reasons behind shortcomings of the processes. After identifying the causes, a simulation model will be generated in the prognosing function. This model would provide different improvement suggestions for enhancing the performance of processes and eventually acquiring a To-Be version of the process. Detailed illustration of all of these functions are beyond the limits of this paper, thus our focus here will be on the modeling and analyzing functions.
To evaluate this approach, an experiment has been designed at a hospital in France. The value of this study case for the hospital was to acquire a method which helps to shorten the duration of medical processes. Additionally, the healthcare experts needed more visibility of the processes within the hospital’s information system.
To carry out this work, several actions had been performed. First and foremost, the map of the facility has been observed carefully and a department has been chosen for monitoring the patients’ pathways. This department (Nutrition and Dietetics) was a proper start for this project since it has the circulation of patients with almost similar profiles and there were not a lot of unexpected situations. Secondly, in each zone of the department, the I-RTLS antennas had been installed. The number of installed antennas for each zone was related to the space and the material inside it. The Maple High Tech system has been used for the data collection phase. It provides the location of the tagged objects thanks to the UWB technology that can use a very low energy level. The transmitted signals would be analyzed in the location engine by the TDOA and AOA measurement techniques. One of the advantages of using this system was in the fast installation of sensors. Essentially there was no need for calibration of tags and antennas, only there was a step of uploading the map of the facility and identifying the virtual zones.
During ten days of this experiment, each day nine tags had been distributed to the patients with almost similar profiles. The reason behind this selection was to see how the pathways could differentiate from each other for the patients with almost an identical medical procedure. Also, this sample size would strengthen the results of further statistical analyses. After monitoring the patients by the localization system, several log files were collected by the location engine. These log files were extracted and recorded in the information system for generating robust event logs. The Transformed event logs contain multiple columns as ID, Timestamp Start, Timestamp End, and Activity Macro which represents the details of the activities related to the presence of patients in an identified zone. Figure 2 shows a summary of the event log for the first day of the experiment.
Fig. 2. The summary of the transformed event log
This event log could be used for process mining to map out the patients’ pathways. For such analyses, Celonis 4
(https://www.celonis.com/) process mining application could
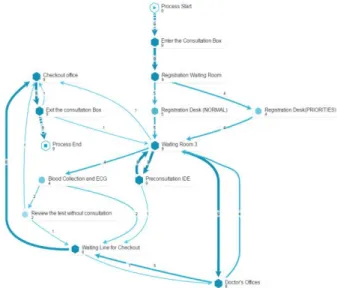
be a powerful tool to provide the process models and basic statistics related to the execution of processes. Figure 3 presents the general process model for representing the patients’ pathways. By the first glance of the process model, one could observe that most of the paths are heading to the “Waiting Room 3” of the department, and it could be seen as the hot zone in this process (with the frequency value of 21 times). Additionally, it is visible that one case after finishing its treatment (at the “Exit the Consultation Box” section) took an unnecessary step by going back to the “Waiting Room 3” which added up the length of stay of the patient in the hospital by an undesired activity. The same scenario happened for another patient after finalizing the administrative works in the “check out office”.
Fig. 3. The process model which represents the patients’ pathways
This control flow perspective could go through several processes diagnosing activities to discover the reasons behind such errors in the process. In this experiment, we observed that patients made a lot of mistakes while following processes’ phases. It could be inferred that it happened because of the misleading signs in the facility.
Moreover, overall statistical analyses of processes provide additional knowledge on the processes. For instance, these analyses indicate that among all the activities in the event log, the “Registration Waiting Room” has the maximum average duration. Patients on average spent one hour and seven minutes in this section. Table 1 presents the analyses based
on the throughput time between two activities. This table presents only four of the slowest steps in the process. For example, 44 percent of cases are affected by the throughput time between registration waiting room and registration desk
(Priorities). By improving these connections, process
throughput time could increase significantly.
Order From To Cases affected
1 Registration Waiting Room Registration Desk
(PRIORITIES)
44 %
2 Registration Waiting Room Registration Desk
(NORMAL)
56 %
3 Doctor’s Office Waiting Room 3 44 %
4 Doctor’s Office Waiting Line for checkout 56%
Table. 1. Bottleneck analyses for the slowest connection between activities in the department and the percentage of
affected cases by these activities.
One of the objectives of this paper is to enrich the performance evaluation perspective by the application of statistical process control for analyzing the distance of patients’ pathways. SPC is being used in the context of analyzing healthcare data (Thor et al., 2007), but not in correspondence with the location data and the patients’ pathways. In following, the application of SPC in this work will be explained.
It is extremely important to decrease the level of variabilities in the processes’ outcome in order to improve the quality. Evaluating the performance of a process either in service or in the manufacturing sector is oriented towards analyzing the capability of processes to execute around a target or nominal dimensions of the quality characteristics of the process. SPC is a powerful collection of problem-solving tools useful in achieving process stability and improving capability through the reduction of variabilities (Montgomery, 2007). The Shewhart control chart is one of the most sophisticated techniques of SPC. The goal of applying SPC is to monitor and analyze the processes in a way to ensure that the clients’ needs are satisfied and the process is not executing with high variabilities.
Typical control charts have three indications, which are known as center-line (CL), upper control limit (UCL), and lower control limit (LCL). These limits are applied horizontally in the control charts and indicate the stability of processes. As long as all the samples of a data set fall between these two lines, it could be inferred that the process is in control and no actions are needed to modify the process’ structure. However, if a sample falls beyond these limits or the chart shows a trend in process’ results to be unstable, then the control chart indicates that the process is out of control and necessary diagnoses actions should take in place.
There are several control charts used for analyzing quantitative and qualitative outcomes of the process. In this paper, R and x̅ -charts are applied to measure the performance of designed patients’ pathways based on the distances that patients take to receive their health care. To set up these analyses, it’s important, to begin with, the R-chart. R-charts would analyze the process variabilities. These analyses will help to set up the x̅ -chart (Montgomery, 2007). The R-chart
shown in figure 4 plots the subgroup ranges. Each subgroup represents one day run of the experiment. Consequently, the horizontal axis presents the days (samples) and the vertical axis shows the statistical summary in which the average range of each sample could variate. The CL is the average of all the subgroups’ ranges. The upper and lower control limits are set at a distance of three standard deviations above and below the center line. They define the limits for expected variations in the subgroups ranges.
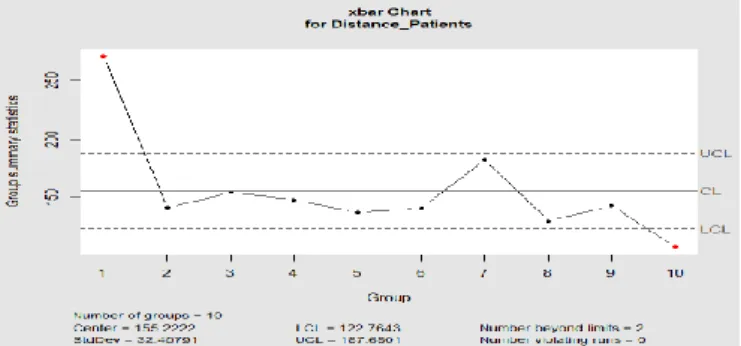
This chart analyzes the range of distances for the patients’ pathways. It shows that variations of ranges for the distances are statistically in control. This indicates we may now construct the x̅ -chart to analyze the stability of the process. Figure 5 shows the x̅ -chart which displays the stability level of the average distance taken by ninety patients. It shows that on average patients walk 96.4 meters in the facility. The red points which are beyond UCL and LCL imply that two of the subgroups are including some assignable causes which are affecting the stability of the process.
Fig. 4. The R control chart for analyzing the variations of pathways’ distances
This chart presents that the distances of patients’ pathways usually were following a similar pattern, however, in two days some abnormality happened that should be investigated. For instance, on the last day of the experiment patients skipped one of the steps in their processes which was the “blood collection”. After observing this problem, it was pointed out that this section in the facility was closed for a couple of hours on that day. This caused for the patients to postponed their treatments to another day and skipped one activity of their processes. These types of causes could affect the quality of services in a hospital and decrease the satisfaction level of the patients. This analysis could be applied in a long run and to observe the behavior of the patients in different time periods.
Fig. 5. The x̅ control chart for analyzing the stability of pathways’ distance
It is feasible to bring the process back to the stability by diagnosing the problems during the first day and the last days of the experiment. However, explaining the diagnosing function of our approach is out of the scope of this paper.
4. CONCLUSIONS
This article aimed at presenting the advantages and possibility of monitoring and analyzing the patients’ pathways by the application of two emerging tools known as I-RTLS and process mining in the context of smart healthcare. It should be mentioned that real-time localization of patients could pave the way for accurate analyses of clinical processes especially patients’ pathways.
The experience gained from the mentioned study case showed that healthcare experts don’t have to spend unnecessary time for gathering and designing a model for patients’ processes. In addition, they have appreciated the visibility of the processes and the information related to the patients’ pathways. The association of process mining and I-RTLS offers a great potential for visualizing and analyzing healthcare processes. On the other hand, the location and process awareness within information system could increase the security of the facility and boost the efficiency level of processes. Finally, by the addition of SPC, we were able to extend the quantitative analysis of the processes. The application of control charts in this paper provides more visibility on the circulation of patients in the hospital’s facility. This method could be used to monitor the clinical pathways to detect even small but clinically important changes in the patients’ processes. This analysis could be applied for the duration of activities, the occupancy rate of different sectors in the hospital, and for monitoring the staff performance level as well. The major value of this paper is on these analyses which are not being used in similar approaches in the literature. Control charts provide robust analyses which could help experts to dive into the enhancement aspect of process mining.
Regarding the obstacles in this approach, there is a social challenge of tracking the staff that should be completely expounded for them in the upcoming studies.
Further research works could be focused on performing diagnosing and prognosing actions to highlight the causes of shortcomings in the processes and to generate the simulation models to extract different improvement opportunities.
REFERENCES
Aalst, W.M.P. van der, 2016. Process Mining: Data Science in Action. Springer.
Agrawal, R., Gunopulos, D., Leymann, F., 1998. Mining process models from workflow logs, in: Advances in Database Technology — EDBT’98, Lecture Notes in Computer Science. Presented at the International Conference on Extending Database Technology, Springer, Berlin, Heidelberg, pp. 467–483.
https://doi.org/10.1007/BFb0101003
Alvarez, C., Rojas, E., Arias, M., Munoz-Gama, J., Sepúlveda, M., Herskovic, V., Capurro, D., 2018. Discovering role interaction models in the Emergency Room using Process Mining. J. Biomed. Inform. 78, 60–77.
https://doi.org/10.1016/j.jbi.2017.12.015
Cook, J.E., Wolf, A.L., 1998. Discovering Models of Software Processes from Event-based Data. ACM Trans Softw Eng Methodol 7, 215– 249. https://doi.org/10.1145/287000.287001
Cotera, P., Velazquez, M., Cruz, D., Medina, L., Bandala, M., 2016. Indoor Robot Positioning Using an Enhanced Trilateration Algorithm. Int. J. Adv. Robot. Syst. 13, 110. https://doi.org/10.5772/63246 Fernández-Llatas, C., Benedi, J.-M., García-Gómez, J.M., Traver, V., 2013.
Process Mining for Individualized Behavior Modeling Using Wireless Tracking in Nursing Homes. Sensors 13, 15434–15451. https://doi.org/10.3390/s131115434
Fernandez-Llatas, C., Lizondo, A., Monton, E., Benedi, J.-M., Traver, V., 2015. Process Mining Methodology for Health Process Tracking Using Real-Time Indoor Location Systems. Sensors 15, 29821– 29840. https://doi.org/10.3390/s151229769
Fundamentals of Business Process Management | Marlon Dumas | Springer, n.d.
Kamel Boulos, M.N., Berry, G., 2012. Real-time locating systems (RTLS) in healthcare: a condensed primer. Int. J. Health Geogr. 11, 25. https://doi.org/10.1186/1476-072X-11-25
Kanehisa, M., Goto, S., Sato, Y., Kawashima, M., Furumichi, M., Tanabe, M., 2014. Data, information, knowledge and principle: back to metabolism in KEGG. Nucleic Acids Res. 42, D199–D205. https://doi.org/10.1093/nar/gkt1076
Miclo, R., Fontanili, F., Marquès, G., Bomert, P., Lauras, M., 2015. RTLS-based Process Mining: Towards an automatic process diagnosis in healthcare, in: 2015 IEEE International Conference on
Automation Science and Engineering (CASE). Presented at the 2015 IEEE International Conference on Automation Science and Engineering (CASE), pp. 1397–1402.
https://doi.org/10.1109/CoASE.2015.7294294
Montgomery, D.C., 2007. Introduction to statistical quality control. John Wiley & Sons.
Namaki Araghi, S., Fontanili, F., Lamine, E., Benaben, F., 2017. An automatized data extraction approach for process mining and business process analysis. IFAC 2017 5.
Rojas, E., Munoz-Gama, J., Sepúlveda, M., Capurro, D., 2016. Process mining in healthcare: A literature review. J. Biomed. Inform. 61, 224–236. https://doi.org/10.1016/j.jbi.2016.04.007
Rotter, T., Kinsman, L., James, E., Machotta, A., Willis, J., Snow, P., Kugler, J., 2012. The effects of clinical pathways on professional practice, patient outcomes, length of stay, and hospital costs: Cochrane systematic review and meta-analysis. Eval. Health Prof. 35, 3–27. https://doi.org/10.1177/0163278711407313
Thor, J., Lundberg, J., Ask, J., Olsson, J., Carli, C., Härenstam, K.P., Brommels, M., 2007. Application of statistical process control in healthcare improvement: systematic review. Qual. Saf. Health Care 16, 387–399. https://doi.org/10.1136/qshc.2006.022194 Van Haute, T., De Poorter, E., Crombez, P., Lemic, F., Handziski, V.,
Wirström, N., Wolisz, A., Voigt, T., Moerman, I., 2016. Performance analysis of multiple Indoor Positioning Systems in a healthcare environment. Int. J. Health Geogr. 15, 7.
https://doi.org/10.1186/s12942-016-0034-z
Vanhaecht, K., Sermeus, W., Peers, J., Lodewijckx, C., Deneckere, S., Leigheb, F., Decramer, M., Panella, M., 2010. The impact of care pathways for exacerbation of Chronic Obstructive Pulmonary Disease: rationale and design of a cluster randomized controlled trial. Trials 11, 111. https://doi.org/10.1186/1745-6215-11-111 Weijters, A.J.M.M., Aalst, W.M.P. van der, 2001. Process Mining
Discovering Workflow Models from Event-Based Data, in: Proceedings of the ECAI Workshop on Knowledge Discovery and Spatial Data. pp. 283–290.
Yang, W., Su, Q., 2014. Process mining for clinical pathway: Literature review and future directions, in: 2014 11th International Conference on Service Systems and Service Management (ICSSSM). Presented at the 2014 11th International Conference on Service Systems and Service Management (ICSSSM), pp. 1–5. https://doi.org/10.1109/ICSSSM.2014.6943412