Full Terms & Conditions of access and use can be found at
http://www.tandfonline.com/action/journalInformation?journalCode=gaan20
Archives of Animal Nutrition
ISSN: 1745-039X (Print) 1477-2817 (Online) Journal homepage: http://www.tandfonline.com/loi/gaan20
Effects of inulin supplementation to piglets in the
suckling period on growth performance, postileal
microbial and immunological traits in the suckling
period and three weeks after weaning
Bing Li, Martine Schroyen, Julie Leblois, José Wavreille, Hélène Soyeurt,
Jérôme Bindelle & Nadia Everaert
To cite this article: Bing Li, Martine Schroyen, Julie Leblois, José Wavreille, Hélène Soyeurt, Jérôme Bindelle & Nadia Everaert (2018) Effects of inulin supplementation to piglets in the suckling period on growth performance, postileal microbial and immunological traits in the suckling period and three weeks after weaning, Archives of Animal Nutrition, 72:6, 425-442, DOI: 10.1080/1745039X.2018.1508975
To link to this article: https://doi.org/10.1080/1745039X.2018.1508975
Published online: 30 Aug 2018.
Submit your article to this journal
Article views: 76
E
ffects of inulin supplementation to piglets in the suckling
period on growth performance, postileal microbial and
immunological traits in the suckling period and three weeks
after weaning
Bing Lia, Martine Schroyena, Julie Leblois a,b, José Wavreillec, Hélène Soyeurtd, Jérôme Bindelle aand Nadia Everaerta
aPrecision livestock and nutrition unit, Gembloux Agro-Bio Tech, Teaching and Research Centre, University
of Liège, Gembloux, Belgium;bResearch Foundation for Industry and Agriculture, Fonds De La Recherche
Scientifique - FNRS, Brussels, Belgium;cDepartment of Production and Sectors, Walloon Agricultural
Research Centre, Gembloux, Belgium;dLaboratory of statistics, informatics and modelling applied to
bioengineering, agrobiochem department, Gembloux Agro-Bio Tech, Teaching and Research Centre, University of Liège, Gembloux, Belgium
ABSTRACT
The aim of this study was to investigate the effect of inulin (IN) supplementation to suckling piglets at and 3 weeks post-weaning. A total of 72 newborn piglets were used. Twenty-four piglets per group received different amounts of IN during the suckling period: (a) CON: no IN; (b) IN-0.5: 0.5 g IN/d on the 1st week, 1 g IN/d on the 2nd week, 1.5 g IN/d on the 3rd week and 2 g IN/d on the 4th week, or (c) IN-0.75: 0.75 g IN/d on the 1st week, 1.5 g IN/d on the 2nd week, 2.25 g IN/d on the 3rd week and 3 g IN/d on the 4th week. Starting at 28 d of age, piglets were weaned and received a post-weaning diet without inulin during the following 3 weeks. At both 28 d and 49 d of age, piglets were euthanised for sampling. Piglets of group IN-0.5 had the highest body weight starting from the 3rd week (p < 0.05), concomitant with the highest villus height and the ratio of villus height/crypt depth in the jejunum and ileum on both sampling days (p < 0.05). At 28 d of age, an increased concentration of propionate, iso-butyrate or total short chain fatty acids was observed between treatment IN-0.5 and the other groups in the caecum or colon (p < 0.05). Moreover, the relative abundance of Escherichia coli (p = 0.05) and Enterobacteriaceae (p = 0.01) in colonic digesta were reduced in 0.5-treated piglets, and in both IN-supplemented groups, colonic interleukin-8, tumor necrosis fac-tor-α and toll-like receptor-4 mRNA abundance were decreased compared to the CON group (p < 0.05). However, at 49 d of age, most of these differences disappeared. In conclusion, treatment IN-0.5 improved during the suckling period of piglets development of intestine, but these beneficial effects were not lasting after wean-ing, when IN supplementation was terminated. Treatment IN-0.75, however, did not display a prebiotic effect.
ARTICLE HISTORY
Received 27 April 2018 Accepted 2 August 2018
KEYWORDS
Gut health; intestinal microbiota; inflammation; inulin; suckling piglets
CONTACTNadia Everaert nadia.everaert@ulg.ac.be https://doi.org/10.1080/1745039X.2018.1508975
1. Introduction
Weaning is often a stressful period for piglets, resulting in post-weaning diarrhoea, followed by impaired growth performance and a high mortality rate. An approach to overcome these issues is through the dietary administration of prebiotics to modify gut microbiota (Angelakis2017). Prebiotics are non-digestible food ingredients that selectively stimulate the growth and activity of beneficial bacteria in the large intestine, thereby improving host’s health (Gibson et al. 2004). Inulin is an example of a prebiotic that is composed of a mixture of oligomers and polymers in which the degree of polymerisation (DP) varies from 2 to approximately 60 units with an average DP of 12 (Gibson et al.2004). Inulin is primarily extracted from chicory root and Jerusalem artichoke, which has been found to enhance the abundance of Bifidobacterium and Lactobacillus in pigs (Tzortzis et al. 2005; Tako et al.2008; Patterson et al.2010). In addition, when inulin is fermented in the large intestine, the production of short-chain fatty acids (SCFA) is increased. Increased SCFA leads to a lower pH in the large intestine, reducing the growth of some pathogenic bacteria (Wang and Gibson1993). In addition, SCFA has a trophic effect on the intestinal epithelium, which has been shown to ameliorate the development of intestinal mucosal architecture (Hosseini et al.2011; Wang et al.2012). The intestine contains gut-associated lymphoid tissues (Pabst et al.2008); hence, the altered SCFA profile (e.g. butyrate) and microbiota (e.g. Bifidobacterium or Lactobacillus) might also influence the immune response by modulating the mRNA abundance of cytokines as well as other immune mediators (O’Mahony et al. 2005; Place et al.2005; Lomax and Calder2008; Uematsu et al.2008; Shukla et al.2016).
Many studies reported various beneficial effects of inulin in the diet of weaned pigs (O’Shea et al.2012; Grela et al.2013); however, little is known about the function of inulin in suckling piglets. In pigs, the maturation and colonisation of the intestine starts from birth onwards. Intestinal development is unfortunately disturbed during the weaning period (Everaert et al.2017). Interestingly, a dose‒response effect of prebiotics has been found in human and chickens, where an excessive amount resulted in a poor growth performance (Roberfroid et al.1998; Rao1999; Tuohy et al.2003; Xu et al.2003). Unfortunately, these time frame and dose-dependent effects remain uncharacterised in pigs. Hence, identifying the most beneficial dose and time window of inulin administration is crucial to optimise intestinal health management and feeding strategies. It was hypothesised that the adminis-tration of inulin during the suckling period might programme the development of the intestine in suckling piglets in a dose-dependent way. In this study, different amounts of inulin were force-fed to piglets only during the suckling period to investigate the effect of differing amounts of inulin on body weight (BW), gut morphology, SCFA profile of the large intestine, selected colonic bacteria and mRNA abundance of inflammatory markers in suckling piglets. Growth parameters of piglets were followed for 3 weeks after weaning and additional intestinal health parameters were measured at this point to evaluate whether the early programming of inulin resulted in lasting effect beyond the treatment period.
2. Materials and methods
The animal experiment was approved by the University of Liège ethical committee (ethical protocol 1640, Belgium), and all procedures were in compliance with Belgian and European
regulations. The experiment with suckling piglets was performed at the Walloon Agricultural Research Center (Gembloux, Belgium), and the weaned piglets were transferred to facilities at Gembloux Agro-Bio Tech (Gembloux, Belgium) to continue the experiment.
2.1. Animals, diets and experimental design
Seventy-two newborn piglets, 6 piglets (3 males and 3 females) per litter from 12 litters (Piétrain × Landrace, birth weight: 1.29 ± 0.02 kg) were used in this study. Piglets were selected based on their initial BW. Average litter size was 12 piglets with a birth weight of 1.26 ± 0.02 kg. Piglets not meeting the BW criterion stayed with the sow, but were not used in this study. Male piglets were castrated. Treatments were assigned with regard to the sow’s consanguinity (all sows came from the same sire line), parity (four sows per treatment, two sows of parity 1 and two sows of parity 2 per treatment) and BW (BW of sows were balanced). From the selected piglets, 6 per litter (n = 24 per group) were assigned to 1 of 3 inulin treatment groups during the suckling period. The three treatments included (a) CON: no inulin, (b) IN-0.5: inulin supplementation at 0.5 g/d on the 1st week, 1 g/d on the 2nd week, 1.5 g/d on the 3rd week and 2 g/d on the 4th week, or (c) IN-0.75: inulin supplementation at 0.75 g/d on the 1st week, 1.5 g/d on the 2nd week, 2.25 g/d on the 3rd week and 3 g/d on the 4th week. As it was assumed that the inulin treatment would affect the microbiota of the piglets, and in order to avoid cross-contamination of microbiota between treatments, only one treatment per litter was applied. Inulin was provided as Fibruline Instant by COSUCRA (Warcoing, Belgium). This inulin is composed of linear chains of fructose units with one terminal glucose unit with a degree of DP ranging from 2 to 60 units and an average DP of about 10. Three deionised aqueous solutions of inulin (0% inulin, 20% inulin or 30% inulin) were prepared and orally administered to the piglets by a syringe via mouth twice per day at 09:00 h and 15:00 h. A total of 2.5 ml/d was given during the 1st week, 5 ml/d during the 2nd week, 7.5 ml/d during the 3rd week and 10 ml/d during the 4th week. Thus, piglets from the CON group received 0% inulin solution, the IN-0.5 group received the 20% inulin solution, while the IN-0.75 group received the 30% inulin solution. At weaning (28 d of age), 24 piglets (n = 8 per group) were sacrificed and the remaining piglets were weaned in pairs and allocated into 24 pens (1 male and 1 female sibling per pen). Forced inulin feeding ceased at weaning and a weaning diet devoid of inulin and meeting NRC (2012) recommendations for growth was supplied to all the piglets (Table 1). Diet and water were provided ad libitum throughout the whole experimental period. No other supplements such as prebiotics or probiotics, organic acids, or essential oils were added to the weaning diet; no antibiotics were given to the sows or piglets during the whole experiment. Rearing environments were kept consistant with ambient temperature maintained at 28°C before weaning and 22°C after weaning.
2.2. Sample collection
The BW of piglets was recorded weekly starting at birth and feed intake was recorded weekly from weaning onwards. Two piglets per litter at 28 d of age (n = 8 per group) and 1 piglet per pen at 49 d of age (n = 8 per group) were anesthetised by isoflurane, and then euthanised by exsanguination. The gastrointestinal tract was removed within 5 min after exsanguination. Five-centimeter jejunal and ileal segments were taken and stored in 4% paraformaldehyde for
gut morphology analyses. Digesta from the caecum and colon were collected and snap frozen in liquid nitrogen and then stored at−80°C until further SCFA and microbiota analysis. The colon tissue was collected and rinsed with ice-cold sterile Dulbecco’s Modified Eagle Medium (Sigma, St Louis, Missouri, USA) and dissected using a 6-mm-diameter biopsy punch (Vtrade, Belgium). The biopsies were placed in 6-well round-bottom cell culture plate containing William’s E medium (Sigma) supplemented with fetal bovine serum (Sigma), glucose (Sigma), alanine-glutamine (Sigma), gentamycin (Sigma), penicillin and streptomy-cin (Sigma). All samples were incubated at 37°C and 5% CO2for 2 h (Smith et al.2011; Bahar et al.2012; Leonard et al.2012). Tissue was collected and snap frozen in liquid nitrogen until stored at−80°C prior to RNA extraction.
2.3. Gut morphology
Samples were fixed in 4% paraformaldehyde for 48 h and stored at 70% ethanol before embedded in paraffin. Using a microtome, paraffin-embedded samples were sliced into 5-μm sections and then stained with hematoxylin and eosin. Villus height and crypt depth of 15 well-oriented villi and associated crypts per animal were measured at 4× magnification using
Table 1.Composition and nutrient content of weaning diet.
Ingredient [g/kg] Barley 300.0 Wheat 134.5 Maize 50.0 Oatflaked 50.0 Soybean 150.0 Soybean meal 140.2 Potato protein 20.0 Bread meal 50.0 Soybean oil 6.7 Bonilac# 46.7 Limestone 10.6 Monocalciumphoshpate 10.0 NaCl 5.4 DL-Methionine 1.6 L-Lysine HCl 4.7 L-Threonine 1.1
Sweet whey powder 2.0
Vitamin D3 0.8 Lys/Trp mix* 0.2 Vitamin E 3.2 Premix& 4.0 Phytase 3.3 Titanium dioxide 5.0
Nutrient composition analysed [g/kg]
Crude protein 226.0
Ether extract 61.7
Neutral detergentfibre 122.0
Acid detergentfibre 41.3
Gross energy [MJ/kg] 19.3
#
Bonilac: 90% sweet whey powder with 10% coconut oil; *combination of 18.5% lysine and 5% tryptophan with grains (wheat/maize) and wheat bran carrier; &Provided per kg of feed:
3.8 mg Cu, 20.0 mg Fe, 15.5mg Zn, 6.0 mg Mn, 0.5 mg Se, 0.1 mg I, 1625 IU vitamin A, 1.0 mg vitamin B2, 7.5 mg niacin, 2.3 mg pantothenic acid, 400 IU vitamin D3, 12.5 mg vitamin E,
an OLYMPUS BX51 microscope and soft imaging system (Olympus Corporation, Hamburg, Germany).
2.4. SCFA analysis
A mixture of caecal or colonic digesta and water 1:4 (wt/wt) was homogenised for 30 s and centrifuged at 13,000 g for 15 min. After centrifugation, 1 ml of supernatant was collected and the pH was adjusted to pH 2–3 using 1N H2SO4. The supernatant wasfiltered through a sterile acetatefilter. Acetate, propionate, butyrate, valerate, iso-butyrate and iso-valerate concentrations were analysed by high-performance liquid chromatography, using a Waters systemfitted with an Aminex HPX-87H column (Bio-Rad, Hercules, CA, USA) combined with a UV detector (210 nm), using sulphuric acid (5 mM) as mobile phase and aflow rate of 0.6 ml/min. In addition, the dry matter of caecal and colonic digesta were determined after drying at 105°C for 24 h (method 967.03, AOAC1990)
2.5. Semiquantitative determination of colonic selected bacteria groups
Bacterial content was determined as described by Barszcz et al. (2016). Total DNA of colonic digesta was extracted using the QIAamp DNA Stool Mini Kit (Qiagen, Hilden, Germany) following the manufacturer’s recommendations but adding a bead-beating step. Samples were quantified and tested for purity using a NanoDrop 2000 (Thermo Scientific, USA) and integrity was tested on a 1% agarose gel. The polymerase chain reaction (PCR) mixture contained 2μl of isolated DNA (100 ng), 10 μl of SYBR Premix EX TaqTM II, 0.4 μl of ROX Reference Dye II (50 ×) (SYBR Premix EX TaqTM II (Tli RNaseH plus), Takara, Japan), 1μl of each primer and 5.6μl of nuclease-free water. The PCR protocol was performed using an ABI StepOnePlus (Applied Bio systems, USA) system with the following programme: 30 s heating at 95°C, then followed by 40 cycles of denaturation (5 s at 95°C), annealing (30 s at 60° C) and extension (45 s at 72°C). A melting curve analysis was performed to check the specificity of the primers and a standard curve was determined to ensure amplification efficiencies between 90% and 110%. Primer sequences and efficiencies are shown in Table 2. The 2−ΔΔCtmethod was performed to analyse the selected bacteria, using the control group as 1.0 level after normalisation, where a pooled sample created by mixing all the samples of DNA was used as the calibrator sample (Bustin et al.2009).
2.6. Colonic mRNA abundance
Total RNA of colonic tissue was extracted using InnuPREP RNA Mini Kit (Analytik JenaAG, Germany) and samples were quantified and tested for purity using a NanoDrop 2000 (Thermo Scientific, USA) (A260/A280 ≈ 2.0). The RNA integrity was tested on a 1% agarose gel (28S:18S area). Unfortunately, due to an operational error, two samples for the colonic mRNA abundance in groups IN-0.5 and IN-0.75 were lost respectively, which made eight samples in the CON group and six samples in the IN-0.5 and IN-0.75 groups. For each sample, 0.95 µg RNA was synthesised as single-stranded cDNA with PrimeScript RT Reagent Kit with gDNA Eraser (Perfect Real Time) kit (Takara, Japan) following the manufacturer’s recommendations. The PCR mixture
contained 2μl of cDNA, 10 μl of SYBR Premix EX TaqTM II, 0.4 μl of ROX Reference Dye II (50×) (SYBR Premix EX TaqTM II (Tli RNaseH plus), Takara, Japan), 1μl of each primer and 5.6μl of nuclease-free water. The PCR protocol was performed using an ABI StepOnePlus (Applied Bio systems, USA) system with the following pro-gramme: 30 s heating at 95°C, then followed by 40 cycles of denaturation (5 s at 95° C), annealing (30 s at 60°C) and extension (30 s at 72°C). The mRNA abundance of interleukin (IL)-6, IL-8, IL-10, tumor necrosis factor-α (TNF-α) and toll-like receptor-4 (TLR4) were determined. Three reference genes β-actin (ACTB), β2-microglobulin (B2M) and peptidylprolyl isomerase A (PPIA) were tested and their stability was determined using the GeNorm software. The two most stable reference genes were ACTB (suckling period: M-value = 0.058 and after weaning: M-value = 0.600) and PPIA (suckling period: M-value = 0.057 and after weaning: M-value = 0.637); thus, they were used as the reference genes in this study. A melting curve analysis was performed to check the specificity of the primers and a standard curve was determined to ensure amplification efficiencies between 90% and 110%. Primer sequences and efficiencies are shown in Table 2. The 2−ΔΔCt method was performed to analyse the selected genes, using the control group as 1.0 level after normalisation, where a pooled sample created
Table 2.Primer information for quantitative RT-PCR assays.
Bacteria/Gene 5ʹ-primer-3ʹ*
Accession number/ Reference
Efficiency [%]
β-actin F:GGACTTCGAGCAGGAGATGG U07786 96
R:GCACCGTGTTGGCGTAGAGG
PPIA# F:TAACCCCACCGTCTTCTT AF14571 101
R:TGCCATCCAACCACTCAG Interleukin-6 F:CCTCTCCGGACAAAACTGAA NM_001252429.1 99 R:TCTGCCAGTACCTCCTTGCT Interleukin-8 F:GCTCTCTGTGAGGCTGCAGTTC NM_213867 104 R:AAGGTGTGGAATGCGTATTTATGC Interleukin-10 F:CTGCCTCCCACTTTCTCTTG NM_214041.1 100 R:TCAAAGGGGCTCCCTAGTTT
Toll-like receptor-4 F:CCTGACAACATCCCCACATCA UM_001113039 95 R:TGCTCTGGATAGTGGTAAAAGC
TNF-α† F:ACTGCACTTCGAGGTTATCGG NM_214022 99 R:GGCGACGGGCTTATCTGA
Universal F:CGTGCCAGCCGCGGTAATACG Amit-Romach et al. (2004)
97 R:GGGTTGCGCTCGTTGCGGGACTTAACCCAACAT
Lactobacillus F:CATCCAGTGCAAACCTAAGAG Amit-Romach et al. (2004)
101 R:GATCCGCTTGCCTTCGCA
Bifidobacterium F:CGGGTGCTICCCACTTTCATG Barroso et al. (2015) 105 R:GATTCTGGCTCAGGATGAACG
Clostridium F:AAAGGAAGATTAATACCGCATAA Amit-Romach et al. (2004)
92 R:ATCTTGCGACCGTACTCCCC
Clostridium clusters IV
F:GCACAAGCAGTGGAGT Pieper et al. (2012) 96 R:CTTCCTCCGTTTTGTCAA
Clostridium clusters XIVa
F:AAATGACGGTACCTGACTAA Pieper et al. (2012) 98 R:CTTTGAGTTTCATTCTTGCGAA
Bacteroidetes F:CRAACAGGATTAGATACCCT De Gregoris et al. (2011) 98 R:GGTAAGGTTC CTCGCGTAT
Firmicutes F:TGAAACTYAA AGGAATTGACG De Gregoris et al. (2011) 98 R:ACCATGCACC ACCTGTC
Escherichia coli F:GGGAGTAAAGTTAATACCTTTGCTC Amit-Romach et al. (2008)
91 R:TTCCCGAAGGCACATTCT
Enterobacteriaceae F:ATGGCTGTCGTCAGCTCGT Tegtmeier et al. (2016) 101 R:CCTACTTCTTTTGCAACCCACTC
#
by mixing all the samples of cDNA served as the calibrator sample (Bustin et al.2009; Everaert et al. 2013).
2.7. Statistical analysis
Piglet BW was analysed with an analysis of variance method using SAS software (SAS 9.2, Inc, USA) with mixed procedure. A repeated measures model was used to study the effect of treatment and age for BW. Treatment and age were considered asfixed effects. Litter was considered as a random effect. The piglet was considered as the repeated effect. Two piglets per group died, and another two piglets of the IN-0.5 group had a low BW (6 kg at 49 d of age). Hence, 64 piglets (n = 22 for CON; n = 20 for group 0.5 and n = 22 for group IN-0.75) remained in the experiment during the suckling period to use for BW analysis. As 24 piglets were sacrificed at 28 d of age, 40 piglets remained on the experiment after weaning (n = 14 for CON; n = 12 for IN-0.5 and n = 14 for IN-0.75). The data of gut morphology, SCFA, colonic microbiota and mRNA abundance were subjected to an analysis of variance method using SPSS software (IBM SPSS Statistics 21) with general linear model procedure, comparing the CON group to the other two inulin-treated groups. Significant differences among group means were determined by Duncan’s multiple range test. Outliers were excluded from the analysis when their value differed more than mean ± 3 standard deviation (Howell1998). The results were presented as means ± standard error of mean (SEM) and were considered statistically significant at p ≤ 0.05.
3. Results
3.1. Growth performance
There was no difference in the feed intake of sows between treatments during the suckling period (data not shown). The BW of the various groups was characterised by a significant interaction between treatment and age (p < 0.01). On the 3rd week, BW of piglets in the IN-0.5 group was higher than that in the IN-0.75 group, with the CON group having an intermediate value (p = 0.04) (Figure 1). Starting from the 4th week until the end of the experiment, a higher BW was observed in piglets of group IN-0.5 than in piglets of groups CON and IN-0.75 (p < 0.05). Piglets in the IN-0.75 group never differed from the CON group. No effect of treatment was observed on feed intake of piglets during the post-weaning period (data not shown).
3.2. Gut morphology
At 28 d of age, the IN-0.5 group showed the highest jejunal and ileal villus height compared to the CON and IN-0.75 groups (p < 0.01), with the IN-0.75 group having a higher ileal villus height compared to the CON group (p < 0.01) (Table 3). The results of crypt depth in both jejunum and ileum were not affected by dietary treatment. Compared to the CON group, only the IN-0.5 group increased the ratio of villus height/crypt depth (V/C) in the jejunum (p < 0.01), whereas in the ileum, a higher ratio of V/C occurred in both inulin-groups (p < 0.01).
At 49 d of age, the IN-0.5 group still had a higher villus height in the jejunum compared to the other two groups (p < 0.01). However, the ileal villus height in the IN-0.5 group was only higher when compared to the IN-0.75 group (p < 0.01). No difference in crypt depth was observed in the jejunum (p = 0.50); however, piglets from inulin-treated groups showed a lower ileal crypt compared to piglets from the CON group (p < 0.01). The V/C ratio followed a similar trend at 49 d of age as was observed at 28 d of age, in both jejunum (p < 0.01) and ileum (p < 0.01).
3.3. SCFA analysis
The digesta dry matter of caecum and colon was determined and there was no effect of treatment observed (Table 4). In addition, the concentrations of SCFA in the caecal and colonic digesta were not affected by inulin supplementation when adjusted for caecal and colonic digesta dry matter at either 28 or 49 d of age (data not shown).
Age of piglets [weeks]
0 1 2 3 4 5 6 7 ] g k[ t h gi e w y d o B 0.0 2.0 4.0 6.0 8.0 10.0 12.0 14.0 CON IN-0.50 IN-0.75 & * * * *
Figure 1.Effect of inulin on the body weight of pigs from 0 to 7 weeks of age.
Values are means ± SEM, n = 20–22 during the suckling period and n = 12–14 after weaning;&Group IN-0.5 significantly different vs. group IN-0.75 (p ≤ 0.05); *Group IN-0.5 significantly different vs. groups CON and IN-0.75. Table 3. Effect of inulin on the villus height, crypt depth and villus height/crypt depth ratio (V/C ratio) in the jejunum and ileum of pigs at 28 d and 49 d of age.
28 d of age 49 d of age
CON IN-0.50 IN-0.75 SEM p-Value CON IN-0.50 IN-0.75 SEM p-Value Villus height [μm] Jejunum 403b 527a 398b 13.9 < 0.01 436b 480a 440b 6.74 < 0.01 Ileum 315c 416a 355b 11.5 < 0.01 373ab 403a 346b 7.87 < 0.01 Crypt depth [μm] Jejunum 263 225 231 9.10 0.19 282 282 291 3.67 0.50 Ileum 187 204 177 5.07 0.08 262a 226b 215b 6.67 < 0.01 V/C ratio Jejunum 1.57b 2.35a 1.77b 0.09 < 0.01 1.55b 1.70a 1.51b 0.03 < 0.01 Ileum 1.70b 2.06a 2.03a 0.06 < 0.01 1.43b 1.78a 1.63a 0.05 < 0.01
Values are means, 6–8 pigs per group after removing outliers, and 15 units per pig;a-cmeans in the same row not
However, based on the digesta fresh matter, the SCFA profile differed at 28 d of age. The caecal digesta of piglets of group IN-0.5 had a higher concentration of propionate (p = 0.01) and iso-butyrate (p = 0.03) compared to the piglets receiving the CON and IN-0.75 diets. In the colonic digesta, feeding diet IN-0.5 increased the concentration of total SCFA (p = 0.03) and iso-butyrate (p = 0.03) compared to the other two groups. The IN-0.5 group also showed an increased concentration of propionate compared to the IN-0.75 group (p = 0.01), with the CON group having an intermediate value. At 49 d of age, the only observed difference was related to total SCFA in the colonic digesta, which was higher in the CON and IN-0.5 groups compared to the IN-0.75 group (p = 0.03).
3.4. Gut microbiota
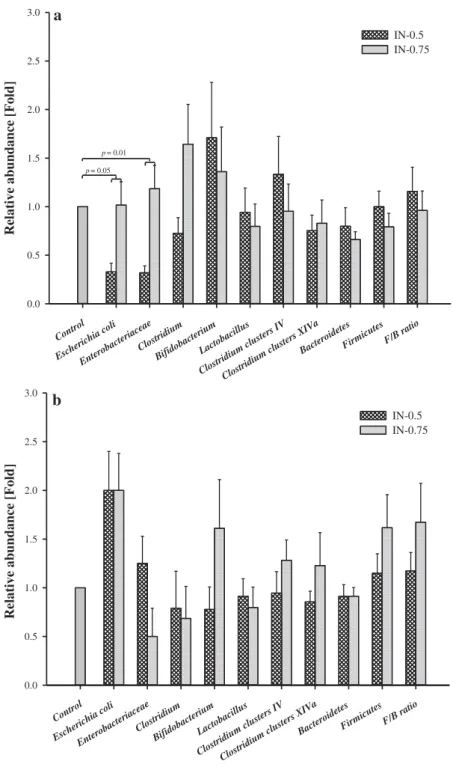
With regard to the bacterial populations in the colonic digesta (Figure 2), the relative abundance of Bifidobacterium, Lactobacillus, Clostridium, Clostridium clus-ters IV, Clostridium clusclus-ters XIVa, Bacteroidetes, Firmicutes and the ratio of Firmicutes/Bacteroidetes (F/B ratio) did not differ between the dietary treatments at 28 d of age. However, in the IN-0.5 group, a reduced relative abundance of Escherichia coli (p = 0.05) and Enterobacteriaceae (p = 0.01) was observed compared to the CON and IN-0.75 groups. This difference disappeared at 49 d of age.
3.5. Colonic mRNA abundance
The administration of inulin affected the mRNA abundance of IL8, TNF-α and TLR4 with lower values in both inulin-groups compared to the CON group (p < 0.05) at 28 d
Table 4. Effect of inulin on the profile of short chain fatty acids (SCFA) [mmol/l fresh intestinal contents] in the caecal and colonic digesta of pigs at 28 d and 49 d of age.
28 d of age 49 d of age
CON IN-0.50 IN-0.75 SEM p-Value CON IN-0.50 IN-0.75 SEM p-Value Caecum Total SCFA 155.35 158.11 146.48 2.82 0.21 163.00 155.72 148.93 3.48 0.26 Acetate 79.05 80.78 78.04 2.76 0.93 73.61 72.28 66.37 3.14 0.64 Propionate 26.99b 30.34a 25.40b 0.72 0.01 36.35 40.32 31.56 2.04 0.22 Butyrate 17.74 17.48 14.83 0.74 0.20 17.85 13.25 11.78 1.35 0.16 iso-butyrate 3.45b 4.62a 3.52b 0.21 0.03 1.53 1.60 0.70 0.21 0.12 Valerate 8.73 10.43 8.97 0.43 0.21 15.98 19.05 15.46 0.98 0.29 Iso-valerate 3.65 4.56 4.45 0.22 0.21 1.16 1.74 2.37 0.07 0.41 Dry matter [%] 19.17 19.44 19.85 0.55 0.85 10.59 11.00 10.20 0.39 0.72 Colon Total SCFA 104.92b 131.49a 95.07b 5.93 0.03 148.72a 144.44a 122.55b 4.63 0.03 Acetate 57.40 59.45 46.89 3.54 0.32 78.12 73.42 69.04 2.00 0.18 Propionate 21.32ab 26.46a 17.14b 1.32 0.01 31.99 31.68 26.75 1.50 0.29 Butyrate 13.54 11.33 11.37 0.67 0.30 13.44 15.48 11.29 0.99 0.23 Iso-butyrate 2.13b 2.81a 2.01b 0.14 0.03 1.58 1.60 1.41 0.08 0.61 Valerate 6.30 7.61 6.25 0.55 0.55 8.02 8.50 6.69 0.39 0.15 Iso-valerate 3.39 3.46 2.76 0.19 0.29 1.29 1.57 1.47 0.14 0.75 Dry matter [%] 20.30 20.62 20.93 0.54 0.90 11.34 12.19 11.16 0.39 0.54 Values are means, n = 6–8 per group after removing outliers;a‒bmeans in the same row not sharing a common
Control Escherichi a coli Enter obacter iaceae Clostridium Bifidobac terium Lactobac illus Clostridium cluster s IV Clostridium cluster s XIVa Bacter oidetes Firm icutes F/B ratio ] dl o F[ ec n a d n u b a e vi t al e R 0.0 0.5 1.0 1.5 2.0 2.5 3.0 IN-0.5 IN-0.75 p = 0.05 p = 0.01 Control Escherichia coli Enter obacter iaceae Clostri dium Bifidobacter ium Lactobacillu s Clostridium cluster s IV Clostridium cluster s XIVa Bacter oidetes Firm icutes F/B ratio
Relative abundance [Fold]
0.0 0.5 1.0 1.5 2.0 2.5 3.0 IN-0.5 IN-0.75 a b
Figure 2.Effect of inulin on the relative abundance of selected bacterial populations in the colonic digesta of pigs on 28 d (a) and 49 d (b) of age.
Control IL8 TNF-a TLR4 IL6 IL10 ] dl o F[ ec n a d n u b a e vi t al e R 0.0 0.2 0.4 0.6 0.8 1.0 1.2 IN-0.5 IN-0.75 p < 0.01 p < 0.01 p = 0.02
a
b
Control IL8 TNF-a TLR4 IL6 IL10
Re lative abundance [F old] 0.0 0.2 0.4 0.6 0.8 1.0 1.2 IN-0.5 IN-0.75 IN-0
Figure 3.Effect of inulin on the colonic mRNA abundance of interleukin-6 (IL-6), interleukin-8 (IL-8), interleukin-10 (IL-10), tumor necrosis factor-α (TNF-α) and toll-like receptor-4 (TLR4) of pigs at 28 d (a) and 49 d (b) of age.
Values are means ± SEM, n = 5–8 per group where two samples were lost due to an operational error and one outlier was removed.
of age (Figure 3). Again, these differences disappeared when looking at mRNA abun-dance at 49 d of age.
4. Discussion
Inulin is responsible for its effects through the alternation of gut microbiota, which starts from the very beginning in life (Edwards and Parrett2002,2003; Thompson et al. 2008). Hence, unlike previous studies (Eberhard et al.2007; Mair et al.2010; Grela et al. 2013; Sobolewska and Grela 2013; Yan et al.2013; Barszcz et al.2016), we examined inulin’s effects in suckling piglets rather than post-weaning or during the grower‒ finisher phase, on BW and intestinal parameters, and further evaluated its effect 3 weeks beyond weaning, when inulin was no longer supplemented.
Our study revealed a significantly increased BW in piglets receiving the IN-0.5 dose during the suckling period. In agreement, Sobolewska and Grela (2013) and Grela et al. (2013) demonstrated an increased daily weight gain in adult pigs that fed an inulin-supplemented diet. Examining the result of gut morphology, the IN-0.5 group showed an increased villus height and an increased V/C ratio in both jejunum and ileum compared to the CON group during the suckling period, suggesting a link between BW and gut morphology. This is not surprising since an increased villus height represents an increased surface area, which will result in an increased nutrient absorp-tion capacity (Samanya and Yamauchi 2002; Pappenheimer and Michel 2003). The relationship between crypt depth and growth performance is not as clear. Deeper crypts can be advantageous because it entails faster villi rebuild from damage to improve absorption. However, faster cell turnover leads to increased energy utilisation, which reduces energy for growth performance (Yason et al.1987; Xu et al.2003; Awad et al. 2006). Hence, the V/C ratio is often used to interpret gut morphology. In practice, adding inulin to the diet has frequently been shown to improve the intestinal mucosal architecture in broiler chickens (Rehman et al. 2007; Nabizadeh 2012). In weaned piglets, fructooligosaccharides (FOS) were observed to increase jejunal villus height (Xu et al. 2005).
As a prebiotic, inulin serves as a substrate for SCFA synthesis by different types of bacteria in the large intestine (Gibson et al.2004). However, dietary administration of inulin has been shown to have different effects on the SCFA profile in different studies (Loh et al.2006; Eberhard et al.2007; Varley et al. 2010; Hansen et al. 2011; Paßlack et al.2012; Barszcz et al.2016; Grela et al.2016). In our study, there was no change in the fermentation pattern of SCFA induced by inulin supplementation during the suckling period based on the digesta dry matter. However, based on the digesta fresh matter, propionate and iso-butyrate concentrations were elevated after administration of IN-0.5. Propionate is known to have several health effects and to play a crucial role in both intestinal morphology and function (Hosseini et al.2011). In contrast with other studies in pigs in vivo (Loh et al. 2006) or in vitro (Ying et al. 2013), inulin supple-mentation did not lead to a difference in butyrate, which is the most important energy source for enterocytes (Roediger et al.1995).
Changes in SCFA profile might indicate shifts in microbial populations. Usually, the abundance of indigenous Bifidobacterium and Lactobacillus genera are selectively stimu-lated by prebiotics (Gibson et al. 2004), stimulating mucosal immunity or occupying
adhesion sites (Servin2004). However, we did notfind any alteration of Bifidobacterium or Lactobacillus by inulin supplementation, which is in line with Eberhard et al. (2007), Varley et al. (2010) and Paßlack et al. (2012), (2015)), but in contrast with other studies in pigs (Tzortzis et al.2005; Tako et al.2008; Patterson et al. 2010). The lack of an observable difference might be due to the age of the piglets, as the treatment was applied when the complexity of the microbiota increases. Alternatively, the effect observed might be related to the dose of inulin. Interestingly, in our study was observed that adding IN-0.5 suppressed the relative abundance of less desirable bacteria such as Escherichia coli, Enterobacteriaceae and also Clostridium numerically, though the relative abundance was slightly decreased at weaning. Thesefindings are consistent with previous studies that identified lower abun-dances of members of the Clostridium, Escherichia coli or Enterobacteriaceae after admin-istration of inulin (Wang and Gibson 1993; Patterson et al. 2010; Varley et al. 2010; Nabizadeh2012). The Clostridium clusters IV and XIVa are known as butyrate-producing species, having the capacity to degrade inulin-type fructans, producing butyrate (Hold et al. 2003; Moens and De Vuyst2017). However, in our study, concomitant with the result of butyrate, no difference was observed in Clostridium clusters IV and XIVa counts. Koleva et al. (2012) also did not detect differences in Clostridium clusters IV and XIVa in rats that fed an inulin diet. Furthermore, in pigs, the most dominant phyla are Firmicutes and Bacteroidetes (Isaacson and Kim2012). Unfortunately, inulin administration did not affect the abundance of Firmicutes and Bacteroidetes, as well as F/B ratio in our study.
Pro-inflammatory and anti-inflammatory cytokines can be modulated by inulin either indirectly or directly (Babu et al.2012; Johnson-Henry et al.2014; Vogt et al.2015; Halnes et al.2017). An indirect impact might refer to stimulation of growth and activity of bacteria and its fermentation products such as SCFA. Inulin can also be detected directly by intestinal immune cells, through receptor ligation of pathogen recognition receptors such as TLR, eventually inducing pro-inflammatory and anti-inflammatory cytokines. Both IL8 and TNF-α are established pro-inflammatory cytokines in piglets (Brix-Christensen et al. 2001). Inulin administration has been found to reduce IL8 and TNF-α at the protein level in pigs, mice and humans (Taranu et al.2012; Bermudez-Brito et al.2016; Shukla et al.2016). This is in agreement with our study where both inulin groups decreased IL8 and TNF-α at the mRNA level in the colon at 28 d of age. Prebiotics such as inulin could act as TLR4 ligands in intestinal immune cells (Capitán-Cañadas et al.2014) and TLR4 can induce a pro-inflammatory response (Mulla et al.2009; Płóciennikowska et al.2015). Together with the decrease of IL8 and TNF-α, the mRNA abundance of TLR4 was also reduced by inulin supplementation. Therefore, the presence of inulin in the intestine might lead to a trend towards an anti-inflammatory situation via suppressing the expression of pro-inflamma-tory cytokines. In contrast with what would be expected in our study, IL6 and IL10 did not significantly differ between dietary groups (Johnson-Henry et al.2014; Shukla et al.2016; Zhang et al.2018).
Two interesting effects of inulin in our study should be mentioned. Firstly, a dose‒ response effect of inulin was observed. This observation is in agreement with research in broiler chickens where adding 2.0 and 4.0 g/kg of FOS in the diets resulted in slightly improved growth performance, gut morphology and microbiota in comparison with adding 8.0 g/kg of FOS in the diet (Xu et al.2003). In previous studies on weaned pigs, 2%~ 4% inulin in the post-weaning diet has been found to display prebiotic effects, improving host’s health (Loh et al.2006; Tako et al.2008; Yasuda et al.2009; Varley et al.2010). Hence, taking the
daily feed intake and BW of weaned pigs into account, we designed our oral supplementa-tions (IN-0.5) in suckling piglets to imitate 2%~4% inulin in post-weaning diets. An addi-tional IN-0.75 group was also prepared to represent a relatively higher inulin supplementation. Compared to the beneficial effects of the IN-0.5 group, the IN-0.75 group did not demonstrate any changes in BW, gut microbiota, SCFA profile and only a minor change in gut morphology. This might be due to an excess of inulin inducing some side effects due to over-fermentation, such as diarrhoea, flatulence or abdominal bloating (Tuohy et al.2003). The second importantfinding highlighted that changes in SCFA profile, gut microbiota and mRNA abundance of inflammatory markers disappeared when inulin supplementation ceased after weaning. Thus, observed effects may be only due to direct effects of inulin administration and fermentation, not modulation of the microbiota. Although the IN-0.50 treatment continued to have beneficial effects on BW and gut mor-phology, it was probably just an accumulation of the benefits induced by inulin during the suckling period. However, these lasting effects of inulin may protect piglets against weaning stress.
5. Conclusion
In conclusion, the administration of inulin during the suckling period ameliorated BW showed a positive effect on gut morphology of the small intestine and revealed an increase in propionate and iso-butyrate concentrations in the large intestine based on the fresh digesta samples. Moreover, inulin feeding reduced pro-inflammatory cytokines at mRNA level. A dose‒response effect of inulin was observed, as only IN-0.5 displayed beneficial effects. These beneficial effects faded out during the post-weaning period when inulin was no longer supplemented, suggesting inulin has a direct effect rather than a lasting programming effect. Nevertheless, these beneficial effects induced by inulin during the suckling period might help piglets to be more resilient to weaning stress. Application of inulin will require investigation of more feasible methods of feeding, such as addition in milk replacer or supplementation in creep feed, taking into account that dose effects exist.
Disclosure statement
No potential conflict of interest was reported by the authors.
Funding
N. E. received a Welcome grant of the University of Liège, B. L. was funded by the China Scholarship Council, J.L. was supported by a PhD grant from the Research Foundation for Industry and Agriculture, Fonds De La Recherche Scientifique - FNRS.
ORCID
Julie Leblois http://orcid.org/0000-0001-5112-0262
References
Amit-Romach E, Sklan D, Uni Z. 2004. Microflora ecology of the chicken intestine using 16S
ribosomal DNA primers. Poult Sci. 83:1093–1098.
Amit-Romach E, Uni Z, Reifen R.2008. Therapeutic potential of two probiotics in inflammatory
bowel disease as observed in the trinitrobenzene sulfonic acid model of colitis. Dis Colon Rectum. 51:1828–1836.
Angelakis E.2017. Weight gain by gut microbiota manipulation in productive animals. Microb Pathog. 106:162–170.
AOAC.1990. Official methods of analysis. Arlington: Association Official Analytical Chemists. Awad WA, Böhm J, Razzazi-Fazeli E, Ghareeb K, Zentek J.2006. Effect of addition of a probiotic
microorganism to broiler diets contaminated with deoxynivalenol on performance and histo-logical alterations of intestinal villi of broiler chickens. Poult Sci. 85:974–979.
Babu US, Sommers K, Harrison LM, Balan KV.2012. Effects of fructooligosaccharide-inulin on Salmonella-killing and inflammatory gene expression in chicken macrophages. Vet Immunol Immunopathol. 149:92–96.
Bahar B, O’Doherty JV, Hayes M, Sweeney T.2012. Extracts of brown seaweeds can attenuate the bacterial lipopolysaccharide-induced pro-inflammatory response in the porcine colon ex vivo. J Anim Sci. 90:46–48.
Barroso E, Martín V, Martínez-Cuesta MC, Peláez C, Requena T. 2015. Stability of saliva microbiota during moderate consumption of red wine. Arch Oral Biol. 60:1763–1768. Barszcz M, Taciak M, Skomiał J.2016. The effects of inulin, dried Jerusalem artichoke tuber and
a multispecies probiotic preparation on microbiota ecology and immune status of the large intestine in young pigs. Arch Anim Nutr. 70:278–292.
Bermudez-Brito M, Faas MM, de Vos P.2016. Modulation of dendritic-epithelial cell responses against sphingomonas paucimobilis by dietaryfibers. Sci Rep. 6:30277.
Brix-Christensen V, Petersen TK, Ravn HB, Hjortdal VE, Andersen NT, Tønnesen E. 2001. Cardiopulmonary bypass elicits a pro- and anti- inflammatory cytokine response and impaired neutrophil chemotaxis in neonatal pigs. Acta Anaesthesiol Scand. 45:407–413.
Bustin SA, Benes V, Garson JA, Hellemans J, Huggett J, Kubista M, Mueller R, Nolan T, Pfaffl MW, Shipley GL, et al.2009. The MIQE guidelines: minimum information for publication of quantitative real-time PCR experiments. Clin Chem. 55:611–622.
Capitán-Cañadas F, Ortega-González M, Guadix E, Zarzuelo A, Suárez MD, de Medina FS, Martínez-Augustin O.2014. Prebiotic oligosaccharides directly modulate proinflammatory cytokine production in monocytes via activation of TLR 4. Mol Nutr Food Res. 58:1098– 1110.
De Gregoris TB, Aldred N, Clare AS, Burgess JG. 2011. Improvement of phylum-and class-specific primers for real-time PCR quantification of bacterial taxa. J Microbiol Methods. 86:351–356.
Eberhard M, Hennig U, Kuhla S, Brunner RM, Kleessen B, Metges CC.2007. Effect of inulin supplementation on selected gastric, duodenal, and caecal microbiota and short chain fatty acid pattern in growing piglets. Arch Anim Nutr. 61:235–246.
Edwards CA, Parrett AM.2002. Intestinalflora during the first months of life: new perspectives. Br J Nutr. 88:s11–s18.
Edwards CA, Parrett AM.2003. Dietaryfibre in infancy and childhood. Proc Nutr Soc. 62:17–23. Everaert N, Métayer-Coustard S, Willemsen H, Han H, Song Z, Ansari Z, Decuypere E, Buyse J, Tesseraud S. 2013. The effect of albumen removal before incubation (embryonic protein
under-nutrition) on the post-hatch performance, regulators of protein translation activation and proteolysis in neonatal broilers. Br J Nutr. 110:265–274.
Everaert N, Van Cruchten S, Weström B, Bailey M, van Ginneken C, Thymann T, Pieper R.
2017. A review on early gut maturation and colonization in pigs, including biological and dietary factors affecting gut homeostasis. Anim Feed Sci Technol. 233:89–103.
Gibson GR, Probert HM, Van Loo J, Rastall RA, Roberfroid MB.2004. Dietary modulation of the human colonic microbiota: updating the concept of prebiotics. Nutr Res Rev. 17:259–275.
Grela ER, Kowalczyk-Pecka DA, Hanczakowska E, Matras J. 2016. Effect of inulin and a
probiotic supplement in the diet of pigs on selected traits of the gastrointestinal microbiome. Med Weter. 72:448–452.
Grela ER, Pietrzak K, Sobolewska S, Witkowski P.2013. Effect of inulin and garlic supplementa-tion in pig diets. Ann Anim Sci. 13:63–71.
Halnes I, Baines KJ, Berthon BS, MacDonald-Wicks LK, Gibson PG, Wood LG. 2017. Soluble fibre meal challenge reduces airway inflammation and expression of GPR43 and GPR41 in asthma. Nutrients. 9:57.
Hansen CF, Hernández A, Mansfield J, Hidalgo A, La T, Phillips ND, Hampson DJ, Pluske JR.
2011. A high dietary concentration of inulin is necessary to reduce the incidence of swine dysentery in pigs experimentally challenged with brachyspira hyodysenteriae. Br J Nutr. 106:1506–1513.
Hold GL, Schwiertz A, Aminov RI, Blaut M, Flint HJ.2003. Oligonucleotide probes that detect quantitatively significant groups of butyrate-producing bacteria in human feces. Appl Environ Microbiol. 69:4320–4324.
Hosseini E, Grootaert C, Verstraete W, Van de Wiele T.2011. Propionate as a health-promoting microbial metabolite in the human gut. Nutr Rev. 69:245–258.
Howell DC.1998. Statistical methods in human sciences. New York (NY): Wadsworth. Isaacson R, Kim HB.2012. The intestinal microbiome of the pig. Anim Health Res Rev. 13:100–
109.
Johnson-Henry KC, Pinnell LJ, Waskow AM, Irrazabal T, Martin A, Hausner M, Sherman PM.
2014. Short-chain fructo-oligosaccharide and inulin modulate inflammatory responses and microbial communities in caco2-bbe cells and in a mouse model of intestinal injury. J Nutr. 144:1725–1733.
Koleva PT, Valcheva RS, Sun X, Gänzle MG, Dieleman LA.2012. Inulin and fructo-oligosac-charides have divergent effects on colitis and commensal microbiota in HLA-B27 transgenic rats. Br J Nutr. 108:1633–1643.
Leonard SG, Sweeney T, Bahar B, O’Doherty JV. 2012. Effect of maternal seaweed extract supplementation on suckling piglet growth, humoral immunity, selected microflora, and immune response after an ex vivo lipopolysaccharide challenge. J Anim Sci. 90:505–514. Loh G, Eberhard M, Brunner RM, Hennig U, Kuhla S, Kleessen B, Metges CC.2006. Inulin alters
the intestinal microbiota and short-chain fatty acid concentrations in growing pigs regardless of their basal diet. J Nutr. 136:1198–1202.
Lomax AR, Calder PC.2008. Prebiotics, immune function, infection and inflammation: a review of the evidence. Br J Nutr. 101:633–658.
Mair C, Plitzner C, Domig KJ, Schedle K, Windisch W.2010. Impact of inulin and a multispecies probiotic formulation on performance, microbial ecology and concomitant fermentation patterns in newly weaned piglets. J Anim Physiol Anim Nutr (Berl). 94:e164–177.
Moens F, De Vuyst L.2017. Inulin-type fructan degradation capacity of clostridium cluster IV and XIVa butyrate-producing colon bacteria and their associated metabolic outcomes. Benef Microbes. 8(3):473–490.
Mulla MJ, Brosens JJ, Chamley LW, Giles I, Pericleous C, Rahman A, Joyce SK, Panda B, Paidas MJ, Abrahams VM. 2009. Antiphospholipid antibodies induce a pro-inflammatory
response in first trimester trophoblast via the TLR4/MyD88 pathway. Am J Reprod Immunol. 62:96–111.
Nabizadeh A.2012. The effect of inulin on broiler chicken intestinal microflora, gut morphology, and performance. J Anim Feed Sci. 21:725–734.
[NRC] National Research Council. 2012. Nutrient requirements of swine. National Academy Press, Washington, DC.
O’Mahony L, McCarthy J, Kelly P, Hurley G, Luo F, Chen K, O’Sullivan GC, Kiely B, Collins JK, Shanahan F, et al. 2005. Lactobacillus and bifidobacterium in irritable bowel syndrome:
symptom responses and relationship to cytokine profiles. Gastroenterology. 128:541–551. O’Shea CJ, Sweeney T, Bahar B, Ryan MT, Thornton K, O’Doherty JV. 2012. Indices of
through singular or combined consumption of Lactobacillus plantarum and inulin. J Anim Sci. 90:3848–3857.
Pabst R, Russell MW, Brandtzaeg P.2008. Tissue distribution of lymphocytes and plasma cells and the role of the gut. Trends Immunol. 29:206–208.
Pappenheimer JR, Michel CC.2003. Role of villus microcirculation in intestinal absorption of glucose: coupling of epithelial with endothelial transport. J Physiol. 553:561–574.
Paßlack N, Al-Samman M, Vahjen W, Männer K, Zentek J.2012. Chain length of inulin affects its degradation and the microbiota in the gastrointestinal tract of weaned piglets after a short-term dietary application. Livest Sci. 149:128–136.
Paßlack N, Vahjen W, Zentek J.2015. Dietary inulin affects the intestinal microbiota in sows and
their suckling piglets. BMC Vet Res. 11:51.
Patterson JK, Yasuda K, Welch RM, Miller DD, Lei XG. 2010. Supplemental dietary inulin of variable chain lengths alters intestinal bacterial populations in young pigs. J Nutr. 140:2158– 2161.
Pieper R, Bindelle J, Malik G, Marshall J, Rossnagel BG, Leterme P, Van Kessel AG. 2012. Influence of different carbohydrate composition in barley varieties on Salmonella Typhimurium var. Copenhagen colonisation in a “Trojan” challenge model in pigs. Arch Anim Nutr. 66:163–179.
Place RF, Noonan EJ, Giardina C. 2005. HDAC inhibition prevents NF-κB activation by suppressing proteasome activity: down-regulation of proteasome subunit expression stabilizes IκBα. Biochem Pharmacol. 70:394–406.
Płóciennikowska A, Hromada-Judycka A, Borzęcka K, Kwiatkowska K.2015. Co-operation of TLR4 and raft proteins in LPS-induced pro-inflammatory signaling. Cell Mol Life Sci. 72:557–581. Rao AV. 1999. Dose-response effects of inulin and oligofructose on intestinal bifidogenesis
effects. J Nutr. 129:1442s–1445s.
Rehman H, Rosenkranz C, Böhm J, Zentek J.2007. Dietary inulin affects the morphology but not
the sodium-dependent glucose and glutamine transport in the jejunum of broilers. Poult Sci. 86:118–122.
Roberfroid MB, Van Loo JA, Gibson GR.1998. The bifidogenic nature of chicory inulin and its hydrolysis products. J Nutr. 128:11–19.
Roediger WEW, Cummings JH, Rombeau JL, Sakata T.1995. The place of short-chain fatty acids in colonocyte metabolism in health and ulcerative colitis: the impaired colonocyte barrier. In: Physiological and clinical aspects of short-chain fatty acids. Cambridge University Press; p. 337–351.
Samanya M, Yamauchi KE.2002. Histological alterations of intestinal villi in chickens fed dried Bacillus subtilis var. natto. Comp Biochem Physiol A Mol Integr Physiol. 133:95–104. Servin AL. 2004. Antagonistic activities of lactobacilli and bifidobacteria against microbial
pathogens. FEMS Microbiol Rev. 28:405–440.
Shukla G, Bhatia R, Sharma A.2016. Prebiotic inulin supplementation modulates the immune response and restores gut morphology in giardia duodenalis-infected malnourished mice. Parasitol Res. 115:4189–4198.
Smith AG, O’Doherty JV, Reilly P, Ryan MT, Bahar B, Sweeney T.2011. The effects of laminarin
derived from laminaria digitata on measurements of gut health: selected bacterial populations, intestinal fermentation, mucin gene expression and cytokine gene expression in the pig. Br J Nutr. 105:669–677.
Sobolewska S, Grela ER.2013. Effect of inulin extraction method and level in growing-finishing
pig diets on performance, carcass traits and nutrients digestibility. Annales Universitatis Mariae Curie-Skłodowska. Sectio EE: Zootechnica. 31:56–64.
Tako E, Glahn RP, Welch RM, Lei X, Yasuda K, Miller DD. 2008. Dietary inulin affects the expression of intestinal enterocyte iron transporters, receptors and storage protein and alters the microbiota in the pig intestine. Br J Nutr. 99:472–480.
Taranu I, Marin DE, Untea A, Janczyk P, Motiu M, Criste RD, Souffrant WB.2012. Effect of
dietary natural supplements on immune response and mineral bioavailability in piglets after weaning. Czech J Anim Sci. 57:332–343.
Tegtmeier D, Thompson CL, Schauer C, Brune A.2016. Oxygen affects gut bacterial colonization
and metabolic activities in a gnotobiotic cockroach model. Appl Environ Microbiol. 82:1080– 1089.
Thompson CL, Wang B, Holmes AJ. 2008. The immediate environment during postnatal development has long-term impact on gut community structure in pigs. ISME J. 2:739–748. Tuohy KM, Probert HM, Smejkal CW, Gibson GR. 2003. Using probiotics and prebiotics to
improve gut health. Drug Discov Today. 8:692–700.
Tzortzis G, Goulas AK, Gee JM, Gibson GR. 2005. A novel galactooligosaccharide mixture increases the bifidobacterial population numbers in a continuous in vitro fermentation system and in the proximal colonic contents of pigs in vivo. J Nutr. 135:1726–1731.
Uematsu S, Fujimoto K, Jang MH, Yang BG, Jung YJ, Nishiyama M, Sato S, Tsujimura T, Yamamoto M, Yokota Y, et al. 2008. Regulation of humoral and cellular gut immunity by lamina propria dendritic cells expressing toll-like receptor 5. Nat Immunol. 9:769–776. Varley PF, McCarney C, Callan JJ, O’Doherty JV.2010. Effect of dietary mineral level and inulin
inclusion on phosphorus, calcium and nitrogen utilisation, intestinal microflora and bone development. J Sci Food Agric. 90:2447–2454.
Vogt L, Meyer D, Pullens G, Faas M, Smelt M, Venema K, Ramasamy U, Schols HA, De Vos P.
2015. Immunological properties of inulin-type fructans. Crit Rev Food Sci Nutr. 55:414–436. Wang HB, Wang PY, Wang X, Wan YL, Liu YC. 2012. Butyrate enhances intestinal epithelial barrier function via up-regulation of tight junction protein Claudin-1 transcription. Dig Dis Sci. 57:3126–3135.
Wang X, Gibson GR. 1993. Effects of the in vitro fermentation of oligofructose and inulin by bacteria growing in the human large intestine. J Appl Bacteriol. 75:373–380.
Xu C, Chen X, Ji C, Ma Q, Hao K.2005. Study of the application of fructooligosaccharides in piglets. Asian-Aust J Anim Sci. 18:1011.
Xu ZR, Hu CH, Xia MS, Zhan XA, Wang MQ.2003. Effects of dietary fructooligosaccharide on digestive enzyme activities, intestinal microflora and morphology of male broilers. Poult Sci. 82:1030–1036.
Yan H, Potu R, Lu H, de Almeida VV, Stewart T, Ragland D, Armstrong A, Adeola O, Nakatsu CH, Ajuwon KM. 2013. Dietary fat content and fiber type modulate hind gut microbial community and metabolic markers in the pig. PLoS One. 8:1–10.
Yason CV, Summers BA, Schat KA. 1987. Pathogenesis of rotavirus infection in various age groups of chickens and turkeys: pathology. Am J Vet Res. 48:927–938.
Yasuda K, Dawson HD, Wasmuth EV, Roneker CA, Chen C, Urban JF, Welch RM, Miller DD, Lei XG. 2009. Supplemental dietary inulin influences expression of iron and inflammation
related genes in young pigs. J Nutr. 139:2018–2023.
Ying X, Gong J, Goff HD, Yu H, Wang Q, Cui SW. 2013. Effects of pig colonic digesta and
dietaryfibres on in vitro microbial fermentation profiles. Bioactive Carbohydrates and Dietary Fibre. 1:120–130.
Zhang Q, Yu H, Xiao X, Hu L, Xin F, Yu X. 2018. Inulin-type fructan improves diabetic phenotype and gut microbiota profiles in rats. Peer J. 6:e4446.