Development of robust analytical methods using design space
methodology
B. Debrus1, P. Lebrun1, B. Boulanger2, E. Rozet1, G. Caliaro3, A. Ceccato4, Ph. Hubert1
1Laboratoire de Chimie Analytique, CIRM, Université de Liège, Avenue de l’Hôpital, 4000 Liège, Belgium, [email protected]
2Arlenda Laboratory Solutions, Avenue de l’Hôpital 1, 4000 Liège, Belgium 3Orailac Quality Solutions, Brussels, Belgium
4Odyssea Pharma, Rue du Travail 16, 4460 Grace-Hollogne, Belgium
Keywords: Optimization, liquid chromatography, design of experiment, design space.
1 Introduction
Nowadays, the concept of quality by design (QbD) and more particularly the design space (DS) has become widespread in the field of pharmaceutical sciences. The ICH Q8(R2) guideline [1] defines the design space as “the multidimensional combination and interaction of input variables (e.g., material attributes) and
process parameters that have been demonstrated to provide assurance of quality”. Therefore, in the
framework of separation sciences, the design space can be considered as a zone of robustness where small but deliberate variations in method parameters do not affect its quality. This work presents the results obtained for two test samples, one system suitability mixture and one pharmaceutical formulation.
2 Theory
The present methodology is based on the use of design of experiments (DoE). The first step consisted in the selection of an appropriate response or criterion which represents the quality of a separation. Previous works have demonstrated that the chromatographic resolution (RS) is not suitable for the predictive error analysis
[2]. Thus, the separation criterion (S) – defined as the difference between the end of the first peak and the beginning of the second peak of the critical pair (i.e. the two most proximate peaks) – was preferred. In a second step, some common chromatographic parameters (i.e. pH of mobile phase, gradient time, temperature…) were selected to optimize S. The retention factors at the beginning, the apex and the end of each peak were then modelled by stepwise multiple linear regressions. The selected criterion, S, was finally computed using Monte Carlo simulations in order to pay a special attention to the predictive error propagation. By this way, the design space can be defined using the following equation.
(
)
{
Î
c
q>
l
q
³
p
}
=
E
[
P
ˆ
]
DS
x
0 ˆS
(1)Where x0is a point in the experimental domain, χ. λ is the acceptance limit for criterion S; π is the quality level and qˆ is the set of estimated parameters of the model. P and E respectively correspond to the estimators of probability and mathematical expectation.
3 Material and methods
3.1 Design of experiments
The same experimental design was carried out for both samples (see Table 1).
Factors
Levels
pH
2.6
4.4
6.3
8.1 10.0
Gradient time (T
G, min) 10.0 20.0 30.0
3.2 Experimental
Analyses were carried out on an Alliance 2695 separation module coupled with a UV-DAD 2996 detector from Waters (Milford, MA, USA). The analytical column was an XBridge C18 (100x2.1mm i.d.; particle size 3.5μm) from Waters. The experiments were carried out at a flow rate of 0.25 mL min-1at 30°C. The chromatograms were recorded between 210 nm and 400 nm with an estimated step of 1.2 nm and an acquisition frequency of 2 Hz. For coeluting peaks, the integrations were made on their respective independent components resulting from ICA numerical separation [3].
4 Results and discussions
This methodology has been applied to several analytical methods in order to optimize the separation and to compute the design space. For example, the separation of a mixture containing 9 compounds was optimized as illustrated on Figure 1.
Figure 1 – (a) Probability surface, (b) Predicted chromatogram, (c) recorded chromatogram.
Figure 1a depicts the probability surface to obtain a separation (S) of at least 0 min (baseline resolved peaks). The quality level is set to 85% and the corresponding design space is surrounded in red. Figure 1b displays the predicted chromatogram at pH 3.0 and with a gradient time of 30 min. (within the DS). Figure 1c shows the chromatogram recorded at this operating condition.
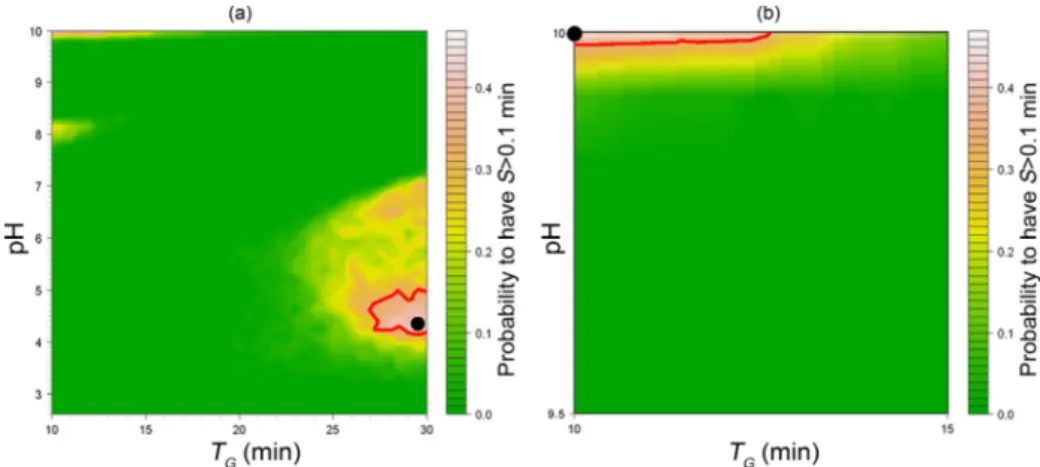
This methodology was also successfully applied to a pharmaceutical formulation. For this sample, two DS were encountered as presented in figure 2a and 2b.
Figure 2 – (a) Probability surface for the whole experimental domain, (b) magnification of the upper-left zone. Optima are depicted by black circles.
Figure 3 – (a) chromatogram recorded at pH 4.3 with TG= 29.5 min, (b) chromatogram recorded at pH 10
with TG= 10 min. Peak numbering: 1=maleate, 2=phenylephrine, 3=saccharin, 4=acetaminophen, 5=sunset
yellow FCF, 6= chlorpheniramine, 7=PVP-K30.
5 Conclusions
The automated optimization of chromatographic separation is the first critical step in the framework of the automated development of chromatographic method. With those examples, DoE, ICA, multiple linear regression, error propagation and DS methodologies were successfully applied to separate nine compounds of an unknown sample mixture in less than 40 min and the seven compounds of a pharmaceutical formulation. Furthermore, for this latter sample, the analysis time was shortened to less than 14 minutes. This global methodology is also very flexible as the choice of each criterion and their respective acceptance limit are made by the analyst. In addition, an evaluation of DS robustness was carried out during the present study. The separation criterion S clearly demonstrated its robustness capability within the identified DS. It strengthens the fact that the DS defines a space wherein the separations are complete and the method is robust. Even more robust if the DS is large. Nevertheless, as the size of DS depends on the value of π, further works are still required to define possible adjustment strategy for this parameter.
6 References
[1] ICH Q8(R2), Draft Guidance on Pharmaceutical Development, 2005 (step 5).
[2] P. Lebrun, B. Govaerts, B. Debrus, A. Ceccato, G. Caliaro, Ph. Hubert & B. Boulanger, Development of a new predictive modelling technique to find with confidence equivalence zone and design space of chromatographic analytical methods, Chemom. Intell. Lab. Syst., 91, 4-16, 2008.
[3] B. Debrus, P. Lebrun, A. Ceccato, G. Caliaro, B. Govaerts, B.A. Olsen, E. Rozet, B. Boulanger & Ph. Hubert, A new statistical method for the automated detection of peaks in UV-DAD chromatograms of a sample mixture, Talanta 79, 77-85, 2009.