THE EFFECT OF LEAF ORIENTATION ON SPRAY RETENTION ON BLACKGRASS
M. Massinon, H.H. Boukhalfa, P.-Y. Maréchal, F. Lebeau
Gembloux Agro-Bio Tech University of Liege Gembloux, Belgium
ABSTRACT
Spray application efficiency depends on the pesticide application method as well as target properties. A wide range of drop impact angles exists during the spray application process because of drop trajectory and the variability of the leaf orientation. As the effect of impact angle on retention is still poorly documented, laboratory studies were conducted to highlight the effect of leaf orientation on drop impact outcomes. Measurements were performed with a high-speed camera coupled with a retro-LED lighting. Size and velocity of the drop were extracted by image analysis. Drop impact types were determined by the operator. Drops were produced with a flat-fan nozzle mounted on a movable ramp. Excised blackgrass [Alopecurus myosuroides HUDS. (ALOMY)] leaves were stretched between two parts of a U-shaped support. A surfactant (Break-Thru® S240) was sprayed to highlight the effect of mixture surface tension. The whole device was tilted from 0 to 90°. Relative volume proportions were computed within of an energy scale divided into 11 classes. These proportions have been weighted by an average volume distribution and the results were summed for all energy classes to obtain the total volume proportions for each impact outcomes and for all leaf angles. For distilled water (high surface tension) the increase of rebound proportion with the increase of drop impact angle is highlighted. For surfactant (lower surface tension), it results in an increase of drop fragmentation in Cassie-Baxter wetting regime. To be statistically representative, bigger drop samples should be used.
Keywords: Spray retention, Leaf orientation, Drop impact, High-speed imaging, Blackgrass.
INTRODUCTION
Crop protection is mainly achieved by pesticide spraying. This complex process suffers from well-known drawbacks leading to environmental contaminations and economic costs. As a consequence, an extensive work has been done to improve spray application method, for instance by designing new nozzle type or developing tank mix additives. Research tools to assess spray efficacy have evolved from field trials to laboratory screening methods to get a physical understanding of the process. Field trials inform on the overall efficacy of the spray application method in particular conditions but fail to provide a physical explanation. Laboratory methods focus on a specific phase of the process to increase its overall understanding. A wide range of parameters influencing spray retention have been identified, from drop physicochemical properties to target properties or application parameter settings. On superhydrophobic leaves, the drop impact outcome is a complex function of surface topography, angle, drop size and velocity and liquid physicochemical properties.
Plants exhibit various degrees of wettability from very-easy to very-difficult-to-wet, depending on species and growth stages (Gaskin et al., 2005). It is well established that difficult-to-wet (or superhydrophobic) species, such as wheat or blackgrass, are the most challenging target for efficient pesticide application. Superhydrophobicity appears on hydrophobic materials when the apparent contact angle is enhanced by the small scale roughness of surface that dramatically increased their specific surface.
Two models describe the wetting of such surfaces named Wenzel and Cassie-Baxter regime (Zu et al., 2010). The Wenzel non-composite regime, often referred as pinning, is characterized by the sticking of the liquid which is anchored in the surface cavities. In the Cassie-Baxter composite regime, the liquid stands on the pillars of the surface and some air is trapped beneath the drop in the valleys of the structure. The liquid can be easily removed from the surface. The height and distance between the pillars is a critical parameter to keep the drop in a Cassie-Baxter regime. One classical parameter to quantify the surface roughness is the Wenzel roughness defined as the ratio of the real and the projected planar surface areas (Rioboo et al., 2008).
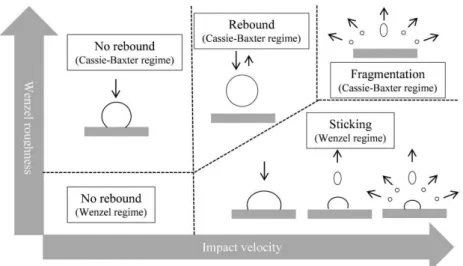
As a result of these regimes, different outcomes during drop impact have been identified on superhydrophobic materials as a function of drop size and velocity and surface roughness (Fig. 1). For small Wenzel roughness, a drop of low kinetic energy is deposited in a Wenzel state. By gradually increasing its kinetic energy, the drop is fragmented. A part of the drop sticks at the impact point while the rest leaves the surface. As a function of the impact energy, a drop can bounce which is referred as partial rebound or rebound in Wenzel regime, or shatters into several satellite drops which is referred splashing in Wenzel regime. For intermediate Wenzel roughness, slowly impacting drops adhere in a Cassie-Baxter regime.
With increasing speed, the drop completely bounces which is only observed on superhydrophobic surface. For even higher speeds, when the impact pressure is large enough, the liquid can penetrate into the cavities of the surface modifying the wettability regime from Cassie-Baxter to Wenzel. As a consequence, sticking, partial rebound or splashing in Wenzel regime can be observed. Finally, for high Wenzel roughness, a drop can, as a function of speed, either adhere in a Cassie-Baxter regime, rebound or completely splash.
FIGURE 1: Drop impact phase diagram on horizontal superhydrophobic surface for a water drop (from Rioboo et al., 2008), depending on drop velocity and wetting regimes.
Up to now, the effect of the drop impact angle on leaves on the wetting regime and the impact outcome is poorly understood. However, it is clear that this parameter has important practical implications for pesticide application as the leaf orientation and the drop trajectory result in a wide range of impact angles. On this basis, the aim of this paper is to investigate how the leaf angle changes the impact outcomes on blackgrass leaves which offer a highly superhydrophobic surface.
MATERIALS AND METHODS
The experimental setup and the method for the assessment of spray retention with high-speed imaging have been previously described (Massinon and Lebeau, 2012) and are summarized below. The dynamic bench is composed of a single Teejet XR11003VK flat-fan nozzle mounted 50 cm above the target on a linear stage which is perpendicular to the camera-lighting axis. Nozzle forward speed was set to 2 m s-1. Drop impacts on the target were recorded with a high-speed camera at 20,000 frames per second. Camera depth of field was greater than leaf width. A single path of the nozzle was performed for each test. Size and velocity
of drops are determined by image analysis immediately before impact. The velocity is computed in module. Impact types are identified by an operator. Only the drops hitting the target surface were taken into account in the subsequent analysis.
Leaf orientation was studied in the 0 to 90° range in steps of 15°. For each leaf angle, five replicates of spraying were performed with two contrasted formulations. A trisiloxane tank-mix additive (Break-Thru® S240, Evonik Industries AG) at 0.1% v/v in distilled water was tested. Secondly, distilled water has been tested for comparison. Spray products were mixed and pressurized at 0.2 MPa in a stainless steel tank. Target surfaces were excised leaves from indoor-grown blackgrass [Alopecurus myosuroides HUDS. (ALOMY)]. The leaves were stretched between two parts of a U-shaped support bracket. A new leaf was used for each replicate.
RESULTS
Impact outcomes on blackgrass leaf are presented as a function of drop velocity and size for distilled water at 0° leaf angle (Fig. 2) as example for describing the methodology. Each point represents an impact on the leaf and impact type is identified by a specific mark. This way, drop impacts are sorted in the phase diagram as a function of the impact energy. The impact phase diagram was discretized into 11 energy classes. The class boundaries correspond to a constant dimensionless Weber number of the drop before impact. The first limit was set to a 0.02 Weber number and higher limits follow a times 3 progression for a constant spacing in log/log scale. The Weber number ( = ² ) which represents the ratio between the drop kinetic energy and the drop surface energy (where ρ is liquid density, V is the velocity, D is the drop diameter and σ is the liquid static surface tension) was computed with the water surface tension value (72.2 mN m-1). This way, we created an energy scale which depends only on the physical parameters of drops. 11 was the higher impact energy class observed. In each energy class, the volumetric proportions of the different impact outcomes were computed. These percentages were finally presented in stacked histogram. Figure 3 presents such results for distilled water at 0° leaf angle where the relative (+) and cumulative (──) volume of spray observed during the trial are included.
FIGURE 2 : Drop impact phase diagram for distilled water on horizontal blackgrass leaf (5 replicates of spraying): ∆ adhesion, ● rebound C-B, x splashing W and + splashing C-B. Straight lines represent the boundaries between the 11 energy classes.
FIGURE 3 : Normalized volume within energy class for each impact outcome (stacked histogram; green: adhesion, red: rebound C-B, dark blue: splashing C-B and sky blue: splashing W) for distilled water on horizontal blackgrass leaf, (+) volume proportions of the spray in each energy class and (──) cumulative form.
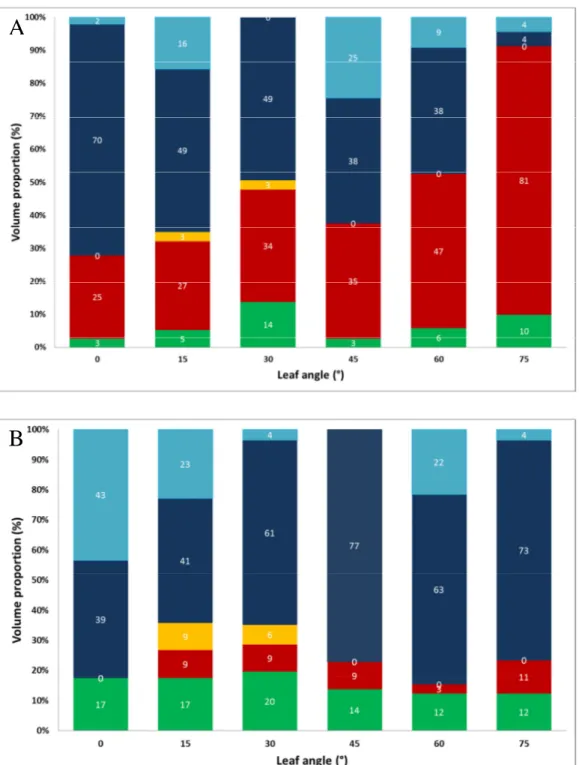
As the number of drop impact was quite low, the observed volume in each energy class changes for each orientation. For the higher leaf angles, some energy classes are even empty because of the smaller projected surface area available. More replicates should be carried out to increase the number of impacts but thousands of drops are needed to stabilize the observed spray spectrum. Therefore, in figures 4A and B, results of all leaf angles (color bars) have been merged by summing volumes in energy class and divided by the total volume to get an averaged granulometry (· ·· ♦ ···). This way, a relative volume for each energy class is obtained which is more representative of the nozzle, pressure and formulation tested.
Even if the distribution observed for water (Fig. 4A) and Break Thru (Fig. 4B) needs more drops observation to stabilize, this averaged distribution was used to compute the proportion of the different impact outcomes as a function of the impact angle (Fig. 5A and B). For the different angles, the same averaged distribution was used to weight the proportion of impact outcomes in each energy classes. Finally, all proportions in each impact outcomes were summed for all energy classes to obtain the total volume proportions depending on leaf angle for both formulations.
For distilled water (Fig. 5A), the proportion of the spray that adheres at first impact is in the low tens whatever the leaf angle. For the rebound, a continuous increase of the proportion is observed. As a results, the splashing proportion decreases accordingly. The majority of the fragmentation outcomes occur in the Cassie-Baxter wetting regime.
For surfactant (Fig. 5B), the adhesion proportion is in the low twenties, with a slight decrease with an increasing impact angle. The rebound proportion is roughly steady with the increase of leaf angle. The absence of rebound for the horizontal position is questionable because of very low number of observation in the relevant energy class for this trial. About 70% of the spray splashes. For the 0° angle, the proportions in Wenzel and Cassie-Baxter regime are almost equal. The high proportion of Wenzel regime is corroborated by the absence of rebound at this angle. For tilted surfaces, the splashing in Cassie-Baxter wetting regime takes over the splashing in Wenzel regime.
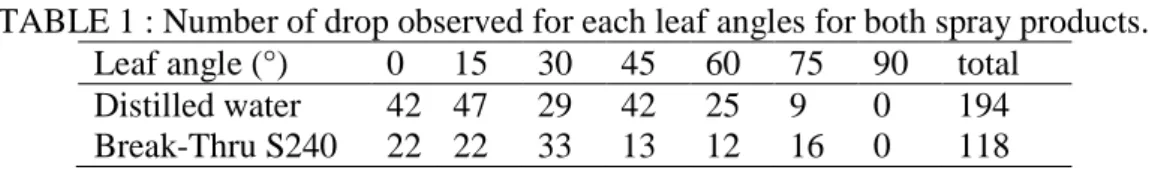
The number of drops observed per trial is presented in table 1 for information. For both experiments, no drop impact was observed at a leaf angle of 90° despite the 2 m s-1 nozzle forward speed which gives a horizontal component to the speed of the drop for the phase of transfer to the target.
TABLE 1 : Number of drop observed for each leaf angles for both spray products. Leaf angle (°) 0 15 30 45 60 75 90 total
Distilled water 42 47 29 42 25 9 0 194 Break-Thru S240 22 22 33 13 12 16 0 118
FIGURE 4: Bars represent the volumes observed for the six leaf angles for the 11 energy classes (left axis). Dashed lines (· ·· ♦ ··· ) represent the averaged volume distribution used to weight the impact outcome proportions (right axis). (A) Distilled water (194 drops), (B) Break-Thru® S240 at 0.1% v/v in distilled water (118 drops).
A
FIGURE 5: Volume proportions of impact outcomes depending on blackgrass leaf angle (green: adhesion, red: rebound C-B, orange: rebound W, dark blue: splashing C-B and sky blue: splashing W). 0° corresponds to the horizontal. (A) Distilled water (194 drops), (B) Break-Thru® S240 at 0.1% v/v in distilled water (118 drops).
A
DISCUSSION
A wide range of impact angles exists during the spray application process because of drop trajectory and the variability of the leaf angles. The increase of the impact angle is associated with a reduction of the normal component of the drop velocity during the impact and an increase of the tangential component. Therefore, the leaf angle may have a significant role in the spraying efficiency. Indeed, impact outcomes are slightly changed because of the lower impact energy in the normal direction. For distilled water, it results in an increase of rebound proportion while for the surfactant solution it results in an increase of fragmentations in the Cassie-Baxter regime.
Results highlight that bigger drop samples than the ones used in these first trials (194 for distilled water and 118 for surfactant) should be used, which just implies more replicates and processing time. Indeed, the method implicates the drops sample to be divided into 11 energy classes. More numerous drops are needed to get a statistically representative sample of the impact outcome in each specific class. Furthermore, the results should be supported by retention measurements on the samples to rate the effect of the impact modifications on the deposits. Future work will focus on the link between the actual and the retention assessed by the method using the fundamental understanding of the physics behind drop impact. The final goal is to provide the basic data for integrated models of agricultural spraying.
ACKNOWLEDGEMENTS
This research was funded by Service Public Wallonie DG06 (Belgium) in the frame of the EUREKA (http://www.eurekanetwork.org/) project 4984 VEGEPHY.
REFERENCES
Gaskin R E, Steele K D, Forster W A. 2005. Characterising plant surfaces for spray adhesion and retention. New Zealand Plant Protection 58:179–183. Massinon, M., Lebeau, F. 2012. Experimental method for the assessment of
agricultural spray retention based on high-speed imaging of drop impact on a synthetic superhydrophobic surface. Biosystems Engineering. In Press. doi:10.1016/j.biosystemseng.2012.02.005
Rioboo R, Voue M, Vaillant A, De Coninck J. 2008. Drop Impact on Porous Superhydrophobic Polymer Surfaces. Langmuir 24:14074–14077.
Zu Y Q, Yan Y Y, Li J Q, Han Z W. 2010. Wetting Behaviours of a Single Droplet on Biomimetic Micro Structured Surfaces. Journal of Bionic Engineering 7:191–198.