1 Running Head: XOS affect broiler performance and colonization
1
# Address correspondence to Filip Van Immerseel, filip.vanimmerseel@ugent.be 2
Key words: xylo-oligosaccharides, broiler, Clostridium 3
De Maesschalck C1, Eeckhaut V1, Maertens L2, De Lange L3, Marchal L4, Nezer C5, De Baere S6, 4
Croubels S6, Daube G7, Dewulf J8, Haesebrouck F1, Ducatelle R1, Taminau B7, Van Immerseel F1# 5
1Department of Pathology, Bacteriology and Avian Diseases, Faculty of Veterinary Medicine, Ghent University, 6
Salisburylaan 133, B-9820 Merelbeke, Belgium
7
2Animal Science Unit, Institute for Agricultural and Fisheries Research, Scheldeweg 68, B-9090 Melle, Belgium 8
3Schothorst Feed Research, Meerkoetenweg 26, NL-8200 AM Lelystad, The Netherlands 9
4ForFarmers BV, Kwinkweerd 12, NL-7241 CW Lochem, The Netherlands 10
5Quality Partner s.a., Rue Hayeneux 62, B-4040 Herstal, Belgium 11
6Department of Pharmacology, Toxicology and Biochemistry, Faculty of Veterinary Medicine, Ghent University, 12
Salisburylaan 133, B-9820 Merelbeke, Belgium
13
7Laboratory of Food Microbiology, Department of Food Sciences, Fundamental and Applied Research for Animal & 14
Health (FARAH), Faculty of Veterinary Medicine, University of Liège, Boulevard de Colonster 20, B-4000 Liège,
15
Belgium
16
8 Veterinary Epidemiology Unit, Department of Reproduction, Obstetrics and Herd Health, Faculty of Veterinary 17
Medicine, Ghent University, Salisburylaan 13, B-9820 Merelbeke, Belgium
18 19
The effects of xylo-oligosaccharides on performance and
microbiota in broiler chickens
AEM Accepted Manuscript Posted Online 19 June 2015 Appl. Environ. Microbiol. doi:10.1128/AEM.01616-15
2
Abstract
20
In broiler chickens, feed additives, including prebiotics, are widely used to improve gut health and 21
to stimulate performance. Xylo-oligosaccharides (XOS) are hydrolytic degradation products of 22
arabinoxylans that can be fermented by the gut microbiota. In the current study it was aimed to 23
analyze the prebiotic properties of XOS when added to the broiler diet. Administration of XOS to 24
chickens, on top of a wheat/rye-based diet, significantly improved the feed conversion ratio. XOS 25
significantly increased villus length in the ileum. It also significantly increased numbers of 26
lactobacilli in the colon and Clostridium cluster XIVa in the caeca. Moreover, the number of gene 27
copies encoding the key bacterial enzyme for butyrate production, butyryl-CoA:acetate CoA-28
transferase, was significantly increased in the caeca of chickens administered XOS. In this group of 29
chickens, at species level, Lactobacillus crispatus and Anaerostipes butyraticus were significantly 30
increased in abundance in the colon and caecum, respectively. In vitro fermentation of XOS 31
revealed cross-feeding between L. crispatus and A. butyraticus. Lactate, produced by L. crispatus 32
during XOS fermentation, was utilized by the butyrate-producing Anaerostipes species. These data 33
show the beneficial effects of XOS on broiler performance when added to the feed, which 34
potentially can be explained by stimulation of butyrate-producing bacteria through cross-feeding of 35
lactate and subsequent effects of butyrate on gastrointestinal function. 36
Introduction
37
Cereal fibers are composed of carbohydrate polymers that are resistant to digestion in the small 38
intestine of monogastric animals but are completely or partially fermented in the distal gut, and are 39
believed to stimulate gut health (1). The main components of the cereal fiber fraction are 40
arabinoxylans (AX), pectins, resistant starch, cellulose, β-glucans and lignin (2). Hydrolytic 41
degradation of the heteropolymer AX results in a mixture of arabinose substituted xylo-42
oligosaccharides or arabinoxylan-oligosaccharides (AXOS) and non-substituted xylo-43
3 oligosaccharides (XOS) (3). XOS are oligomers consisting of xylose units, linked through β-(1-4) 44
linkages (4). Selective fermentation of XOS has been shown to induce changes in both the 45
composition and activity of the gastrointestinal microbiota, improving the health and well-being of 46
the host. This suggests that XOS could fulfill the definition of a prebiotic (5). The production of 47
lactate and short chain fatty acids (SCFA), including butyrate, upon fermentation of XOS, has been 48
confirmed in several in vitro and in vivo studies (3, 6). Lactate can stimulate butyrate production 49
due to cross-feeding between lactate-producing bacteria and lactate-utilizing butyrate-producing 50
bacteria from Clostridium cluster XIVa (7). Butyrate has proven beneficial effects on 51
gastrointestinal function, since it has anti-inflammatory properties, fuels epithelial cells and 52
increases the intestinal epithelial integrity. In addition, butyrate has been shown to improve growth 53
performance in production animals and to change the microbiota composition and metabolic 54
activity of the microbial ecosystem in the intestine (8, 9). 55
Beneficial effects of XOS have already been described in rats. In these studies, XOS was shown to 56
significantly increase the bifidobacteria and lactobacilli population in the caecum (10, 11). An in 57
vitro study using swine faecal microbiota showed the highest SCFA production during fermentation
58
of XOS (12). To our knowledge, there is not much published research on the effect of XOS on the 59
gastrointestinal health of chickens except for the recent publication of Zhenping et al. (13), 60
showing the increased growth performance, enhanced endocrine metabolism and improved immune 61
function in broiler chickens after in feed supplementation of straw-derived XOS. However, the 62
effect of XOS on the microbiota composition in broilers has not yet been described. 63
In the broiler chicken, the distal ileum, the caeca and the colon are regarded as fermentation 64
chambers whose function is determined by the microbiota composition (14, 15). The chicken gut 65
microbiota is dominated by species belonging to the phyla Firmicutes (up to 75 %) and 66
Bacteroidetes (between 10 % and 50 %) (16-22). Around 90 % of the bacteria in the chicken
67
gastrointestinal tract are unknown species, indicating that the knowledge of the intestinal microbiota 68
4 of chickens is incomplete (23-24). The majority of sequences within the Firmicutes phylum belong 69
to the families Ruminococcaceae and Lachnospiraceae, the so called Clostridium cluster IV and 70
XIVa, respectively (25). Both families contain numerous members that are known to produce 71
butyrate as a fermentation end product and are therefore linked to beneficial effects on 72
gastrointestinal function (26, 27). Whether the abundance of these groups in the distal gut of 73
chickens is affected by XOS is unclear. 74
In the current study, we analyzed the effect of XOS administration on the performance of broilers. 75
In addition, we aimed to identify the shifts in microbiota composition induced by XOS to explain 76
possible beneficial effects on gastrointestinal health, with emphasis on butyrate production. 77
Materials and Methods
78
Additives/substrates
79
In the in vivo study corncob-derived XOS35 (Longlive Bio-technology, Shandong, China) was used 80
as feed additive. XOS35 is a mixture of 35 % XOS with a degree of polymerization (DP) between 81
2-7 and 65% maltodextrin. In the in vitro fermentation study XOS35, maltodextrin (Sigma-Aldrich, 82
St. Louis, United States) and XOS95 (Longlive Bio-technology, Shandong, China), a mixture of 95 83
% XOS with DP 2-7 and 5 % xylose, were used. The XOS95 and maltodextrin were used be 84
confirm that the effects of XOS35 in the in vivo trial were explained by the XOS. 85
Animals and diets
86
A total of 192 male and 192 female one-day-old Ross-308 broiler chickens were randomly divided 87
in 12 pens (3 pens of female and 3 pens of male birds per treatment and 32 chickens per pen) and 88
housed on solid floor covered with wood shavings. Light schedule was set to provide an 18h 89
light/6h dark cycle. The infrared bulbs (1 per pen during the first week) together with the central 90
heating system provided optimal temperature. All animals were fed a wheat/rye-based diet with 91
XOS (experimental group) or without XOS (control group) of which the composition is shown in 92
5 Table 1. The experimental starter feed (fed from the first day of age until day 13) was supplemented 93
with 0.2 % XOS, the grower feed (fed from day 14 until day 26) and the finisher feed (fed from day 94
27 until day 39) were supplemented with 0.5 % XOS. At 13, 26 and 39 days of age, all broilers and 95
the feed leftovers were weighed per pen to calculate the feed conversion ratio (FCR), weight gain 96
(WG) and feed intake (FI). At 26 days of age, three chickens per pen were euthanized by an 97
intravenous overdose of sodium pentobarbital 20% (Kela, Hoogstraten, Belgium). The complete 98
content of caecum and colon was collected and stored at -70°C, while a part of the ileum at the level 99
of Meckel’s diverticulum was fixed in 4% formaldehyde. 100
Morphological examination
101
Formalin fixed ileum segments taken at the level of Meckel’s diverticulum were dehydrated in 102
xylene, embedded in paraffin and sectioned in 4 µm slides. The sections were deparaffinized (2 x 5 103
min) in xylene, rehydrated in isopropylene (5 min), 95 % alcohol (5 min) and 50 % alcohol (5 min) 104
and stained with haematoxylin and eosin. The sections were examined using light microscopy. 105
Villus length and thickness of tunica muscularis were measured by random measurement of 10 villi 106
and 10 measurements of tunica muscularis per section using Leica DM LB2 Digital (Leica 107
Microsystems Belgium BVBA, Diegem, Belgium) and a PC-based image analysis system, 108
LAS V3.8 (Leica application Suit V3, Diegem Belgium). 109
Microbiota composition
110
DNA extraction 111
DNA was extracted from caecum and colon content using the CTAB method as described 112
previously (29, 30). To 100 mg of intestinal content, 0.5 g unwashed glass beads (Sigma-Aldrich, 113
St. Louis, United States), 0.5 ml CTAB buffer (hexadecyltrimethylammonium bromide 5 % (w/v), 114
0.35 M NaCl, 120 mM K2HPO4) and 0.5 ml phenol-chloroform-isoamyl alcohol mixture (25:24:1) 115
(Sigma-Aldrich, St. Louis, United States) were added followed by homogenization in a 2 ml 116
destruction tube. The samples were shaken 6 times for 30 seconds using a beadbeater (MagnaLyser, 117
6 Roche, Basel, Switzerland) at 6000 rpm with 30 seconds between shakings. After centrifugation (10 118
min, 8000 rpm), 300 µl of the supernatant was transferred to a new tube. The rest of the tube 119
content was re-extracted with 250 µl CTAB buffer and again homogenized with a beadbeater. The 120
samples were centrifuged for 10 minutes at 8000 rpm and 300 µl supernatant was added to the first 121
300 µl supernatant. The phenol was removed by adding an equal volume of chloroform-isoamyl 122
alcohol (24:1) (Sigma-Aldrich, St. Louis, United States) and a short spin. The aqueous phase was 123
transferred to a new tube. The nucleic acids were precipitated with two volumes of PEG-6000 124
solution (polyethyleenglycol 30 % (w/v), 1.6 M NaCl) for two hours at room temperature. After 125
centrifugation (20 min, 13000 rpm), the pellet was rinsed with one ml of ice-cold 70 % (v/v) 126
ethanol. The pellet was dried and resuspended in 100 µl RNA free water (VWR, Leuven, Belgium). 127
Quantitative PCR for the total bacteria and the butyryl-CoA:acetate-CoA transferase gene 128
The number of total bacteria and butyryl-CoA:acetate-CoA transferase genes was quantified in 3 129
samples per pen (18 samples per treatment). To determine the number of total bacteria, primers Uni 130
331F (5’-TCCTACGGGAGGCAGCAGT-3’) and Uni 797R
(5’-131
GGACTAACCAGGGTATCTAATCCTGTT-3’) were used (31). Amplification and detection was 132
performed using the CFX384 BioRad detection system (BioRad, Nazareth-Eke, Belgium). Each 133
reaction was done in triplicate in a 12 µl total reaction mixture using 2x SensiMix™ SYBR No-134
ROX mix (Bioline, Kampenhout, Belgium), 0.5 µM final primer concentration and 2 µl of (50 135
ng/µl) DNA. The amplification program consisted of 1 cycle at 95 °C for 10 min followed by 40 136
cycles of 1 min at 94 °C, 1 min at 53°C and 2 min at 60 °C. The fluorescent products were detected 137
at the last step of each cycle. A melting curve analysis was done after amplification and was 138
obtained by slow heating from 60 °C to 95 °C at a rate of 0.5 °C/5 sec to confirm the specificity of 139
the reaction. 140
To quantify the number of gene copies encoding the butyryl-CoA:acetate-CoA transferase enzyme 141
primers BCoATscrF GCIGAICATTTCACITGGAAYWS-3’) and BCoATscrR (5’-142
7 CCTGCCTTTGCAATRTCIACRA ANGC-3’) were used (32). Each reaction was done in triplicate 143
in a 12 µl total reaction mixture using 2x SensiMix™ SYBR No-ROX mix (Bioline, Kampenhout, 144
Belgium), 2.5 µM final primer concentration and 2 µl of (50 ng/µl) DNA. The amplification 145
program consisted of 1 cycle at 95 °C for 10 min followed by 40 cycles of 30 sec at 95 °C, 30 sec at 146
53 °C and 30 sec at 72 °C. 147
16S sequencing to identify microbiota composition 148
Faecal samples derived from one animal per pen (6 per treatment) were used for 16S sequencing. 149
For each sample, 16S rDNA PCR libraries were generated with the primers E9-29 and E514-430 150
(33) targeting hypervariable regions V1-V3. The oligonucleotide design included 454 Life 151
Sciences’s A or B sequencing titanium adapters (Roche Diagnostics, Vilvoorde, Belgium) and 152
multiplex identifiers (MIDs) fused to the 5’ end of each primer. The amplification mix contained 5 153
U of FastStart high fidelity polymerase (Roche Diagnostics, Vilvoorde, Belgium), 1x enzyme 154
reaction buffer, 200 µM dNTPs (Eurogentec, Liège, Belgium), 0.2 µM of each primer and 100 ng 155
of genomic DNA in a volume of 100 µl. Thermocycling conditions consisted of a denaturation at 94 156
°C for 15 min followed by 25 cycles at 94 °C for 40 s, 56 °C for 40 s, 72 °C for 1 min and a final 157
elongation step of 7 min at 72 °C. These amplifications were performed on an Ep Master System 158
gradient apparatus (Eppendorf, Hamburg, Germany). Electrophoresis of the PCR products was done 159
on a 1 % agarose gel and the DNA fragments were plugged out and purified using the SV PCR 160
purification kit (Promega Benelux, Leiden, The Netherlands). The quality and quantity of the 161
products were assessed with a Picogreen dsDNA quantitation assay (Isogen, St-Pieters-Leeuw, 162
Belgium). All libraries were run in the same titanium pyrosequencing reaction using Roche MIDs. 163
All amplicons were sequenced using the Roche GS-Junior Genome Sequencer instrument (Roche, 164
Vilvoorde, Belgium), the sequence number of each sample is normalized to 2323 reads. 165
The 16S rDNA sequence reads were processed with the MOTHUR package (34). The quality of all 166
sequence reads were denoised using the Pyronoise algorithm implemented in MOTHUR and 167
filtered with the following criteria: minimal length of 425 bp, an exact match to the barcode and 1 168
8 mismatch allowed to the proximal primer. The sequences were evaluated for the presence of 169
chimeric amplifications using Uchime (35). The resulting read sets were compared to a reference 170
dataset of aligned sequences of the corresponding region derived from the SILVA database 1.15 of 171
full-length rDNA sequences (http://www.arb-silva.de/) implemented in MOTHUR (36). The final 172
reads were clustered into operational taxonomic units (OTUs) using the nearest neighbour 173
algorithm using MOTHUR with a 0.03 distance unit cut-off. At the OTU level of analysis (OTU 174
definition level for a 0.02 distance matrix), a total of 3052 OTUs were created. A taxonomic 175
identity was attributed to each OTU by comparison with the SILVA database (80 % homogeneity 176
cut-off). As a secondary analysis all unique sequences for each OTU were compared to the SILVA 177
dataset 1.15 using BLASTN algorithm (37). For each OTU, a consensus detailed taxonomic 178
identification was given based upon the identity (less than 1 % of mismatch with the aligned 179
sequence) and the metadata associated with the best hit (validated bacterial species or not). The raw 180
sequences were deposited in Genbank (accession number: PRJNA277118). 181
In vitro fermentation 182
Bacterial strains, growth and co-culture studies 183
The butyrate-producing strain Anaerostipes butyraticus LMG 24724T and the lactate producing 184
strain Lactobacillus crispatus LMG 9479T were purchased from the LMG culture collection. A. 185
butyraticus and L. crispatus were grown in M2GSC (38) and Man-Rogosa-Sharpe (MRS) medium,
186
respectively, in an anaerobic chamber (Ruskinn technology, Bridgend, United Kingdom) with 84 % 187
N2, 8 % H2 and 8 % CO2 at 37 °C. 188
The in vitro fermentation study was conducted using a nutrient-poor medium described by Moura et 189
al. (39) with minor modifications (0.85 g/l casitone, 0.15 g/l enzymatic digest of soya bean, 0.25 g/l 190
NaCl, 0.125 g/l K2HPO4, 5.0g/l bactopeptone, 5.0 g/l yeast nitrogen base and 0.5g/l resazurin. After 191
autoclaving 1 mg/ml cysteine-HCl, 1 % (v/v) of salt solution A (100.0 g/l NH4Cl, 10.0 g/l 192
MgCl2.6H2O, 10.0 g/l CaCl2.2H2O), 1 % (v/v) trace solution (0.025 g/l MnCl2.4H2O, 0.02 g/l 193
9 FeSO4.7H2O, 0.025 g/l ZnCl2, 0.025 g/l CuCl2.2H2O, 0.05 g/l CoCl2.6H2O, 0.05 g/l SeO2, 0.25 g/l 194
NiCl2.6H2O, 0.25 g/l Na2MoO4.2H2O, 0.314 g/l NaVO3, 0.25 g/l H3BO3 dissolved in 0.02M HCl) 195
and 1.2 % (v/v) vitamin/phosphate solution (0.0204 g/l biotin, 0.0205 g/l folic acid, 0.164 g/l Ca D-196
pentothenate, 0.164 g/l nicotinamide, 0.164 g/l riboflavin, 0.164 g/l thiamin HCl, 0.164 g/l 197
pyridoxine HCl, 0.201 g/l para-amino benzoid acid, 0.0205 g/l cyanocobalamin dissolved in 54.7 198
g/l KH2PO4, filter sterile)) containing a mixture of SCFAs (final concentrations: acetate (31mM); 199
propionate (9mM); isobutyrate, isovalerate and valerate (1mM each)). A 5 % stock solution of 200
XOS35, maltodextrin and XOS95 was prepared in the nutrient-poor medium, filter-sterilized (0.2 201
µm), and diluted in the nutrient-poor medium to a final concentration of 0.5 % (v/v). Un-202
supplemented nutrient-poor medium was used as control (blank). The final pH of the medium was 203
adjusted to 6.5 ± 0.1. The media were pre-incubated in an anaerobic cabinet until anaerobiosis, as 204
indicated by the colorless state of resazurin in the media. A. butyraticus and L. crispatus, pre-205
cultured in M2GSC and MRS broth, respectively, at 37 °C under anaerobic conditions for 24 ± 1 h 206
without shaking, were diluted 100-fold in the supplemented and non-supplemented nutrient-poor 207
medium. The co-culture of A. butyraticus and L. crispatus was prepared using equal portions of the 208
inoculum (2 times 1/200) from the 2 pure cultures. After 24 h anaerobic incubation at 37 °C, 209
bacterial growth was monitored by measuring the optical density at 650 nm. After measuring the 210
pH, the cultures were centrifuged at 14000 rpm for 10 min at room temperature. The supernatants 211
were stored at -20 °C until lactate and butyrate concentrations were determined using high-212
performance liquid chromatography (HPLC) analysis. The in vitro fermentation assay was done 213
twice in triplicate. 214
Determination of butyrate and lactate concentrations 215
DL-lactate and butyrate were quantified using HPLC with ultraviolet detection, as described by De 216
Baere et al. (40). The supernatant was acidified using concentrated hydrochloric acid and extracted 217
with diethyl ether for 20 min. The upper ether phase was transferred to another extraction tube and 218
extracted again for 20 min with sodium hydroxide. The aqueous phase was transferred to an 219
10 autosampler vial and concentrated hydrochloric acid was added. An aliquot was injected on the 220
HPLC-UV instrument. The HPLC instrument consisted of a P1000X type quaternary gradient 221
pump, an AS3000 type autosampler, an UV1000 type ultraviolet detector and a SN4000 type 222
system controller, all from ThermoFisher Scientific (Breda, The Netherlands). Chromatographic 223
separation was achieved using a hypersilGold aQ column (150 x 4.6 mm, particle size: 3 µm, 224
ThermoFisher Scientific). Gradient elution (80/20) was performed using NaH2PO4 in HPLC grade 225
water and HPLC grade acetonitrile as mobile phase A and B, respectively. The detector was set at a 226
wavelength of 210 nm. The Chromquest software (ThermoFisher Scientific) was used for data 227
processing. 228
Statistical analysis
229
The comparison of the performance data was performed with an independent samples t-test (SPSS 230
22.0). For the qPCR and morphology data were analyzed by means of a linear mixed effect model 231
with pen included as random effect (S-Plus). The differences were considered statistically 232
significant at P value ≤ 0.05 and considered as a tendency at P ≤ 0.1. Statistical differences in 233
relative abundance in bacterial population between groups were assessed by non-parametric 234
Kruskal-Wallis H test with Benjamin-Hochberg False Discovery Rate screen and Tukey-Kramer 235
post-hoc test. Moreover, differences in specific bacterial population relative abundance based on 236
16S profiling were analyzed with non-parametric Mann-Whitney test using a two-tailed P value 237
calculation. GraphPad Prism software version 5 was used to perform the statistical analysis for the 238
in vitro fermentation. All quantitative parameters (pH, OD, SCFA concentrations) were compared
239
using the Kruskal-Wallis test. The Dunns post hoc test was applied for multicomparisons of these 240
variables if there was a significant difference with the Kruskal-Wallis test. 241
Results
242
Broiler performance after supplementation of broiler feed with XOS35
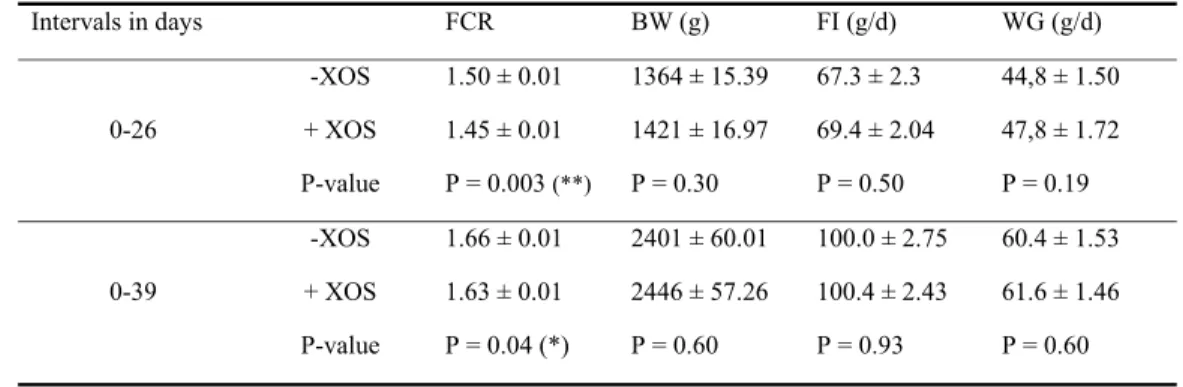
11 To evaluate the effect of XOS on broiler performance, the body weight and feed intake were 244
measured and FCR and growth were calculated. When considering the starter and grower period 245
together (day 0 to day 26), the FCR was significantly (P = 0.003) more favorable for chickens fed 246
the XOS-supplemented diet compared to the chickens fed the control diet (Table 2). For the whole 247
trial period (day 0 – 39), the FCR was also significantly improved (lower) for the group receiving 248
the XOS-supplemented diet (P = 0.04). The average body weight at the different time points was 249
non-significantly higher for chickens fed the diet supplemented with 0.5 % XOS compared to the 250
chickens given the non-supplemented diet. These results together with the significantly improved 251
FCR show a biologically relevant improved performance for chickens given the XOS-supplemented 252
diet. 253
Intestinal morphology
254
Supplementation of 0.5 % XOS to the broiler feed significantly (P = 0.04) increased the villus 255
length in the ileum (Table 3). The tunica muscularis was shown (P = 0.38) to be thicker in the 256
group fed the XOS-supplemented diet (Table 3). 257
Microbiota composition as determined by qPCR and 16S sequencing
258
There was no difference in the number of total bacteria between the XOS-supplemented and non-259
supplemented group in both the caecum and the colon (Fig. 1A). The number of gene copies 260
encoding the butyryl-CoA:acetate-CoA transferase was significantly (P = 0.02) higher in the caeca 261
of the chickens that received 0.5 % XOS (Fig. 1B). 262
Significant changes were observed in the abundance of specific 16S sequences in caecum and colon 263
samples at different taxonomic levels (Fig. 2, Table 4). Although 35 bacterial families were 264
detected in the caecal microbiota, only the abundance of Clostridium cluster XIVa was shown to be 265
significantly (P = 0.005) increased in animals fed a XOS-supplemented diet as compared to animals 266
fed a control diet (44.29% vs 29.65%, Table 4). Forty one bacterial families were detected in the 267
colon microbiota of which Lactobacillaceae was shown to be significantly (P = 0.033) higher in 268
12 animals fed a XOS-supplemented diet compared to animals fed a control diet (81.54% vs 41.73%). 269
In the caecal samples a total of 834 species were detected of which 16 were shown to be 270
significantly different between the XOS treated and control animals. A significant higher abundance 271
was observed for Anaerostipes butyraticus, a butyrate producing species classified within 272
Clostridium cluster XIVa (from 0.4 % to 2.5 %, P = 0.048, Fig. 2). Seven hundred twenty one
273
species were detected in the colon samples of which 11 were shown to be significantly different in 274
animals receiving dietary XOS compared to control diet. XOS supplementation resulted in a 275
significant increase of Lactobacillus crispatus (from 4 % to 15 %, P = 0.007, Fig. 2) in the colon. 276
In vitro fermentation 277
To investigate cross-feeding between L. crispatus and A. butyraticus in the presence of XOS, an in 278
vitro fermentation assay was carried out. XOS95 and maltodextrin were used to confirm the effect
279
of XOS in the in vivo trial. Only the monoculture of L. crispatus resulted in a small pH drop when 280
XOS35 was added to the medium (6.4 ± 0.04 versus 6.2 ± 0.04, Fig. 3). A. butyraticus showed a 281
significantly increased (P = 0.007) proliferation when XOS35 and XOS95 were added to the 282
medium compared to maltodextrin (Fig. 3). The proliferation of L. crispatus increased significantly 283
when XOS35 was added to the medium. The proliferation of the strains in the co-culture was higher 284
when XOS35 or XOS95 was added compared to the non-supplemented media (Fig. 3). 285
Supplementation of maltodextrin to the medium did not cause any changes. 286
The concentrations of the fermentation acids butyrate and DL-lactate were determined after 287
incubation, in all monocultures and co-cultures (Fig. 4). It was found that A. butyraticus was able to 288
produce butyrate, while L. crispatus produced high concentrations of lactate. The concentration of 289
butyrate or lactate produced by L. crispatus and A. butyraticus, respectively, were below the cut-off 290
values (1mM and 0.5 mM respectively) as determined during optimization of the HPLC method 291
(40). XOS35 and XOS95 significantly stimulated lactate production by L. crispatus compared with 292
A. butyraticus, which was not able to produce lactate. In the co-culture, lactate concentrations were
13 very low, even when XOS35 or XOS95 were added to the medium, while the butyrate 294
concentration was higher as compared to the concentrations in the monoculture of A. butyraticus 295
with XOS35 (3.3 ± 0.8 versus 2.3 ± 0.6, Fig. 4), but non-significant. A similar observation was 296
made for XOS95 (2.4 ± 0.8 versus 1.6 ± 0.6). 297
Discussion
298
It is generally accepted that shifts in the intestinal microbiota composition may be the result of 299
dietary changes, such as the addition of cereal fibres (22, 41,42). In the current study, we 300
demonstrated that administration of XOS to broiler feed altered the microbiota composition in the 301
gut, with butyrate-producing bacteria and lactobacilli being more abundant in caeca and colon, 302
respectively. 303
In the chicken gut, lactobacilli are one of the predominant genera (43). These bacteria have the 304
ability to adhere to the mucosal layers and epithelium, promoting colonisation (44, 45). Through 305
interaction with the intestinal epithelial cells, lactobacilli can cause immunomodulation and offer 306
protection to the intestinal barrier by antagonistic activities against pathogens (45-47). In addition, 307
the probiotic use of lactobacilli has been shown to beneficially affect performance in broilers. 308
Broilers fed diets containing a mixture of 12 Lactobacillus strains or a single Lactobacillus 309
acidophilus strain had a better weight gain and a better FCR (48, 49). Lactobacilli are known to
310
ferment carbohydrates into lactic acid as major end-product which may lower the pH of the 311
intestinal environment resulting in the inhibition of growth of acid-sensitive pathogenic bacteria. 312
However, this pH effect may be rather limited as lactic acid is absorbed from the intestine or used 313
as a substrate for lactate-utilizing bacteria, such as representatives of the genera Eubacterium, 314
Anaerostipes, Veillonella and Megasphaera (50, 51).
315
In the present study, in addition to the significant higher abundance of lactobacilli in the colon, we 316
found an increased number of butyryl-CoA:acetate CoA-transferase gene copies in the caeca of 317
14 chickens that received a XOS supplemented diet. Butyryl-CoA:acetate CoA-transferase is a key 318
enzyme in the major pathway for bacterial butyrate production in the gut (7). Hippe et al. showed 319
that this enzyme is a suitable marker for the butyrate producing capacity of the intestinal microbiota 320
which mainly belong to Clostridium cluster IV and XIVa (52),(53). We observed a significant 321
increase of members from both clusters in the caeca of chickens that were administered XOS. 322
The increased abundance of both lactobacilli and butyrate-producing bacteria can partly be 323
explained by cross-feeding mechanisms. Bacteria related to Eubacterium hallii and Anaerostipes 324
caccae, both members of Clostridium cluster XIVa, are able to convert acetate and lactate into
325
butyrate (7, 54). This metabolic cross-feeding between lactate producing and lactate utilizing 326
bacteria may help to stabilize the luminal pH and may be a factor in the butyrogenic effect of 327
certain dietary substrates (55). Our in vivo study showed a significant increase of the lactate 328
producing species Lactobacillus crispatus in the colon and the lactate-utilizing butyrate-producing 329
species Anaerostipes butyraticus in the caeca. The lactic acid produced by L. crispatus in the colon 330
may reach the caecum and become available for A. butyraticus due to antiperistalsis (56, 57). The in 331
vitro fermentation assay showed that reference strains of both species metabolized XOS resulting in
332
production of high concentrations of lactic acid by L. crispatus, which were supposed to be 333
consumed by the butyrate-producing bacterium A. butyraticus. Most likely also many other strains 334
can carry out a similar cross-feeding reaction in order to generate high butyrate levels in the chicken 335
hindgut. 336
Production of butyrate most probably plays a role in the beneficial effects on gut morphology and 337
growth performance observed in the current study. In poultry, butyrate enhances non-specific 338
intestinal defence mechanisms against pathogens that can affect performance, such as Clostridium 339
perfringens, by stimulating the mucin glycoprotein expression in intestinal epithelial cells (58-60).
340
Butyrate is a major energy source for the colonocytes and exerts anti-inflammatory activities by 341
several mechanisms (61). One of these mechanisms is the suppression of nuclear factor kappa B 342
15 (NF-κB) that regulates the expression of pro-inflammatory cytokines (62). Butyrate has also been 343
shown to interfere with signalling by interferon-γ (IFN- γ) through its inhibitory effect on the 344
activation of signal transducer and activator of transcription 1 (STAT1) (63). Butyrate also 345
upregulates the expression of peroxisome proliferator-activated receptor-γ (PPAR-γ), a transcription 346
factor that belongs to the nuclear hormone receptor family. PPAR-γ inhibits the expression of 347
inflammatory cytokines and directs the differentiation of immune cells towards anti-inflammatory 348
phenotypes (64-66). 349
We observed longer villi in the ileum of chickens that were fed a XOS-supplemented diet as 350
compared to chickens fed a control diet. This effect on the small intestinal morphology may at least 351
partly be due to butyrate production by Clostridium cluster IV and XIVa species in the hindgut 352
through its effect on the expression of glucagon-like peptide-2 (GLP-2). Butyrate indeed appears to 353
be a strong stimulator of GLP-2 production. This hormone is secreted by entero-endocrine L-cells 354
and acts indirectly through multiple downstream mediators (67). Its receptor (GLP-2R) is localized 355
on distinct subpopulations of gut endocrine cells in the stomach, small intestine, and colon but also 356
on subepithelial myofibroblasts (68, 69). Hu et al. showed a beneficial effect of intravenous GLP-2 357
injection in broilers on growth performance, intestinal morphology, villi height and crypt cell 358
proliferation (70). 359
In conclusion, XOS, supplemented to the broiler diet, improved broiler performance by improving 360
the feed conversion ratio. Administration of XOS resulted in an increased abundance of butyrate-361
producing bacteria in the caeca and lactobacilli in the colon at day 26 of age. It is hypothesized that 362
microbial cross-feeding, in which lactic acid produced by the lactobacilli is consumed by butyrate-363
producing bacteria in the caeca stimulates gut heath and consequently performance, through the 364
beneficial effects of butyrate. Whether this cross-feeding also occurs in the complex gut ecosystem, 365
needs to be clarified in further in vivo work. 366
16
Acknowledgments
367
We are grateful to Christian Puttevils and Delphine Ameye for their skillful technical assistance 368
with the morphological examination. The authors are grateful to the PDV animal feed of The 369
Netherlands government for financial support of this work. The authors acknowledge the PhD 370
students from the department of pathology, bacteriology and avian diseases who assisted in the 371
sampling of the in vivo trial. 372
17
REFERENCES
374
1. McCleary BV. 2003. Dietary fibre analysis. The Proceedings of the Nutrition Society
62:3-375 9. 376
2. James SL, Muir JG, Curtis SL, Gibson PR. 2003. Dietary fibre: a roughage guide.
377
Internal Medicine Journal 33:291-296. 378
3. Broekaert WF, Courtin CM, Verbeke K, Van de Wiele T, Verstraete W, Delcour JA.
379
2011. Prebiotic and other health-related effects of cereal-derived arabinoxylans, arabinoxylan-380
oligosaccharides, and xylooligosaccharides. Critical Reviews in Food Science and Nutrition 381
51:178-194.
382
4. Aachary AA, Prapulla SG. 2008. Corncob-induced endo-1,4-beta-d-xylanase of
383
Aspergillus oryzae MTCC 5154: production and characterization of xylobiose from
384
glucuronoxylan. Journal of Agricultural and Food Chemistry 56:3981-3988. 385
5. Gibson GR, Probert HM, Loo JV, Rastall RA, Roberfroid MB. 2004. Dietary
386
modulation of the human colonic microbiota: updating the concept of prebiotics. Nutrition Research 387
Reviews 17:259-275. 388
6. Scott KP, Martin JC, Duncan SH, Flint HJ. 2014. Prebiotic stimulation of human colonic
389
butyrate-producing bacteria and bifidobacteria, in vitro. FEMS Microbiology Ecology 87:30-40. 390
7. Duncan SH, Louis P, Flint HJ. 2004. Lactate-utilizing bacteria, isolated from human feces,
391
that produce butyrate as a major fermentation product. Applied and Environmental Microbiology 392
70:5810-5817.
393
8. Guilloteau P, Martin L, Eeckhaut V, Ducatelle R, Zabielski R, Van Immerseel F. 2010.
394
From the gut to the peripheral tissues: the multiple effects of butyrate. Nutrition research reviews 395
23:366-384.
396
9. Canani RB, Costanzo MD, Leone L, Pedata M, Meli R, Calignano A. 2011. Potential
397
beneficial effects of butyrate in intestinal and extraintestinal diseases. World Journal of 398
Gastroenterology : WJG 17:1519-1528. 399
10. Hsu CK, Liao JW, Chung YC, Hsieh CP, Chan YC. 2004. Xylooligosaccharides and 400
fructooligosaccharides affect the intestinal microbiota and precancerous colonic lesion development 401
in rats. The Journal of Nutrition 134:1523-1528. 402
11. Gobinath D, Madhu AN, Prashant G, Srinivasan K, Prapulla SG. 2010. Beneficial
403
effect of xylo-oligosaccharides and fructo-oligosaccharides in streptozotocin-induced diabetic rats. 404
The British Journal of Nutrition 104:40-47. 405
12. Smiricky-Tjardes MR, Flickinger EA, Grieshop CM, Bauer LL, Murphy MR, Fahey
406
GC, Jr. 2003. In vitro fermentation characteristics of selected oligosaccharides by swine fecal
407
microflora. Journal of Animal Science 81:2505-2514. 408
13. Zhenping S, Wenting L, Ruikui Y, Jia L, Honghong L, Wei S, Zhongmie W, Jingpan
409
L, Zhe S, Yuling Q. 2013. Effect of a straw-derived xylooligosaccharide on broiler growth
410
performance, endocrine metabolism, and immune response. Canadian Journal of Veterinary 411
Research = Revue canadienne de recherche veterinaire 77:105-109. 412
18
14. Sekelja M, Rud I, Knutsen SH, Denstadli V, Westereng B, Naes T, Rudi K. 2012.
413
Abrupt temporal fluctuations in the chicken fecal microbiota are explained by its gastrointestinal 414
origin. Applied and Environmental Microbiology 78:2941-2948. 415
15. Meimandipour A, Shuhaimi M, Hair-Bejo M, Azhar K, Kabeir BM, Rasti B, Yazid
416
AM. 2009. In vitro fermentation of broiler cecal content: the role of lactobacilli and pH value on the
417
composition of microbiota and end products fermentation. Letters in Applied Microbiology 49:415-418
420. 419
16. Dumonceaux TJ, Hill JE, Hemmingsen SM, Van Kessel AG. 2006. Characterization of
420
intestinal microbiota and response to dietary virginiamycin supplementation in the broiler chicken. 421
Applied and Environmental Microbiology 72:2815-2823. 422
17. Gong J, Forster RJ, Yu H, Chambers JR, Sabour PM, Wheatcroft R, Chen S. 2002.
423
Diversity and phylogenetic analysis of bacteria in the mucosa of chicken ceca and comparison with 424
bacteria in the cecal lumen. FEMS Microbiology Letters 208:1-7. 425
18. Lepage P, Leclerc MC, Joossens M, Mondot S, Blottiere HM, Raes J, Ehrlich D, Dore
426
J. 2013. A metagenomic insight into our gut's microbiome. Gut 62:146-158.
427
19. Qin J, Li R, Raes J, Arumugam M, Burgdorf KS, Manichanh C, Nielsen T, Pons N,
428
Levenez F, Yamada T, Mende DR, Li J, Xu J, Li S, Li D, Cao J, Wang B, Liang H, Zheng H,
429
Xie Y, Tap J, Lepage P, Bertalan M, Batto JM, Hansen T, Le Paslier D, Linneberg A, Nielsen
430
HB, Pelletier E, Renault P, Sicheritz-Ponten T, Turner K, Zhu H, Yu C, Li S, Jian M, Zhou
431
Y, Li Y, Zhang X, Li S, Qin N, Yang H, Wang J, Brunak S, Dore J, Guarner F, Kristiansen K,
432
Pedersen O, Parkhill J, Weissenbach J, Meta HITC, Bork P, Ehrlich SD, Wang J. 2010. A
433
human gut microbial gene catalogue established by metagenomic sequencing. Nature 464:59-65. 434
20. Torok VA, Ophel-Keller K, Loo M, Hughes RJ. 2008. Application of methods for
435
identifying broiler chicken gut bacterial species linked with increased energy metabolism. Applied 436
and Environmental Microbiology 74:783-791. 437
21. Lu J, Idris U, Harmon B, Hofacre C, Maurer JJ, Lee MD. 2003. Diversity and
438
succession of the intestinal bacterial community of the maturing broiler chicken. Applied and 439
Environmental Microbiology 69:6816-6824. 440
22. Knarreborg A, Simon MA, Engberg RM, Jensen BB, Tannock GW. 2002. Effects of
441
dietary fat source and subtherapeutic levels of antibiotic on the bacterial community in the ileum of 442
broiler chickens at various ages. Applied and Environmental Microbiology 68:5918-5924. 443
23. Apajalahti J, Kettunen A, Graham H. 2004. Characteristics of the gastrointestinal
444
microbial communities, with special reference to the chicken. World Poultry Sci J 60:223-232. 445
24. Bjerrum L, Engberg RM, Leser TD, Jensen BB, Finster K, Pedersen K. 2006. Microbial
446
community composition of the ileum and cecum of broiler chickens as revealed by molecular and 447
culture-based techniques. Poultry Science 85:1151-1164. 448
25. Collins MD, Lawson PA, Willems A, Cordoba JJ, Fernandez-Garayzabal J, Garcia P,
449
Cai J, Hippe H, Farrow JA. 1994. The phylogeny of the genus Clostridium: proposal of five new
450
genera and eleven new species combinations. Int J Syst Bacteriol 44:812-826. 451
26. Duncan SH, Louis P, Flint HJ. 2007. Cultivable bacterial diversity from the human colon.
452
Letters in Applied Microbiology 44:343-350. 453
19
27. Pryde SE, Duncan SH, Hold GL, Stewart CS, Flint HJ. 2002. The microbiology of
454
butyrate formation in the human colon. FEMS Microbiology Letters 217:133-139. 455
28. Rey FE, Faith JJ, Bain J, Muehlbauer MJ, Stevens RD, Newgard CB, Gordon JI. 2010.
456
Dissecting the in vivo metabolic potential of two human gut acetogens. The Journal of Biological 457
Chemistry 285:22082-22090. 458
29. Griffiths RI, Whiteley AS, O'Donnell AG, Bailey MJ. 2000. Rapid method for
459
coextraction of DNA and RNA from natural environments for analysis of ribosomal DNA- and 460
rRNA-based microbial community composition. Applied and Environmental Microbiology 461
66:5488-5491.
462
30. Kowalchuk GA, Stienstra AW, Heilig GH, Stephen JR, Woldendorp JW. 2000.
463
Molecular analysis of ammonia-oxidising bacteria in soil of successional grasslands of the 464
Drentsche A (The Netherlands). FEMS Microbiology Ecology 31:207-215. 465
31. Hopkins MJ, Macfarlane GT, Furrie E, Fite A, Macfarlane S. 2005. Characterisation of
466
intestinal bacteria in infant stools using real-time PCR and northern hybridisation analyses. FEMS 467
Microbiology Ecology 54:77-85. 468
32. Louis P, Flint HJ. 2007. Development of a semiquantitative degenerate real-time pcr-based
469
assay for estimation of numbers of butyryl-coenzyme A (CoA) CoA transferase genes in complex 470
bacterial samples. Applied and Environmental Microbiology 73:2009-2012. 471
33. Brosius J, Dull TJ, Sleeter DD, Noller HF. 1981. Gene organization and primary structure
472
of a ribosomal RNA operon from Escherichia coli. Journal of Molecular Biology 148:107-127. 473
34. Schloss PD, Westcott SL, Ryabin T, Hall JR, Hartmann M, Hollister EB, Lesniewski
474
RA, Oakley BB, Parks DH, Robinson CJ, Sahl JW, Stres B, Thallinger GG, Van Horn DJ,
475
Weber CF. 2009. Introducing mothur: open-source, platform-independent, community-supported
476
software for describing and comparing microbial communities. Applied and environmental 477
microbiology 75:7537-7541. 478
35. Edgar RC, Haas BJ, Clemente JC, Quince C, Knight R. 2011. UCHIME improves
479
sensitivity and speed of chimera detection. Bioinformatics 27:2194-2200. 480
36. Pruesse E, Quast C, Knittel K, Fuchs BM, Ludwig W, Peplies J, Glockner FO. 2007.
481
SILVA: a comprehensive online resource for quality checked and aligned ribosomal RNA sequence 482
data compatible with ARB. Nucleic Acids Research 35:7188-7196. 483
37. Altschul SF, Gish W, Miller W, Myers EW, Lipman DJ. 1990. Basic local alignment
484
search tool. Journal of Molecular Biology 215:403-410. 485
38. Barcenilla A, Pryde SE, Martin JC, Duncan SH, Stewart CS, Henderson C, Flint HJ.
486
2000. Phylogenetic relationships of butyrate-producing bacteria from the human gut. Applied and 487
Environmental Microbiology 66:1654-1661. 488
39. Moura P, Barata R, Carvalheiro F, Girio F, Loureiro-Dias MC, Esteves MP. 2007. In
489
vitro fermentation of xylo-oligosaccharides from corn cobs autohydrolysis by Bifidobacterium and
490
Lactobacillus strains. Lwt-Food Sci Technol 40:963-972.
491
40. De Baere S, Eeckhaut V, Steppe M, De Maesschalck C, De Backer P, Van Immerseel F,
492
Croubels S. 2013. Development of a HPLC-UV method for the quantitative determination of four
493
short-chain fatty acids and lactic acid produced by intestinal bacteria during in vitro fermentation. J 494
Pharm Biomed Anal 80:107-115. 495
20
41. Shakouri MD, Kermanshahi H, Mohsenzadeh M. 2006. Effect of different non starch
496
polysaccharides in semi purified diets on performance and intestinal microflora of young broiler 497
chickens. International Journal of Poultry Science 5 6:557-561. 498
42. Torok VA, Hughes RJ, Mikkelsen LL, Perez-Maldonado R, Balding K, MacAlpine R,
499
Percy NJ, Ophel-Keller K. 2011. Identification and characterization of potential
performance-500
related gut microbiotas in broiler chickens across various feeding trials. Applied and Environmental 501
Microbiology 77:5868-5878. 502
43. Wei S, Morrison M, Yu Z. 2013. Bacterial census of poultry intestinal microbiome. Poultry
503
Science 92:671-683. 504
44. Kravtsov EG, Yermolayev AV, Anokhina IV, Yashina NV, Chesnokova VL, Dalin MV.
505
2008. Adhesion characteristics of Lactobacillus is a criterion of the probiotic choice. Bulletin of 506
Experimental Biology and Medicine. Feb;145(2):232-234. 507
45. Sengupta R, Altermann E, Anderson RC, McNabb WC, Moughan PJ, Roy NC. 2013.
508
The role of cell surface architecture of lactobacilli in host-microbe interactions in the 509
gastrointestinal tract. Mediators of Inflammation 2013:237921. 510
46. Servin AL. 2004. Antagonistic activities of lactobacilli and bifidobacteria against microbial
511
pathogens. FEMS Microbiology Reviews 28:405-440. 512
47. Rinttila T, Apajalathi J. 2013. Intestinal microbiota and metabolites-implications for
513
broiler chicken health and performance. J. Appl. Poult. Res. 22:647-658. 514
48. Jin LZ, Ho YW, Abdullah N, Jalaludin S. 1998. Growth performance, intestinal microbial
515
populations, and serum cholesterol of broilers fed diets containing Lactobacillus cultures. Poultry 516
Science 77:1259-1265. 517
49. Jin LZ, Ho YW, Abdullah N, Jalaludin S. 2000. Digestive and bacterial enzyme activities
518
in broilers fed diets supplemented with Lactobacillus cultures. Poultry Science 79:886-891. 519
50. Belenguer A, Duncan SH, Holtrop G, Anderson SE, Lobley GE, Flint HJ. 2007. Impact
520
of pH on lactate formation and utilization by human fecal microbial communities. Applied and 521
Environmental Microbiology 73:6526-6533. 522
51. Harmsen HJM, Raangs GC, He T, Degener JE, Welling GW. 2002. Extensive set of 16S
523
rRNA-based probes for detection of bacteria in human feces. Applied and Environmental 524
Microbiology 68:2982-2990. 525
52. Hippe B, Zwielehner J, Liszt K, Lassl C, Unger F, Haslberger AG. 2011. Quantification
526
of butyryl CoA:acetate CoA-transferase genes reveals different butyrate production capacity in 527
individuals according to diet and age. FEMS Microbiology Letters 316:130-135. 528
53. Louis P, Flint HJ. 2009. Diversity, metabolism and microbial ecology of
butyrate-529
producing bacteria from the human large intestine. FEMS Microbiology Letters 294:1-8. 530
54. Sato T, Matsumoto K, Okumura T, Yokoi W, Naito E, Yoshida Y, Nomoto K, Ito M,
531
Sawada H. 2008. Isolation of lactate-utilizing butyrate-producing bacteria from human feces and in
532
vivo administration of Anaerostipes caccae strain L2 and galacto-oligosaccharides in a rat model. 533
FEMS Microbiology Ecology 66:528-536. 534
21
55. Belenguer A, Duncan SH, Calder AG, Holtrop G, Louis P, Lobley GE, Flint HJ. 2006.
535
Two routes of metabolic cross-feeding between Bifidobacterium adolescentis and butyrate-536
producing anaerobes from the human gut. Applied and Environmental Microbiology 72:3593-3599. 537
56. Hodgkiss JP. 1984. Peristalsis and antiperistalsis in the chicken caecum are myogenic.
538
Quarterly Journal of Experimental Physiology 69:161-170. 539
57. Janssen PW, Lentle RG, Hulls C, Ravindran V, Amerah AM. 2009. Spatiotemporal
540
mapping of the motility of the isolated chicken caecum. Journal of comparative physiology. B, 541
Biochemical, Systemic, and Environmental Physiology 179:593-604. 542
58. Gantois I, Ducatelle R, Pasmans F, Haesebrouck F, Hautefort I, Thompson A, Hinton
543
JC, Van Immerseel F. 2006. Butyrate specifically down-regulates Salmonella pathogenicity island
544
1 gene expression. Applied and Environmental Microbiology 72:946-949. 545
59. Timbermont L, Lanckriet A, Dewulf J, Nollet N, Schwarzer K, Haesebrouck F,
546
Ducatelle R, Van Immerseel F. 2010. Control of Clostridium perfringens-induced necrotic
547
enteritis in broilers by target-released butyric acid, fatty acids and essential oils. Avian Pathology 548
39:117-121.
549
60. Willemsen LEM, Koetsier MA, van Deventer SJH, van Tol EAF. 2003. Short chain fatty
550
acids stimulate epithelial mucin 2 expression through differential effects on prostaglandin E-1 and 551
E-2 production by intestinal myofibroblasts. Gut 52:1442-1447. 552
61. Hamer HM, Jonkers D, Venema K, Vanhoutvin S, Troost FJ, Brummer RJ. 2008.
553
Review article: the role of butyrate on colonic function. Alimentary Pharmacology & Therapeutics 554
27:104-119.
555
62. Inan MS, Rasoulpour RJ, Yin L, Hubbard AK, Rosenberg DW, Giardina C. 2000. The
556
luminal short-chain fatty acid butyrate modulates NF-kappa B activity in a human colonic epithelial 557
cell line. Gastroenterology 118:724-734. 558
63. Klampfer L, Huang J, Sasazuki T, Shirasawa S, Augenlicht L. 2003. Inhibition of
559
interferon gamma signaling by the short chain fatty acid butyrate. Mol Cancer Res 1:855-862. 560
64. Wächtershäuser A, Loitsch SL, J. S. 2000. PPAR-g is selectively upregulated in Caco-2
561
cells by butyrate. Biochem Bioph Res Co 272:380–385. 562
65. Schwab M, Reynders V, Loitsch S, Steinhilber D, Stein J, Schroder O. 2007.
563
Involvement of different nuclear hormone receptors in butyrate-mediated inhibition of inducible NF 564
kappa B signalling. Molecular Immunology 44:3625-3632. 565
66. Martin H. 2010. Role of PPAR-gamma in inflammation. Prospects for therapeutic
566
intervention by food components. Mutation Research 690:57-63. 567
67. Dube PE, Brubaker PL. 2007. Frontiers in glucagon-like peptide-2: multiple actions,
568
multiple mediators. Am J Physiol-Endoc M 293:E460-E465. 569
68. Drucker DJ. 2001. Minireview: the glucagon-like peptides. Endocrinology 142:521-527.
570
69. de Heuvel E, Wallace L, Sharkey KA, Sigalet DL. 2012. Glucagon-like peptide 2 induces
571
vasoactive intestinal polypeptide expression in enteric neurons via phophatidylinositol 3-kinase-572
gamma signaling. American Journal of Physiology. Endocrinology and Metabolism 303:E994-573
1005. 574
22
70. Hu XF, Guo YM, Huang BY, Bun S, Zhang LB, Li JH, Liu D, Long FY, Yang X, Jiao
575
P. 2010. The effect of glucagon-like peptide 2 injection on performance, small intestinal
576
morphology, and nutrient transporter expression of stressed broiler chickens. Poultry Science 577
89:1967-1974.
578 579 580
23
Tables
581
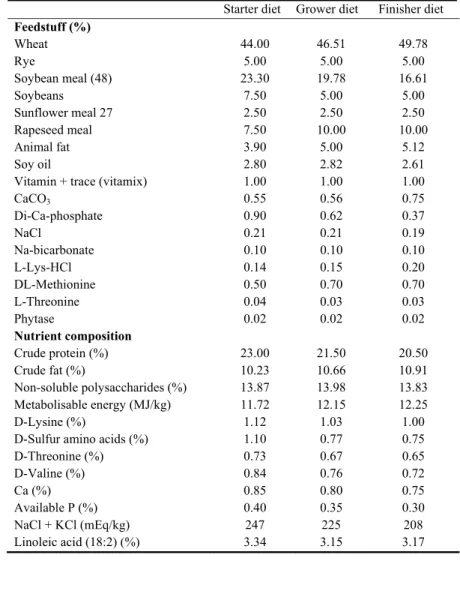
TABLE 1: The composition and nutrient content of the wheat/rye diet administered to chickens. Starter diet was given from day 1 582
until 13, grower was given from day 14 until 26 and finisher was given from day 27 until 39.
583
TABLE 2:The effect of XOS supplementation on the growth performance of the chickens. Feed conversion ratio (FCR), body
584
weight (BW), feed intake (FI) and weight gain (WG) were measured at three time intervals for animals fed a wheat/rye-based diet
585
without or with supplemented with 0.2% XOS (day 1-13) and 0.5% XOS (day 14-26; 27-39). Values are the mean of 6 pens with 32
586
chickens ± standard error of the mean and n is the number of the chickens in each group. Statistical analysis was done with SPSS.
587
Independent samples t-test was used to determine statistical differences between groups receiving non-supplemented and XOS
588
supplemented diet. P-values less than 0.05 and 0.001 were considered significant (*, **).
589
TABLE 3:The effects of XOS supplementation on the intestinal morphology of chickens on day 26. The data shown are the mean
590
length of the villi (µm) and mean thickness of the tunica muscularis (µm) in ileal sections taken at day 26 of animals fed a
wheat/rye-591
based diet, without or with supplemented with 0.5 % XOS (n=18). The length and the thickness were measured of 10 randomly
592
selected villi and 10 different places for the tunica muscularis using a PC-based analysis system. Statistical analysis was done with
593
S-plus, using a linear mixed effects model with pen as random factor. P-value less than 0.05 were considered significant.
594
TABLE 4:List of Clostridium cluster XIVa and cluster IV members identified in the caeca of chickens at day 26 of which the
595
relative proportion was significantly different between the XOS supplemented and unsupplemented group. The results are based on
596
the sequencing data of 6 chickens per treatment (ns, not significant).
24
Figures
598
FIGURE 1: Number of total bacteria (A) and butyryl-CoA:acetate-CoA transferase gene copies (B) expressed as log10 copy number 599
of the gene per g of wet content in the caecal and colonic content of 26-day old chickens fed a wheat/rye-based diet either or not
600
supplemented with 0.5% XOS (18 chickens for each treatment). Statistical analysis is done with S-plus using a linear mixed effects
601
model with pen as random factor to determine statistical difference between groups of animals fed a wheat/rye- based diet without
602
and with XOS. * P ≤ 0.05
603
FIGURE 2: Box plots showing mean relative sequence abundance of the Clostridium cluster XIVa and Anaerostipes butyraticus in 604
the caecum (A) and of the Lactobacillaceae and Lactobacillus crispatus in the colon (B) of 26-day old chickens fed without or with
605
XOS-supplemented feed (6 chickens for each treatment). The plus represents the mean value and the whiskers are the median, the
606
min/max value and 1ste/3rd quartiles. 607
FIGURE 3: pH values and optical densities (650 nm) after 24 h of in vitro fermentation of different substrates by A. butyraticus, L. 608
crispatus and both in co-culture. All the in vitro fermentation experiments were done twice in triplicate. Statistical analysis was done 609
with GraphPad Prism 5, using a Kruskal-Wallis test with a Dunns post hoc test. P-values ≤ 0.05 (*) and ≤ 0.01 (**) were considered
610
significant.
611
FIGURE 4: Butyrate and DL-lactate concentration after 24 h of in vitro fermentation of different substrates by A. butyraticus, L. 612
crispatus and both in co-culture. The in vitro fermentation experiments were done twice in triplicate. Statistical analysis was done 613
with GraphPad Prism 5, using a Kruskal-Wallis test followed by a Dunns post hoc test. P-values ≤ 0.05 (*), ≤ 0.01 (**) and < 0.001
614
(***) were considered significant.
1
Tables
1
TABLE 1: The composition and nutrient content of the wheat/rye diet administered to chickens. Starter diet was given from day 1 2
until 13, grower was given from day 14 until 26 and finisher was given from day 27 until 39.
3
Starter diet Grower diet Finisher diet
Feedstuff (%) Wheat 44.00 46.51 49.78 Rye 5.00 5.00 5.00 Soybean meal (48) 23.30 19.78 16.61 Soybeans 7.50 5.00 5.00 Sunflower meal 27 2.50 2.50 2.50 Rapeseed meal 7.50 10.00 10.00 Animal fat 3.90 5.00 5.12 Soy oil 2.80 2.82 2.61
Vitamin + trace (vitamix) 1.00 1.00 1.00
CaCO3 0.55 0.56 0.75 Di-Ca-phosphate 0.90 0.62 0.37 NaCl 0.21 0.21 0.19 Na-bicarbonate 0.10 0.10 0.10 L-Lys-HCl 0.14 0.15 0.20 DL-Methionine 0.50 0.70 0.70 L-Threonine 0.04 0.03 0.03 Phytase 0.02 0.02 0.02 Nutrient composition Crude protein (%) 23.00 21.50 20.50 Crude fat (%) 10.23 10.66 10.91 Non-soluble polysaccharides (%) 13.87 13.98 13.83 Metabolisable energy (MJ/kg) 11.72 12.15 12.25 D-Lysine (%) 1.12 1.03 1.00
D-Sulfur amino acids (%) 1.10 0.77 0.75
D-Threonine (%) 0.73 0.67 0.65 D-Valine (%) 0.84 0.76 0.72 Ca (%) 0.85 0.80 0.75 Available P (%) 0.40 0.35 0.30 NaCl + KCl (mEq/kg) 247 225 208 Linoleic acid (18:2) (%) 3.34 3.15 3.17 4
TABLE 2: The effect of XOS supplementation on the growth performance of the chickens. Feed conversion ratio (FCR), body 5
weight (BW), feed intake (FI) and weight gain (WG) were measured at three time intervals for animals fed a wheat/rye-based diet
6
without or with supplemented with 0.2% XOS (day 1-13) and 0.5% XOS (day 14-26; 27-39). Values are the mean of 6 pens with 32
7
chickens ± standard error of the mean and n is the number of the chickens in each group. Statistical analysis was done with SPSS.
2
Independent samples t-test was used to determine statistical differences between groups receiving non-supplemented and XOS
9
supplemented diet. P-values less than 0.05 and 0.001 were considered significant (*, **).
10 Intervals in days FCR BW (g) FI (g/d) WG (g/d) 0-26 -XOS 1.50 ± 0.01 1364 ± 15.39 67.3 ± 2.3 44,8 ± 1.50 + XOS 1.45 ± 0.01 1421 ± 16.97 69.4 ± 2.04 47,8 ± 1.72 P-value P = 0.003 (**) P = 0.30 P = 0.50 P = 0.19 0-39 -XOS 1.66 ± 0.01 2401 ± 60.01 100.0 ± 2.75 60.4 ± 1.53 + XOS 1.63 ± 0.01 2446 ± 57.26 100.4 ± 2.43 61.6 ± 1.46 P-value P = 0.04 (*) P = 0.60 P = 0.93 P = 0.60 11
TABLE 3: The effects of XOS supplementation on the intestinal morphology of chickens on day 26. The data shown are the mean 12
length of the villi (µm) and mean thickness of the tunica muscularis (µm) in ileal sections taken at day 26 of animals fed a
wheat/rye-13
based diet, without or with supplemented with 0.5 % XOS (n=18). The length and the thickness were measured of 10 randomly
14
selected villi and 10 different places for the tunica muscularis using a PC-based analysis system. Statistical analysis was done with
S-15
plus, using a linear mixed effects model with pen as random factor. P-value less than 0.05 were considered significant.
16
– 0.5% XOS + 0.5% XOS
length of villi (µm) 1059 ± 40.00 1228 ± 59.79 P = 0.04
3
TABLE 4: List of Clostridium cluster XIVa and cluster IV members identified in the caeca of chickens at day 26 of which the relative proportion was significantly different between the XOS
17
supplemented and unsupplemented group. The results are based on the sequencing data of 6 chickens per treatment (ns, not significant). 18
Highest 16S rRNA gene sequence similarity - 0.5 %
XOS + 0.5 % XOS P-value Type strain of validly named species (% 16S rRNA gene sequence similarity) Accession number
Clostridium cluster XIVa 29.64 44.29 0.004
Blautia_RL199 0.04 0.15 0.04 Blautia faecis (95.96) DQ793371 Lachnospiraceae_cc142 1.27 5.47 0.04 Blautia schinkii (93.93) DQ057372 Lachnospiraceae_ic1296 0.34 0.79 0.03 Blautia producta (92.33) DQ057459 Lachnospiraceae_GRC80 0.68 0.27 0.02 Eubacterium contortum (94.27) DQ673545 Lachnospiraceae_B5-F3 1.19 7.28 0.01 Blautia producta (93.77) EF025241 Lachnospiraceae_TS29 0.22 0.92 0.04 Eubacterium hallii (95.71) FJ367509
Clostridium cluster IV 29.12 29.31 ns
Ruminococcaceae_BY13 0.69 0.05 0.04 Pseudoflavonifactor capillosus (96.23) DQ342336 Ruminococcaceae_CFT19C1 0.00 0.08 0.04 Clostridium alkalicellulosi (84.4) DQ455843 Ruminococcaceae_CFT212F1
2 0.05 0.16 0.01 Oscillibacter valericigenes (95.73) DQ456381 Ruminococcaceae_RL246 0.19 0.78 0.02 Clostridium alkalicellulosi (85.44) DQ793581 Ruminococcaceae_TS1 1.78 0.29 0.03 Clostridium aldrichii (85.66) FJ365262 Ruminococcaceae_ELU0008 0.04 0.30 0.01 Subdoligranulum variabile (92.69) HQ740050
4 19