HAL Id: dumas-02371976
https://dumas.ccsd.cnrs.fr/dumas-02371976
Submitted on 20 Nov 2019HAL is a multi-disciplinary open access archive for the deposit and dissemination of sci-entific research documents, whether they are pub-lished or not. The documents may come from teaching and research institutions in France or abroad, or from public or private research centers.
L’archive ouverte pluridisciplinaire HAL, est destinée au dépôt et à la diffusion de documents scientifiques de niveau recherche, publiés ou non, émanant des établissements d’enseignement et de recherche français ou étrangers, des laboratoires publics ou privés.
Distributed under a Creative Commons Attribution - NonCommercial - NoDerivatives| 4.0 International License
Typology of the uses and non uses of glyphosate in fields
crops and mixed crops/stock farming in Pays de la Loire
Mathilde Roignant
To cite this version:
Mathilde Roignant. Typology of the uses and non uses of glyphosate in fields crops and mixed crops/stock farming in Pays de la Loire. Life Sciences [q-bio]. 2019. �dumas-02371976�
Typology of the uses and non uses of
glyphosate in fields crops and mixed
crops/stock farming in Pays de la Loire
Par : Mathilde ROIGNANT
Soutenu à Rennes le 13 septembre 2019
Devant le jury composé de : Président : Mme Guenola Pérès Maître de stage : M Emmanuel Mérot Enseignant référent : M Matthieu Caroff
Autres membres du jury (Nom, Qualité) : M Alexandre Joannon, (INRA Centre Bretagne Normandie)
Les analyses et les conclusions de ce travail d'étudiant n'engagent que la responsabilité de son auteur et non celle d’AGROCAMPUS OUEST
Ce document est soumis aux conditions d’utilisation
«Paternité-Pas d'Utilisation Commerciale-Pas de Modification 4.0 France» disponible en ligne http://creativecommons.org/licenses/by-nc-nd/4.0/deed.fr
AGROCAMPUS OUEST CFR Angers CFR Rennes
Année universitaire : 2018-2019 Spécialité :
Agronomie……… Spécialisation (et option éventuelle) : Agroecology………
Mémoire de fin d’études
d’Ingénieur de l’Institut Supérieur des Sciences agronomiques, agroalimentaires, horticoles et du paysage
de Master de l’Institut Supérieur des Sciences agronomiques, agroalimentaires, horticoles et du paysage
I especially thank Emmanuel Mérot , my internship supervisor at Pays de la Loire chamber of agriculture, for his listening, his wise advices throughout the internship and his professional contacts allowing me to analyze the glyphosate uses.
Thanks to Matthieu Caroff, my referring at Agrocampus Ouest for his detailed answers throughout the internship.
Thanks to the members of the Alt'R'Glypho project for the exchanges and the trust granted on this part 1 of the project. Thanks to Aline Vandewalle for supervising the project, Matthieu Arnaudeau for his expertise in ACS, Sébastien Clavé and Delphine Molénat for their knowledges of the subject and on the uses of glyphosate in the Poitevin marsh and to the other advisors of Vendée, Sarthe, Maine et Loire , Mayenne and Loire-Atlantique with whom I interacted during the internship.
Thanks to all the farmers surveyed without whom my understanding of the particular uses of glyphosate according to the farms would be much less. Thank you for their welcome and their exchanges on the subject of glyphosate and the management of weeds in general. I thank Thibault Petit for his great collaboration and his availability when using Mes parcelles data.
Thanks to Hervé Jocaille of DRAAF, Nantes for his analyzes on the quantity of glyphosate used. Thanks to Marc Vanpouille for his expertise on Mes parcelles.
Thanks to Secretaries Pascale Dronet, Sandrine Travert and Hervelyne Poulain, for their services always with dynamism and good mood.
Thank you to all colleagues on the 4th floor of the Chamber of Agriculture of Nantes (Lucie Rocton, Guillaume Calvignac, Yolaine Danard, Guy Barra, Christelle Guilbot, Sylvain Daniel, Pierre-Henry Tardif, Chantal Deniaud, Jean Luc Gayet, Hélène d ' Arondel, Isabelle Michenot, Sophie Locqueville for your welcome and discussions at the coffee break Thank you Gilles Jouchet for the loan of your office.
A special thank you to Elise Michel, agronomist graduated during my internship for her editorial advices and explanations on the functioning of the chamber of agriculture.
Table of contents Glossary
List of figures and tables List of annexes
Table of contents
Introduction: ... 1
I. Context and state of the art of the study ... 2
I.1 Context of the study ... 2
I.1.1 Facts, statements and dates on the glyphosate approval ... 2
I.1.2 Quantity of glyphosate used ... 3
I.1.3 Glyphosate uses ... 4
I.1.4 Residues of glyphosate and AMPA found in water ... 5
I.2 State of the art on the glyphosate molecule ... 6
I.2.1 Glyphosate mode of action ... 6
I.2.2 Effects and behaviour of glyphosate in soil ... 6
I.2.3 Effects of tillage system on glyphosate sorption and degradation ... 7
I.3 Objectives and progress of the internship ... 8
II. Analysis of the uses of glyphosate thanks to data extracted from “Mes parcelles” on the farming practices of Pays de la Loire farmers ... 9
II.1 Material and Method ... 9
II.2 Results ...10
II.2.1 Percentage of uses and Period of application ...10
II.2.2 Uses per culture ...11
II.3 Discussions ...12
III. Analyses of the uses of glyphosate via a survey in the form of interview with Pays de la Loire farmers ...13
III.1 Material and Method of the farmer survey Alt’R’Glypho ...13
III.1.1 Content of the farmer survey ...13
III.1.2 Farm s surveyed ...14
III.1.3 Methodology ...15
III.2 Results ...15
III.2.1 Quantitative analysis of Farmer surveys Alt’R’Glypho ...15
Special case of the Poitevin marsh : Clay texture and uses of glyphosate ...19
III.2.2 Qualitative analysis of farmer surveys Alt’R’Glypho ...20
Case study : decision-making framework of the crop system/ technical itineraries for low use
of glyphosate according to types of tillage. ...23
IV. Update on Innovative Alternatives to the Use of Glyphosate ...24
V.1. Chemical alternatives ...24
V.2 The electric weeding ...25
Conclusion ...26 Bibliography : ...
Glossary:
The words and expressions defined below are followed by an asterisk for the first term appearing in the text
Annual plant: Plant that fructifies, disperses its seeds and dies less than a year after germination (Larousse 2018).
ANSES: National French Agency for Food Safety, Environment and Labor.
Antimetabolite: Chemicals analogs of the natural susbtrates of enzymes, where they bind to the active site but are not converted to the functional product. Antimetabolites block a biological process, such as biosynthetic pathway (Brilisauer et al. 2019).
BNV-d: National Bank sales distributors list sales and purchases of phytosanitary products in France. The declarative data produced by authorized distributors selling products are stored in it.
Crops system: set of technical modalities implemented on parcels treated in an identical way. Each cropping system is defined by the nature of the crops, their order of succession (rotation) and the technical itineraries applied to these different cultures (Pr Sébillotte)
DEPHY network: Demonstration network, Experimentation and production of references on the economic systems in phytosanitary, it is a major action of the Ecophyto plan.
DRAAF: Regional Direction of Agriculture of Food and Forest.
Enzymatic promiscuity: The ability of an enzyme to catalytically catalyse a chemical reaction distinct from that primarily catalysed by this enzyme.
Field crop: An agricultural crop grown on large areas (Dictionary Merriam-Webster).
Labor unit: for INSEE, the UTA (Annual Work Unit=labor unit in the study) is the unit of measurement for the amount of human labor provided on each farm. This unit is equivalent to the work of a person working full time for one year.
Mes parcelles: Recording tool of agricultural practices developed by the Chambers of Agriculture. It allows farmers to control their crops through the capture and retrieval of geographic and alphanumeric information about their farms.
Octagri: Customer Relations Management tool (CRM) of the chambers of agriculture.
Perennials: A plant with a growing period of several years, even when the underground parts (so-called perennial organs: rhizomes, bulbs, tubers, etc.) remain alone in winter (Larousse 2018).
Real Time Kinematic (RTK) is a satellite positioning technique based on the use of phase measurements of the carrier waves of signals emitted by GPS, GLONASS or Galileo systems.
TFI: Treatment Frequency Index= ∑ (Field Application Rate÷Registered Reference dose for the Crop Considered ×Proportion of Parcel Processed). It allows to access the degree of dependence of agricultural practices on the use of pesticides (Guichard, Mignolet, et Schott 2017).
Weed: It is said of a plant that grows spontaneously in a culture and whose presence is more or less harmful to it. (The harmfulness of weeds is explained by competitive effects with the cultivated plant, vis-à-vis water, light and minerals contained in the soil) (Larousse 2018). .
List of figures:
Figure 1: Facts, statements and dates about the glyphosate approval Figure 2: Quantity of glyphosate use worldwide from 1994 to 2014
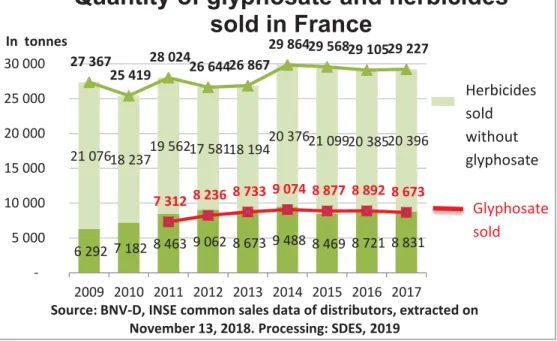
Figure 3: Quantity of glyphosate and herbicides sold in France from 2009 to 2017 Figure 4: Quantity of glyphosate bought in Pays de la Loire from 2008 to 2017
Figure 5: Quantity of glyphosate bought per Pays de la Loire department from 2008 to 2017
Figure 6: Adjust the dose of glyphosate to the weed targeted, translated from Arvalis, 2017
Figure 7: Glyphosate dose reduction by combination with adjuvant + 2.4D, translated from Arvalis, 2017
Figure 8 : Quantification rate of 20 molecules in Pays de la Loire water
Figure 9: Map of measurement stations by quality class in 2017 for the Pays de la Loire region
Figure 10: Localisation of the glyphosate action in the shikimate pathway, adapted from Dosselaere et Vanderleyden 2001
Figure 11: Pathways of glyphosate degradation in Soils (from Roberts, 1998) Figure 12: Alt’R’Glypho internship process
Figure 13: Number of interventions with glyphosate per month in Pays de la Loire by farmers in Mes parcelles for 2016, 2017 and 2018
Figure 14: Area treated with glyphosate in Pays de la Loire by farmers in Mes parcelles for 2016, 2017 and 2018
Figure 15: Area treated with herbicide in Pays de la Loire for 2016 ,2017 and 2018 Figure 16: Percentage of area treated with glyphosate per culture
Figure 17: Average quantity of glyphosate applied per culture
Figure 18 : Influence of previous crop on glyphosate dose treatment for next crop Figure 19: TFI herbicide without glyphosate as a function of TFI glyphosate for corn for the years 2016,2017 and 2018
Figure 20: TFI herbicide without glyphosate as a function of TFI glyphosate for soft wheat for the years 2016,2017 and 2018
Figure 21: Decision-making scheme of weed management levers Figure 22: Map of the farmers surveyed
Figure 23: Average amount of glyphosate per type of use
Figure 24: Share of each crop in percentage of the total crop area
Figure 25: Share of each area of crop treated in % of the total area of these crops treated with glyphosate
Figure 26: Percentage of UAA treated with glyphosate per type of soil tillage Figure 27: Average UAA per type of soil tillage
Figure 28: Percentage of UAA minus grassland areas treated with glyphosate per type of soil tillage
Figure 29: Average quantity of glyphosate applied per type of soil tillage
Figure 30: TFI herbicide without glyphosate as function of TFI glyphosate per farm Figure 31: Percentage of meadows on the UAA per type of soil tillage
Figure 32: Number of cultures including intercrops in the main rotation per type of soil tillage
Figure 33: Number of cultures in the annual cropping without meadows per type of soil tillage
Figure 34: Average UAA per labour unit per type of soil tillage
Figure 35: The dominant texture of the top horizon of agricultural soils by township Source Gis Sol, BDAT, 2011
Figure 36: Soil analysis of 3 clay plots cultivated from the Poitevin marsh
Figure 37: Obstacles to the stop of glyphosate cited by farmers
Figure 38: Example of a low-use glyphosate technical itinerary for tillage: Direct seeding
Figure 39: Example of a low-use glyphosate technical itinerary for tillage: Reduced tillage
Figure 40: Localisation of the 7 deoxy sedoheptulose action in the shikimate pathway, adapted from Dosselaere et Vanderleyden 2001
Figure 41: Effects of 7 dSh on A Thaliana seedlings compare to glyphosate Source: Brilisauer et al, 2017 licence CC
Figure 42: 7-deoxy-sedoheptulose =7 dSh developed formula
Figure 43: Structures of Abscisic Acid and Lunularic Acid and their distribution in the plant kingdom Source Yoshikawa et al, 2002
Figure 44: Chemical synthesis of radulanin A, obtained by researchers from the laboratory of organic synthesis of the Polytechnic School of France Source: Bastien Nay Research Group
Figure 45: X power Zasso electric weeding, Mouchamps Vendée, 03/05/2019, ©Pierre
List of tables:
Table 1: Glyphosate quantification and exceeding frequency
Table 2: AMPA; Aminomethylphosphonic acid; quantification and exceeding frequency
Table 3: Glyphosate chemical name and formula
Table 4: Area in winter and spring crops registered in Mes parcelles and in Pays de la Loire
Table 5: Type of uses taken into account in the survey
Table 6: Example of table completed with farmers glyphosate uses Table 6: Number of farmers surveyed per department
Table 7: ETO of the farms surveyed
Table 7: Categories of soil tillage and their definition Table 8: Farms per type of tillage system
Table 9 : % area treated with glyphosate per type of soil tillage according to Alt’R’Glypho survey and 2011 SPP source
List of annexes:
Annexe I: Data on crops
Introduction:
Glyphosate is the most widely used herbicide in the world (ww.epa.fr). It is a synthetic molecule, discovered in the 1950s by the Swiss chemist Henri Martin. Its property as a metal chelator (patent 1964) was used to make it an herbicide from 1974; Monsanto created the Roundup. Its authorization for herbicide uses on the European and French market is currently being questioned due to potential effects on human health. The glyphosate is currently ranked as a probable carcinogen by the World Health Organization since 2015. This ranking is not unanimous among other institutions. A new study on the risk for the health is being led by ANSES*. The development of plant resistant to the glyphosate questioned also the uses of the glyphosate on long term. The sale of glyphosate to individuals has been banned in France in January 2019. In Europe, the marketing authorization of glyphosate as an herbicide was last renewed in 2017 for 5 years instead of 10 as generally. The current authorization of glyphosate expires thus on December 15, 2022. Following the renewal of its authorization in 2017 until 2022, the French government, which voted against its renewal, announced that France would no longer use glyphosate within three years. Although this announcement of withdrawal in 3 years will not be effective, the possible exit of the use of the glyphosate in France and in Europe in the coming years raises the question of the feasibility to make without glyphosate, this systemic and total herbicide used in diverse agricultural sectors.
In this context of possible stop of glyphosate use in France, Pays de la Loire Chamber of Agriculture has launched a regional project on the feasibility of alternative techniques to the use of glyphosate in the different contexts of Pays de la Loire, region of north-western France, with various agricultural productions. Pays de la Loire chamber of Agriculture accompanies the farmers in their own and common development in the face of current challenges and represents all agricultural and economic agents of agriculture.
The project called Alt’R’Glypho contains two parts. The first part is that of my internship, it looks at the current uses and non uses of glyphosate in fields crops* and mixed crops/stock farming, in the objective of making a typology of the glyphosate uses and identifying the degree of glyphosate uses across systems and contexts.
What are the uses of glyphosate for fields crops and mixed crops/stock farming in Pays de la
Loire?
What are the types and degrees of use of glyphosate?
What are the factors for reducing glyphosate?
The second part of the project contains experimentation and evaluation of innovative techniques, alternative to the use of glyphosate (a bio control molecule, the method of electric weeding, mechanical weeding tools).
The first part of the report presents the background and state of the art on the glyphosate molecule. The second and third part presents methodology, analyses and discussions of identified uses and non-uses of glyphosate from two data sources; data from Mes Parcelles* and data from surveys carried out by me with farmers in Pays de la Loire region. Part four presents the typology and cases of low users of glyphosate. Part five presents innovative alternatives to the glyphosate molecule.
I. Context and state of the art of the study I.1 Context of the study
I.1.1 Facts, statements and dates on the glyphosate approval
The possible ban on glyphosate has been at the heart of scientific and political debates and in the news since 2015. Below and opposite (figure 1) are the main dates and statements that call into question the glyphosate approval in France.
March 20, 2015: The International Agency for Research on Cancer (IARC) first classifies glyphosate as a probable carcinogen for humans.
November 12, 2015: The European Food Safety Authority (EFSA) issued a favourable opinion for the maintenance on the market.
February 16, 2016: ANSES concludes that "given the limited level of evidence, a classification in Category 1A or 1B (known or suspected human carcinogen, CLP Regulation) cannot be proposed".
January 1, 2017: The glyphosate is banned for local communities for its use in areas open to the public in France.
March 15, 2017: The European Chemicals Agency (ECHA) announces that it does not classify glyphosate as a carcinogen.
September 2017: Several scientists show support for the IARC rankings by discovering many of the agrochemical industry's glued copies in EFSA's Preliminary Expert Report
October 24, 2017: MEPs (European deputies) adopt non-binding resolution calling for gradual ban on glyphosate within 5 years
October 25, 2017: Vote postponed for 10-year renewal of glyphosate.
November 27, 2017: The renewal of the molecule is finally validated for the next 5 years. In the wake E. Macron asks the government "to make the necessary arrangements so that the use of glyphosate is prohibited in France as soon as alternatives have been found and at the latest in three years". But this provision is not included in the EGALIM law.
May 11, 2018: ANSES announces the launch of a new study on glyphosate. This one, "independent" will aim to "settle" the controversy on the dangerousness of the herbicide June 22, 2018 : The Agricultural minister presided by Stéphane Travert and the Ecological Transition minister presided by Nicolas Hulot launched a « task force led by the two ministries, with the support of INRA (National Institute of Agricultural Research), Acta (technical institutes) and Apca (chambers of agriculture) with a quarterly report »
January 1, 2019: The glyphosate is banned for private users in France.
May 29, 2019: Amendments for the prohibition, within three years, of glyphosate was rejected by the national assembly deputies.
December 2019: Beginning of the Renewal process for the European authorization (3 years before the expiry data.
6 292 7 182 8 463 9 062 8 673 9 488 8 469 8 721 8 831 21 076 18 237 19 562 17 581 18 194 20 376 21 099 20 385 20 396 27 367 25 419 28 024 26 644 26 867 29 864 29 568 29 105 29 227 7 312 8 236 8 733 9 074 8 877 8 892 8 673 - 5 000 10 000 15 000 20 000 25 000 30 000 2009 2010 2011 2012 2013 2014 2015 2016 2017 In tonnes
Source: BNV-D, INSE common sales data of distributors, extracted on November 13, 2018. Processing: SDES, 2019
Quantity of glyphosate and herbicides
sold in France
Herbicides vendus hors glyphosate Glyphosate sold 56296 67078 193485 402350 652489 718600 825804 0 100000 200000 300000 400000 500000 600000 700000 800000 900000 1994 1995 2000 2005 2010 2012 2014 In to n n e sSource : Statista Research Department, Feb 2, 2016
Glyphosate use worldwide
from 1994 to 2014
448,7 315,5 329,4 414,6 426,7 545,3 472,5 495,6 554,3 0 100 200 300 400 500 600 700 2008 2009 2010 2011 2012 2014 2015 2016 2017 In to n n e sSource : BNV-d Data treatment DRAAF/Ecophyto/HJ may 2019
Quantity of glyphosate bought
in Pays de la Loire
EAJ (garden) Professional 0 50 100 150 200 44 49 53 72 85 In to n n e sSource : BNV-d Dta treatment DRAAF/Ecophyto/HJ may 2019
Quantity of glyphosate bought
per
Pays de la Loire
department
2008 2009 2010 2011 2012 2014 2015 2016 2017 Herbicides sold without glyphosate
Figure 2: Quantity of glyphosate use worldwide from 1994 to 2014 Figure 3: Quantity of glyphosate and herbicides sold in France from 2009 to 2017
Figure 4: Quantity of glyphosate bought in Pays de la Loire from 2008 to 2017 Figure 5: Quantity of glyphosate bought per Pays de la Loire department from 2008
I.1.2 Quantity of glyphosate used
I.1.2.1 In the world
Since its approval on the market in 1974, the amount of glyphosate used has steadily increased worldwide to reach in 2014, 825000 of tons (figure 2). The creation of GMOs in the 2000s has greatly and continues to contribute greatly to the increase in glyphosate consumed, due to the number of GMOs created and to the weed resistances that are increasing and require higher amounts of glyphosate to be treated. In 2016, genetically engineered herbicide-tolerant crops account for about 56% of global glyphosate use (Benbrook 2016).
I.1.2.2 In France
Over the last three years recorded by BNV-d* 2015-2016-2017, the sale of glyphosate reaches an average of 8,673.5 tonnes, that is 30% of herbicide sales in France. The quantity of glyphosate used in France represents 1% of the total amount of glyphosate used worldwide. The quantity of herbicides sold has increased by 4% between the 2009-2010-2011 average and the 2015-2016-2017 average. Glyphosate's share of herbicide sales remained at 30% between these two periods (figure 3).
I.1.2.3 In Pays de la Loire
The last numbers include sales for professionals and those for EAJ (authorized use in gardens). The professionals are the distributors or buyers who hold an individual certificate for phytopharmaceutical products (certiphyto).Sales and purchasing figures by region and by departments may vary slightly depending on the registration code of distributors and buyers in the BNV-d (glyphosate may be sold by a distributor whose common code is in a different region than the glyphosate is bought). Since 2008, the DRAAF* Pays de la Loire has listed herbicide purchases via the regional purchasing observatory (supplied by the distributors for pro and private water agency purchases). The figures for glyphosate purchases by department come from the analysis by M Hervé Jocaille (DRAAF Pays de la Loire) of the purchases recorded by municipality in this observatory coupled with BNV-d data. The 2013 year is not presented because the data are less sure.
The purchase of glyphosate in Pays de la Loire region reaches 507.5 (professional) + 52.9 (EAJ) = 560.4 tons on average over the period 2015-2016-2017(figure 4). The region consumes 6.4% of glyphosate sold nationally. The quantity of glyphosate purchased by professionals increased a liitle bit between 2009-2010-2011 and 2015-2016-2017 from 353.2 to 507.5 tonnes, the amount of glyphosate for garden use (EAJ) is decreasing from 97 to 53 tonnes (from 21.6% to 9.5% of glyphosate sales between 2009-2010-2011 and 2015-2016-2017).
The department Maine et Loire (49) is the one that consumes the most glyphosate and Mayenne (53) is the one that consumes the less in Pays de Loire. Glyphosate consumption in the 5 departments increased a liitle bit between 2009 and 2017 (Figure 5).
Figure 7: Glyphosate dose reduction by combination with adjuvant + 2.4D, translated from Arvalis, 2017
Weeds targeted
L/ha of glyphosate (360g/l) needed Only glyphosate + adjuvant +adjuvant +2.4 D Annuals cereals regrowth (early run) 1-2 - - rapeseed regrowth (3-4 leaves) 1 - rapeseed (early elongation) 2.5 2 1.67 annual grasses 1-2 - - annual broadleaf weeds 1.5 - - geranium - 2 2.33 goosefoot (15cm) 2.5 1.5 1.67 mustard, phacelia, radish (developed) 3 2 1.67 Perennials thistle (flower buds) 3 2 2.33 milkweed 3 2.5 2.33 bindweed (flowering) 6 4 2.33 quackgrass (flowering) 3 - - rumex 3 2 1.67
I.1.3 Glyphosate uses
I.1.3.1 Allowed uses in France compared to other countries
In France, glyphosate is only allowed in intercrops. It is used mainly to manage annual and perennial weeds between two harvested crops. Use on crops is allowed in some countries in Europe, in many American countries and elsewhere. One type of use on crops is that of desiccating crops and is done just before harvest. Glyphosate accelerates the maturation process and the drying of cereal grains and other crops on which this use is practiced (rapeseed, peas, cotton ...) but this use results in a certain amount of glyphosate residues in these crops harvested (Gilam, 2015). In Europe, the United Kingdom allows this use which permits in this northern European wet country, to ensure an harvest and better conservation of their crops. The second type of use on crops is for GM (genetically modified) crops tolerant to glyphosate. As early as 1994, GM crops called roundup ready (RR) soybean, corn, cotton were approved for planting in the US. The interest is to ensure a crop without weeds with the possibility of applying glyphosate on crops without affecting them thanks to their glyphosate tolerance gene. Since 1994, other countries have allowed GMO HT crops and other glyphosate tolerant crops have been introduced. The introduction of these GMO HT crops has been accompanied contrary to the expectations by an increase in the use of glyphosate and an increase in weeds resistant to glyphosate. The average rate per crop year (indicator of the intensity of glyphosate use) rose from 0.47 kg/hectare in 1993 to 2.08 kg/hectare in 2012 (4.4-fold) (Benbrook 2016). For a product with a glyphosate dosage of 360 g /l, it means the quantity per hectare was increased from 1.30 to 5.78 l / ha treated. The maximum authorized total use rate in France is 2880g / ha / year (8 l / ha / year for a dosage of 360g / l) (Arvalis, 2017).
I.1.3.2 Differences of use between farms in France
In France, the use of glyphosate concerned 14% of surfaces in 2011 and 15% in 2014 (Reboud X. et al, 2017).
The use of glyphosate between farms can differ in terms of area treated and in terms of intensity of use via the dose applied per treatment.
Treatment rates depend on the weeds targeted, the conditions of application and the use of adjuvants. Depending on the target, annual or perennial weeds, the doses needed to manage them are differents. Annuals* require lower doses. Perennials* require higher rates of 3l / ha for quack grass, thistles, rumex and up to 6l / ha for field bindweeds (figure 6). The stage of development as well as the area they take in the plot are two points of monitored vigilantly for the treatment of weeds. The use of adjuvants reduces the doses of glyphosate needed for the same effectiveness (figure 7)(Arvalis, 2017). Oils are an adjuvant that improves glyphosate penetration through the leaves. Wetting agents are useful adjuvants for contact products for plants that cannot be wetted (product drops do not spread). The use of wetting and oil at the same time has no additional benefits for dose reduction (Arvalis, 2019). For glyphosate, another type of adjuvant can be used, the ammonium sulphate-based salt that reduces the hardness of water. The addition of adjuvants based on ammonium sulphate, the usual dose of which is 1 l / ha makes it possible to reduce the dose thanks to the hygroscopic
Figure 8 : Quantification rate of 20 molecules in Pays de la Loire water
Table 1: Glyphosate quantification and exceeding frequency
Table 2: AMPA; Aminomethylphosphonic acid; quantification and exceeding frequency
Glyphosate 2011-2014 average 2014-2017 average
Quantification frequency 32.5 % 42.5 %
Exceeding frequency at 0.1 μg /l 20 % 20 %
AMPA 2011-2014 average 2014-2017 average
Quantification frequency 75 % 77 %
Exceeding frequency at 0.1 μg /l 62.5 % 70 %
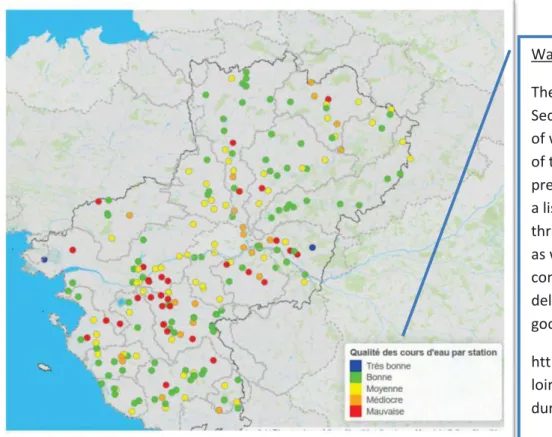
Figure 9 : Map of measurement stations by quality class in 2017 for Pays de la Loire region
Water quality definition :
The classification of water quality by the SeqEAU method aims to qualify the ability of water to allow the proper functioning of the different biological compartments present in the watercourse. It is based on a list of molecules and 4 concentration threshold values specific to each molecule as well as for the cumulation of the concentrations taken. These 4 thresholds delimit 5 classes of quality, from very good to bad.
http://apps.datalab.pays-de-la-
effect of ammonium sulphate. The ammonium sulphate salt captures the moisture in the air, keeps the spray drops longer in the liquid phase and thus prevents desiccation of the treatment product containing glyphosate(Arvalis, February 2019).
In addition to adjuvants, reducing the volume of boiling reduces the amount of glyphosate used and even increases the effectiveness of glyphosate. Indeed, water contains Ca2 + ions that bind to glyphosate and thus reduce the amount of active glyphosate. In addition, glyphosate is very soluble in water, the water passes through the leaf cuticle which is hydrophobic in nature. The reduction of the volume of slurry thus makes it possible to reduce the relative share of Ca 2+ ions and concentrates the drops of glyphosate, these two actions make it possible to increase the quantity of active glyphosate which enters the plant (Arvalis, April 2013). Doses can also vary according to abiotic parameters and depend on the farmers. The areas treated between farms vary in particular according to the type of tillage adopted by the farmer. The analysis of the uses of glyphosate from the crops system* data of farmers belonging to the Dephy network* highlighted this difference in the area treated between type of soil tillage system. More than 60% of no-till areas were glyphosate treated in 2010-2011, compared to 40% for reduce tillage and less than 10% for systematic ploughing in 2010-2011 and 2013-2014 (Reboud X. et al, 2017).
I.1.4 Residues of glyphosate and AMPA found in water
The water agency Bretagne-Loire conducts water sampling in the Loire region in order to estimate the quality of the water. The water quality assessment is based on the quantification rate and the frequency of exceeding a list of molecules. The quantification rate is the result of the division of the number of occurrences where the molecule is detected by the number of occurrences where the molecule is sought. The frequency of exceeding is the occurrence for which the molecule is detected at a concentration higher than 0.1 ug / l (standard set by the individual EU as well as those of total pesticides)
AMPA; Aminomethylphosphonic acid; glyphosate degradation molecule (I.2.3.3); is the third molecule whose frequency of quantification is highest in the rivers of the region. Glyphosate is the 7th molecule with the highest frequency of quantization (figure 8). For rivers in Pays de la Loire region, the frequency of quantification of AMPA and that of glyphosate increased between 2011-2014 and 2014-2017, by 3% for AMPA and by 10% for glyphosate. The frequency of exceeding at 0.1 ug / L remained at 20% for glyphosate, that of AMPA increased from 62.5 to 70%(table 1 and 2) (Agence de l’eau Bretagne-Loire) .
After having seen the elements of context in which the possible ban of glyphosate fits in France, we will see the properties and behaviours of the glyphosate molecule in order to reason the elements of previous contexts.
Table 3: Glyphosate chemical name and formula
Usual Name of the active ingredient
Glyphosate
IUPAC name N-(phosphonomethyl)glycine
Formula developed
Formula C3H8NO5P
Glyphosate
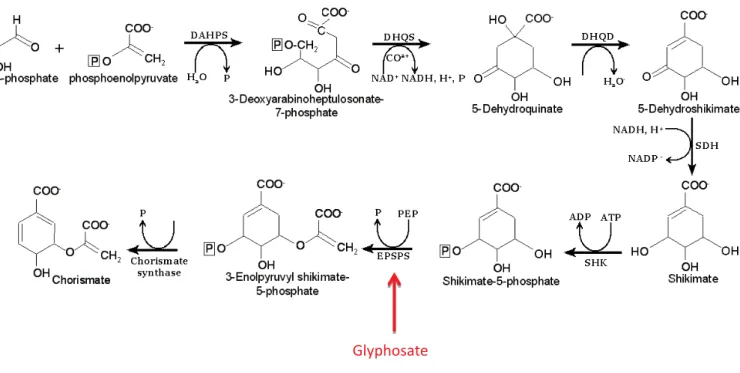
Figure 10 : Localisation of the glyphosate action in the shikimate pathway, adapted from Dosselaere et Vanderleyden 2001
I.2 State of the art on the glyphosate molecule I.2.1 Glyphosate mode of action
The glyphosate is a systemic herbicide, it is absorbed by the leaves and then circulates throughout the plant to the underground parts (Sprankle et al, 1975). It is also a broad-spectrum herbicide; it affects almost all plant species. With dicamba and the 2.4D hormone, it is one of the third "total" herbicides allowed on the market in France (Arvalis).
Glyphosate acts on the biosynthetic pathway of shikimate. This biosynthetic pathway catalyses the conversion of erythrose 4-phosphate and phosphoenolpyruvate (PEP) via shikimate to chorismate (Dosselaere et Vanderleyden 2001). Chorismate is an essential precursor to the formation of the aromatic amino acids’ phenylalanine, tyrosine and tryptophan. Each enzyme in this biosynthetic pathway is essential for the final formation of chorismate. This pathway is present in bacteria, fungi, algae, protists and plants, but is absent in animals.
Glyphosate acts at the last one stage (figure 10). It binds to the enzyme enolpyruvylshikimate-3-phosphatesynthase (EPSPS), thus blocking its activity and the formation of chrorismate. The non-formation of the chorismate leads to the stop of development and eventually to the death of the plants (Mamy, 2004).
Its low cost compared to other herbicides, its total action and its systemic properties are prbably the main reasons for its widespread use worldwide.
I.2.2 Effects and behaviour of glyphosate in soil
I.2.3.1 Glyphosate effects on soil microbial
In the long term, there is little effect of glyphosate on the parameter’s microbial biomass and on the microbial mineralization. Glyphosate has little effect on microbial biological activity (Mamy, 2004).
I.2.3.2 Adsorption of glyphosate in the soil
Glyphosate is one of the herbicides adsorbed quickest in soils. It is therefore not very mobile, and its bioavailability decreases fastly. Adsorption is nevertheless less important in sandy or calcareous soils (Sprankle et al, 1975).
Glyphosate binds to the constituents of the soil by its phosphonic group. Once adsorbed, glyphosate loses its antimicrobial properties (Sprankle et al, 1975). The adsorption of glyphosate in soils is thus strongly dependent on the phosphate concentration in the soil. There is competition between glyphosate and phosphate for adsorptive sites. The more phosphate there is, the less adsorption is strong.
As an amphoteric molecule, the adsorption of glyphosate in soils depends on the pH. Its absorption increases when the pH increases (Al rajab, 2007).
The amphoteric structure of glyphosate gives it complexing properties with metal ions of the soil, the most stable complexes with trivalent trivalent ions: Fe3 +, Al3 + and divalent Cu2 +. The presence of these ions increases the adsorption (Mamy, 2004).
The intensity of the adsorption depends also on the composition of the solution. The presence of CACl2 enhances the adsorption. The presence of Mn2 + manganese stimulates the mineralization of glyphosate as a likely cofactor (Moshier and Penner, 1978).
There is no consensus on the effect of organic matter on glyphosate adsorption. For some authors, soil content in organic matter has an influence on the glyphosate adsorption through hydrogen bond (Sprankle et al, 1975), and for others, the rate of organic matter in soils has no statistically significant influence on glyphosate adsorption (Gerritse et al, 1996 ; De Jonge et al, 2001).
I.2.3.3 Glyphosate degradation in the soil
The degradation of glyphosate in the soil when it is non-adsorbed is of mainly biological origin by mineralization. Chemical or photosynthetic degradation contributes very little to the degradation of glyphosate. The degradation of glyphosate produces two metabolites, glyoxylic acid and the main one in quantity aminomethylphosphonic acid (AMPA) (figure 11). Glyphosate degradation is highly dependent on adsorption intensity (Sprankle et al ,1975). Depending on the rate and intensity of adsorption, his residence time can increase and the risk of accumulation too (Okada et al, 2017).
Depending on the soil, glyphosate may be more or less persistent. The half-life of glyphosate is highly variable between studies (Mamy, 2004).
The degradation of AMPA is also essentially biological. It is however slower and occurs indifferently under aerobic and anaerobic conditions. AMPA can persist in soils one year after application of glyphosate (Mamy, 2004).
I.2.3 Effects of tillage system on glyphosate sorption and degradation
Glyphosate sorption, persistence and so on degradation are similar between the surface of no tillage and conventional tillage soils (Zablotowicz et al. 2009). Pesticides transfer is more influenced by primary soils conditions and climatic conditions than by the type of tillage system. The explanation is that on one side, reducing tillage increase the biological activity able to degrade the glyphosate and another side, reducing tillage improve macropore connectivity which can increase the pesticide leaching, glyphosate notably.
Furthermore, as the adsorption of glyphosate is fast, the molecule is no more accessible by microbes. A study in Argentina (Alletto et al, 2010) has compared the dissipation of glyphosate and the accumulation of its main metabolite the AMPA over three soils, under long-term management of no-tillage and conventional tillage practices. They observed a first fast dissipation rate, which is due to the adsorption (no increase in the AMPA concentration). At the end, there were no difference between tillage practices and dissipation was not related to the microbial activity measured as soil respiration, which was higher for soil under no-till management (Alletto et al. 2010; Okada et al, 2017).
I.3 Objectives and progress of the internship
The objective of my internship; the part 1 of the Alt’R’Glypho project; is to carry out a typology of the uses and non-uses of glyphosate in fields crops and mixed crops/stock farming in Pays de la Loire for:
-Targeting more precisely the conditions of use of glyphosate in Pays de la Loire and the degree of glyphosate dependence of the systems.
-Identifying success factors in situations where some farmers dispense with glyphosate and allow their transfer.
For that, I conducted surveys in the form of interviews with 48 farmers in the region of Pays de la Loire, from mid-March to the end of June and I analysed data extracted from the tool Mes parcelles* on the glyphosate uses over the years 2016-2017-2018.
II. Analysis of the uses of glyphosate thanks to data extracted from “Mes parcelles” on the farming practices of Pays de la Loire farmers
II.1 Material and Method
II.1.1 Material
Mes parcelles * is a tool for recording farmers' farming practices. It makes it possible to forecast and record phytosanitary practices by plots. Mes parcelles was used by 3800 farmers in Pays de la Loire region in 2018. The number of current farmers in the Loire region is 34 344, of which 25308 medium and large (PBS = standard gross product> 25000 €). Mes parcelles accounts for about 28.6 % of the area under « field crops » in the Pays de la Loire (Annexe I).
I used several data from Mes parcelles for the last three years 2016, 2017 and 2018.
The extractions were made by M Thibault Petit for different indicators with an entry by culture or by non-nominative identifiers. In order to take into account only fields crops and mixed crop farmers, the APE (Main Business Activity) codes recorded on Octagri * were crossed with the corresponding identifier under Mes parcelles. The APE codes below have been kept to represent the field crops and mixed crop farms:
0111Z - Culture de céréales (à l'exception du riz), de légumineuses et de graines oléagineuses
0141Z - Élevage de vaches laitières
0142Z - Élevage d'autres bovins et de buffles 0145Z - Élevage d'ovins et de caprins
0146Z - Élevage de porcins 0147Z - Élevage de volailles 0149Z - Élevage d'autres animaux 0150Z - Culture et élevage associés 0161Z - Activités de soutien aux cultures The indicators requested are:
· Per culture and per pair of culture previous / next, per plot for the years 2016,2017 and 2018
-treated surface by glyphosate - area of the plot - quantity of active ingredient applied (via the extraction of indicators quantity of glyphosate applied per treatment, treatment unit, dose of the treatment product)
-TFI* glyphosate and TFI herbicides.
· Per identifier for the year 2016,2017 and 2018 for corn and soft wheat -TFI glyphosate and TFI herbicides combined
Figure 13 : Number of interventions with glyphosate per month in Pays de la Loire by farmers in mes parcelles for 2016, 2017 and 2018
Figure 14 : Area treated with glyphosate in Pays de la Loire by farmers in mes parcelles for 2016, 2017 and 2018 0 500 1000 1500 2000 2500
Jan Feb March April May June July Aug Sept Oct Nov Dec
Mes parcelles : Number of interventions
with glyphosate per month in Pays de la
Loire
2016 2017 2018 0 20000 40000 60000 80000 100000 120000 140000 160000 h aMes parcelles: Area treated with herbicide
in Pays de la Loire
2016 2017 2018
Figure 15 : Area treated with herbicide in Pays de la Loire for 2016 ,2017 and 2018
0 1000 2000 3000 4000 5000 6000 7000 8000 9000 10000 h a
Mes parcelles: Area treated with glyphosate
in Pays de la Loire
2016 2017 2018
· Per month for the years 2016, 2017 and 2018
The number of glyphosate applications per month for several years.
II.1.2 Method
The data have been cleaned (detection and removal of errors present on the data stored in the files extracted from Mes parcelles and were analysed under microsoft excel.
The winter crop * taken into account are - soft wheat winter, winter barley, winter rape, winter
triticale, durum wheat winter, winter oats, winter rye.
The spring crop * taken into account are -corn silage, grain corn, sunflower, spring barley, spring oats, durum wheat spring, soft wheat spring, spring rape, rye spring, spring triticale. The study of the effect of the previous plant on the application of glyphosate before the next crop is made from data whose registration number over the 3 years 2016-2017-2018 is strictly greater than 15 and whose standard deviation is lower strict at 1.1 l / ha.
All the results expressed in liter / ha in the rest of the report and on the graphs are obtained from the grammage per hectare and converted into liters for a concentration of 360g / L. The averages expressed are always the triennial averages over the years 2016,2017 and 2018. Standard deviations are in brackets.
II.2 Results
II.2.1 Percentage of uses and Period of application
18.67% of the farmers registered in fields crops or mixed crops-breeding sectors (APE codes) use glyphosate per year in Pays de la Loire (average on 2016-2017-2018). The major part of glyphosate applications in Pays de la Loire takes place before spring and winter sowing (figure 13). The area treated with glyphosate for farmers in Pays de la Loire is similar between spring and winter (figure 15). The area dedicated to winter crops is 15.4 % higher than for spring crops according to mes parcelles. The difference rate at the region wide according to Agreste resources is of 18% (table 3). For comparison, the area treated with herbicide is largely higher in spring than in winter (figure 15).
Table 4: Area in winter and spring crops registered in mes parcelles and in Pays de la Loire
Pays de la Loire
Average area on 2016-2017-2018 :
Mes Parcelles Region Wide (Source
Agreste)
Winter crops in ha 173277 621100
Spring crops in ha 127165 432100
Total 300442 1053200
Difference between winter and spring crops area
46112=15.4 % 194000=18%
List 1 = List of crops analysed in the 2 figures below: corn, sorghum, soft wheat, durum wheat, triticale, barley, rye, sunflower, rapeseed, soybean, linen, faba bean, feed pea, lupine, beetroot and hemp
Figure 16 : Percentage of area treated with glyphosate per culture
Figure 17 : Average quantity of glyphosate applied per culture
3,33 2,75 2,63 2,63 2,38 2,35 2,27 2,22 2,19 2,18 2,08 2,07 1,95 1,84 1,82 1,78 0,00 1,00 2,00 3,00 4,00 5,00 6,00 li te rs/h a tr e ate d
Source : Mes parcelles Chamber of Agriculture Pays de la Loire 2016-2017-2018
Average quantity of glyphosate applied per culture
Weighted Average by the treated area of each crop : 2.12 l/ha
25,02% 18,90% 18,10% 17,99% 17,10% 14,74% 13,99% 12,26% 11,66% 11,45% 10,84% 10,73% 9,60% 6,67% 6,03% 4,19% 0,00% 5,00% 10,00% 15,00% 20,00% 25,00% 30,00%
Source : Mes parcelles Chamber of Agriculture Pays de la Loire 2016-2017-2018
% of surface treated per culture
Weighted Average by the treated area of each crop : 10.61%
II.2.2 Uses per culture
On all the areas of crops in List 1 (corn, sorghum, soft wheat, durum wheat, triticale, barley, rye, sunflower, rapeseed, soybean, linen, faba bean, feed pea, lupine, beet and hemp), The area-weighted average of glyphosate-treated surfaces is 10.64% for a weighted average dosage of. 2.12 l / ha treated (+/- 1.25) (figure 16 and 17).
In terms of area, an average of 32775.83 ha of the 308462.52 hectares of crops in List 1 taken into account by mes parcelles receive a glyphosate treatment per year. At the scale of the region, taking the same % of 10.64%, the surface treated with glyphosate would be 114369 ha out of 1076366, 33 which are in cultures of list 1.
When treated with glyphosate, 97.4% of the treatments are done on more than 90% of the plot area.
· For Spring crop* / Winter crop*
The difference in % of treated area and treatment dose between winter and spring crops is very small, 1.2% difference (9.9% of areas under winter crops and 11.2% of areas under spring crops are treated) with a difference of 0.12 l / ha between winter and spring for the dose. Thus, there is a slight increase in tendency in the intensity of use measured by the quantity in l / ha for the spring crops.
· Per crops (figure 16 and 17)
The average area treated per crop varies from less than 10% for durum wheat, lupine, triticale and soybeans to 25% for linen.
Straw cereals seem to be less treated in terms of cultivated areas: rye, barley, durum wheat, common wheat, triticale are on the right side of the graph (figure 16).
Oleaginous crops, hemp and linen are more treated in terms of surfaces. One explanation may be the reduced availability of herbicides in crops for linen and hemp.
18.90% of area in sunflower is treated. This hight percentage could be explained by the fact that farmers in reduced tillage system often cultivated this crop and as they don’t use the plough to manage weeds, they usually treat on an superior area (Reboud X. et al, 2017).The differences of average quantity between crops is small between crops (less than 1 l of difference, excepted for the rye), it is not the crop that explain
The crop that is treated at the highest rate per hectare is rye, at 3.33l / ha (+/- 1.95). 10.7% of the areas intended to be in corn are treated at an average dose of 2.19 l/ha (+/- 1.31). 9.60% of the areas intended to be in soft wheat are treated at an average dose of 2.07 l/ha (+/- 1.2). 18.90% of the areas intended to be in sunflower are treated at an average dose of 2.22 l/ha (+/-1.40). 18.10% of the areas intended to be in Faba bean are treated at an average dose of 1.78 l/ha (+/-1.09).
Figure 19 : TFI herbicide without glyphosate as a function of TFI glyphosate for corn for the years 2016,2017 and 2018
Figure 20 : TFI herbicide without glyphosate as a function of TFI glyphosate for soft wheat for the years 2016,2017 and 2018
0 0,5 1 1,5 2 2,5 3 3,5 l/ h a tr e ate d Durum Wheat
Influence of previous crop on glyphosate
dose treatment for next crop
Durum Wheat Soft Wheat Corn Barley Sunflower Triticale Soft Wheat Barley Corn Rapeseed Sunflower Triticale Previous crop : R² = 0,0321 0 1 2 3 4 5 6 0 0,5 1 1,5 2 2,5 3 TFI h e rb ic id e wi th o u t g ly p h o sate TFI glyphosate
Soft wheat: TFI herbicide without glyphosate
as a function of TFI glyphosate
1204 data over the years 2016,2017, 2018 represented. Users of any herbicide are not represented
Figure 18 : Influence of previous crop on glyphosate dose treatment for next crop
Next crop : R² = 0,0158 0 0,5 1 1,5 2 2,5 3 3,5 4 4,5 0 0,5 1 1,5 2 2,5 3 3,5 TFI h e rb ic id e wi th o u t g ly p h o sate TFI glyphosate
Corn : TFI herbicides without glyphosate as a
function of TFI glyphosate
1442 data over the years 2016,2017,2018 represented. Users of any herbicide are not represented
II.2.3 Influence of precedent
The differences in average doses of glyphosate between precedents for the same next crop are small (figure 18). Standard deviations are less than 1.1 l / ha. Effect of the previous crop is very small on the dose treatment for a same next crop. This could be explained by the fact that glyphosate is applied between crops and the goal of the treatment is to clean the plot before sowing.
However, dose differences are higher for durum wheat, soft wheat and rapeseed than for corn, barley, sunflower and triticale crops. On average, a higher quantity of glyphosate is applied for previous durum wheat, for the following crops durum wheat, common wheat and rapeseed.
II.2.4 Link between glyphosate and herbicide
For corn and soft wheat, there is no linear relationship between the amount of glyphosate and herbicide applied in culture (figure 19 and 20: very low R² and distribution of points in all the 2D space). Low use of glyphosate does not necessarily imply increased use of herbicides in culture.
II.3 Discussions
The sample of mes parcelles represents more than a quarter of the list 1 (=COP products =Cereals, Oilseeds and Protein crops) (28.61%, annexe I) for Pays de la Loire region and the difference in area cultivated between winter and spring crops is close (15% for mes parcelles vs 18% for agreste regional data). Mes parcelles seems to be a correct representation of the regional use of glyphosate. According to this sample, 10.64% of the areas in list 1 are treated with glyphosate, this is slightly less than the national average including all sectors which amounted to 14% in 2015. Considering the viticultural and arboricultural sectors present in significant proportion in Pays de la Loire would increase this percentage of surface treated.
18.67% of the farmers in Pays de la Loire in fields crops or mixed crops/stock farming use glyphosate per year. Thus, the use of glyphosate concerns only a small part of farmers per year and the use of glyphosate is not systematic and is not really widespread.
The data cleaning changes the database. It allows to delete errors due to bad data entries but can delete real data that is extreme in relation to the average. Extreme values are thus not taken into account. However, the elevated standards deviations show the significant variability of data and thus of doses between farmers for the same crop.
The average amount of glyphosate applied (2.22 l/ha) is clearly above the one from Dephy analysis which is 1.68 l/ha on average, which can be explained by the fact that Dephy network gather people who are explicitly imply in a pesticide reduction. By comparing with Arvalis' recommendations for glyphosate dose efficiency on target, this average dose of 2.22 L / ha could be reduced by optimally adjusting doses to the target.
Transition: The analysis of Mes parcelles data allowed studying the uses and intensities of use of glyphosate by culture at the regional scale. The surveys will make it possible to study the uses and factors of use between farm types.
Table 5: Types of uses taken into account in the survey
Table 6: Example of table completed with farmers glyphosate uses
« Usage du glyphosate »
Meaning :
1 Fight against perennials
2 Cover crop destruction
3 Cleaning before sowing
4 Destruction of pastures Usage du glyphosate Culture précédente Culture suivante Date Produit grammage + adjuvants Quantité en l Adventices ciblées Annuelle / vivaces 100% surface ? Systéma tique ? Autre règles de decision + Zones 1 (exemple) Couvert végétal Mais 360 g/l Sulfate ammonium 1.25 oui non 1+3 Colza Blé 360 g/l 3 Repousses de colza + rumex qui releve dès récolte
oui non Selon
infestation des parcelles 4 Prairie temporaire printemps 360g/m , huile
3.5 chiendent oui oui
…
III. Analyses of the uses of glyphosate via a survey in the form of interview with Pays de la Loire farmers
III.1 Material and Method of the farmer survey Alt’R’Glypho III.1.1 Content of the farmer survey
I built the survey the first weeks of the internship and modified it after the first surveys. Due to some modifications the first weeks, for some indicators I only kept the surveys for whom the indicator was given by the farmer. The survey was in French. The questions, closed or open, allowing to collect data in figures and texts, are presented below for the 3 parts of the survey. Part 1 : Description of the farm
· Type of farm: Animals production and ETO (checked on Octagri)
· Distinction of different areas within their plot or not (based on different textures or other criteria
Part 2 : Crop production campaign 2017-2018
· UAA of the farm
· Crops production and hectares for each one · Crop rotations in including intercrops
· Choice and composition of the intercrops. What criteria do they make their choice of intercrops and their composition?
· Type of tillage system: How many years and for what crops? · What is the frequency of ploughing on the farm?
· What is the share of UAA using glyphosate?
· How many liters of glyphosate do you use throughout the year? For which product weight?
Part 3 : Use of glyphosate
From the 4 types of use considered in the survey (table 4), farmers described their uses of glyphosate (table 5 : the type(s) of use, after and before which crop, dose and grammage of the product, use of adjuvants, weeds targeted, on 100% of the surface or not, systematic or not, depending on the plots or not). Uses mentioned are for the campaign 2017/2018. The uses can and are often concomitant. For example, 3 + 1 means use of glyphosate for pre-plant cleaning and control of perennial weeds* in one treatment.
· TFI herbicide without glyphosate and TFI glyphosate per farm are derived from Mes parcelles data and only relate to farmers having Mes parcelles up to date.
· Completing the decision-making scheme of weed management levers (figure 21) Part 4 : Discussion
· Is your use of glyphosate increasing, reducing, stable? Since ? · Do you think you can reduce your doses of glyphosate use?
Department Number of farmers surveyed 44 Loire-Atlantique 2 49 Maine et Loire 13 53 Mayenne 8 72 Sarthe 8 85 Vendée 17 Pays de la Loire 48 ETO (Economic and Technical Orientation) Number of farms Cattle milk 14 Meat cattle 9 Polyculture 9 Granivores 6 General cultures 4 Pigs 3 Other herbivores 2 Mixed cattle 1 Total 48
Type of tillage system Definition and frequency of the ploughing
DS Direct Seeding=no ploughing over 6 years and no
tillage in 2017-2018 other than sowing
RT Reduce tillage=no ploughing over 6 years but other
tillage in 2017-2018
Ploughing rare Ploughing <1 time/3 years
Ploughing occasional 1 time/3 years <ploughing <1 time/2 years
Ploughing frequent 1time/2 years < ploughing <1 time/year
Ploughing systematic Ploughing=1 time/year
Type of tillage system Number of farms
Number who don't use glyphosate DS 5 RT 21 3 Ploughing rare 10 1 Ploughing occasional 6 1 Ploughing frequent 4 Ploughing systematic 1 1
Ploughing systematic in marais poitevin 1
Total 48 6
Figure 22: Map of the farmers surveyed Table 6: Number of farmers surveyed per
department
Table 7: ETO of the farms surveyed
Table 7: Categories of soil tillage and their definition
· What are the top 3 brakes in the list below to stop glyphosate on your farm? Or other
· Discussion about the Levers below at glyphosate stop
· Training on application conditions and mind about precision farming to manage weed
· General Outlook: What do you think about the possible stopping of glyphosate for French agriculture: An Opportunity? A risk ?
· Does a dose limitation per hectare per year seem like a good compromise? Yes / No (If yes, how much / hectare / year?)
III.1.2 Farm s surveyed
The choice of the farmers surveyed has been made from a list of farmers contacts provided following my request by several agricultural agronomic advisors from the chamber of agriculture of different localities of the region.
· Location
The location of the farmers surveyed is shown on the map opposite, figure 22. The number of farmers surveyed varies between departments (table 6), this sampling is partly due to the number of contacts that I received from the advisors by locality in each department. I tried to take into account the different pedo-climatic conditions that can be met in the region.
· Type of soil tillage
On the 48 farmers classified per type of soil tillage (table 8 and table 7 for the definition), there is an overrepresentation of farmers in reduced tillage (RT and SD). This is a choice in the way to study the practices of these farmers who use little tillage for the general reason of Substitution levers :
o Soil work: false seeding, stubble cultivation, ploughing. Which ? For what purpose? o Other herbicides (new or selective) o Destruction of cover crops by roll o Bio control
o Pasturing by animals
o Thermal weeding or electric weeding
Redesign of the cropping system:
o Diversification rotation (spring / winter crops, cereals / root crops) –lengthening
o Association of cultures o Choice of varieties (genetics) o Density and sowing dates o Permanent plant cover
o Seed of multi-annual temporary grasslands o Time traction in the field
o Cost
o Mechanical alternatives more complex or random efficiency o Lack of outlets / surface for lengthening rotations
o Mental load that can result from the choice of more technical practices
o Soil conservation (erosion, biological activity) +Environment (carbon storage,
preservation of biodiversity) o Fear of Sorrowing
o Calendar constraints / dates of interventions o Size of weed seed stocks in the soil
o Texture of the soil (s)
Figure 24: Share of each crop in% of the total crop area Corn 54,8% Wheat 27,3% Barley 4,1% Rapeseed 3,9% Faba bean 1,8% Triticale 1,6% Sunflower 1,4% Pea 1,3% Sorgho 1,2% Millet 0,6% Lupin 0,5% Hemp 0,4% Flax 0,4% Buckwheat 0,3% Quinoa 0,2% Soya 0,2%
Share of crop area treated with glyphosate in % of the
total area of these crops treated with glyphosate
Ex For pre-seeding cleaning use, 55 % of the surfaces are in maize
2,73
2,12
1,47
0 0,5 1 1,5 2 2,5 3 3,5 4 4,5Fight against perennials (27)
Destruction of pastures (26)
Cleanings before sowing or destruction of cover crop (102) l/ h a tr e ate d
Average amount of glyphosate per
type of use
Figure 23 : Average amount of glyphosate per type of use
Figure 25: Share of each area of crop treated in % of the total area of these crops treated with glyphosate Wheat 38,1% Corn 35,1% Rapeseed 6,7% Barley 6,2% Sunflower 2,8% Triticale 2,5% Faba bean 2,4% Meslin 1,6% Faba pea 1,5% Buckwheat 0,5% Linen 0,5% Others (chamomille, oat, fennel, quinoa, chard, onions) 0,5% Sorghum 0,4% Lupin 0,4% Millet 0,3% Hemp 0,3% Rye 0,1%
Share of each crop in % of the total crop area
38 % =wheat area / total area *100 On the 5855,75 ha, 38 % are dedicated to wheat Meadows and luzerne are not taken into account a
a
preservation of the biological activity but who consequently dispense their plots with this lever of weeds management. This sampling was made possible through contacts given by advisers dealing with farmer groups in reducing tillage. On the 48 farmers, there are 6 farmers who do not use glyphosate are for three of them in RT, 1 in occasional ploughing, 1 in systematic ploughing (table 8). As with the study of glyphosate uses from the dephy (Dephy 2017) database, there are no DSs that do not use glyphosate.
III.1.3 Methodology
Surveys were conducted face to face in the form of interviews in French. The survey lasted around 1.25 h per farmer.
The analyses are carried out on excel and R for the statistical description, average comparison tests and linear regression. On the abscissa of the graphs, in brackets is the number of farms taken into account.
III.2 Results
III.2.1 Quantitative analysis of Farmer surveys Alt’R’Glypho III.2.1.1 The uses of glyphosate
III.2.1.1.1 By type of uses
For the uses of glyphosate classified in 4 types, 155 answered have been collected. The averages of glyphosate quantities applied are different in trend between types of use. Of the 155 responses, 27 perennial applications of glyphosate were reported by 24 farmers at an average rate of 2.73 l / ha. 26 uses of glyphosate were reported for grassland destruction by 20 farmers for an average treatment rate of 2.12 l / ha. 102 uses of glyphosate were mentioned for cleaning before seeding or destruction of intercrops for an average dose of 1.47 l / ha(figure 23).
For use against perennials, the standard deviation is very high. It can be explained by the intended target. The perennial bindweeds require a higher amount of glyphosate to be damaged than the perennial rumex or thistle, for example. Various perennial and annual weeds are cited by farmers. The perennials encountered by the farmers listed from the largest to the least number of times cited are Rumex, quack grass, thistle, bindweed, mercurial, Agrostis stolonifera, knotweed. The annual weeds encountered by farmers listed from largest to lowest number of times cited are Paturin, Rye grass, chickweed, wild oats, foxtail, bromegrass, ravenella, veronica, datura, millet.
III.2.1.1.2 By area
Many different crops (16) are concerned by a treatment before sowing affected by glyphosate use before sowing (figure 24). The crops represented are the one for the use « cleaning before sowing ». On the 85 answered for this use, 29 farmers out of the 43 farmers who make corn declared to treat with glyphosate whatever the precedent, that is