HAL Id: hal-01806415
https://hal.archives-ouvertes.fr/hal-01806415
Submitted on 6 Jun 2018HAL is a multi-disciplinary open access
archive for the deposit and dissemination of sci-entific research documents, whether they are pub-lished or not. The documents may come from teaching and research institutions in France or abroad, or from public or private research centers.
L’archive ouverte pluridisciplinaire HAL, est destinée au dépôt et à la diffusion de documents scientifiques de niveau recherche, publiés ou non, émanant des établissements d’enseignement et de recherche français ou étrangers, des laboratoires publics ou privés.
A sequence-tagged genetic map for the brown alga
Ectocarpus siliculosus provides large-scale assembly of
the genome sequence
Svenja Heesch, Ga Youn Cho, Akira Peters, Gildas Le Corguillé, Cyril
Falentin, Gilles Boutet, Solene Coedel, Claire Jubin, Gaëlle Samson, Erwan
Corre, et al.
To cite this version:
Svenja Heesch, Ga Youn Cho, Akira Peters, Gildas Le Corguillé, Cyril Falentin, et al.. A sequence-tagged genetic map for the brown alga Ectocarpus siliculosus provides large-scale assem-bly of the genome sequence. New Phytologist, Wiley, 2010, 188 (1), pp.42-51. �10.1111/j.1469-8137.2010.03273.x�. �hal-01806415�
A sequence-tagged genetic map for the brown alga Ectocarpus
siliculosus provides large-scale assembly of the genome sequence
Svenja Heesch1,2, Ga Youn Cho1,2,†, Akira F. Peters3, Gildas Le Corguillé4, Cyril Falentin5, Gilles Boutet6, Solène Coëdel6, Claire Jubin7, Gaelle Samson7, Erwan Corre4, Susana M. Coelho1,2 and J. Mark Cock1,2,*
1
UPMC Univ. Paris 06, The Marine Plants and Biomolecules Laboratory, UMR 7139, Station Biologique de Roscoff, Place Georges Teissier, BP74, 29682 Roscoff Cedex, France.
2
CNRS, UMR 7139, Laboratoire International Associé Dispersal and Adaptation in Marine Species, Station Biologique de Roscoff, Place Georges Teissier, BP74, 29682 Roscoff Cedex, France.
3
Bezhin Rosko, 28 route de Perharidy, 29680 Roscoff, France
4
Computer and Genomics Resource Centre, FR 2424, Station Biologique de Roscoff, Place Georges Teissier, BP74, 29682 Roscoff Cedex, France.
5
INRA, Agrocampus Ouest, Université de Rennes 1, UMR 118 APBV (Plant Genetics and Biotechnologies), BP35327, 35653 Le Rheu Cedex, France.
6
INRA, Plateforme Séquençage-Génotypage Biogenouest, UMR 118 INRA-AGROcampus Ouest-Université Rennes 1, 35653 Le Rheu, France
7
CEA, DSV, Institut de Génomique, Génoscope, 2 rue Gaston Crémieux, CP5706, 91057 Evry, France
†
Present address: National Institute of Biological Resources, Gyeongseo-dong, Seo-gu, Incheon 404-708 Korea
*
author for correspondence
Running title: E. siliculosus genetic linkage map
Summary
Ectocarpus siliculosus has been proposed as a genetic and genomic model for the brown algae and the 214 Mbp genome of this organism has been sequenced. The aim of this project was to obtain a chromosome-scale view of the genome by constructing a genetic map using microsatellite markers that were designed based on the sequence supercontigs.
To map genetic markers, a segregating F2 population was generated from a cross
between the sequenced strain (Ec 32) and a compatible strain from northern Chile. AFLP analysis indicated a significant level of polymorphism (41%) between the genomes of these two parental strains. Of 1,152 microsatellite markers that were selected for analysis based on their location on long supercontigs, their potential as markers and their predicted ability to amplify a single genomic locus, 407 were found to be polymorphic.
A genetic map was constructed using 406 markers, resulting in 34 linkage groups. The 406 markers anchor 325 of the longest supercontigs onto the map, representing 70.1% of the genome sequence.
The Ectocarpus genetic map described here not only provides a large-scale assembly of the genome sequence, but also represents an important tool for future genetic analysis using this organism.
Keywords
chromosomes, Ectocarpus siliculosus, genetic linkage map, microsatellites, model organism, Phaeophyceae
Introduction
Brown algae are an ecologically and economically important group of organisms. They are the dominant organisms in most coastal ecosystems, providing habitats for a wide range of other species, and are exploited both as a food source and for biomolecules such as alginates and fucans. As our understanding of these organisms improves, additional biomolecules of interest are being developed, such as the use of the brown algal storage polysaccharide, laminarin, as an elicitor of defence responses in crop plants (Klarzynski et al., 2000). Brown
algae are also one of the groups that have been put forward as having a high potential as a source of biofuel (reviewed in Bartsch et al., 2008).
The brown algae are members of the stramenopiles and, as such, are distantly related to other major eukaryotic groups such as the animals and fungi (opisthokonts) or land plants and green algae (plantae). As a result of this phylogenetic position, the brown algae exhibit many novel features compared with these other groups, and this is one of the reasons why these organisms are of interest for the development of novel biomolecules. Another consequence of the large phylogenetic distance that separates brown algae from the plantae and the opisthokonts is that model organisms from the latter groups are only of limited relevance to understanding brown algal biology. In order to study the novel features exhibited by this group at the molecular level, it is therefore necessary to develop model organisms that are better adapted to studying brown algal biology.
Over the last two centuries, Ectocarpus siliculosus has been used as a model organism to study many aspects of algal biology (Charrier et al., 2008) and several groups are currently focusing their effort on the development of modern genetic and genomic tools for this organism (Peters et al., 2004a; Coelho et al., 2007). This recent work has involved the sequencing of the complete 214 Mbp genome of this alga (http://www.cns.fr/spip/-Ectocarpus-siliculosus-.html, Cock et al., submitted) and the development of a range of molecular, genomic and genetic tools including large collections of cDNA and small RNA sequences, whole genome tiling microarrays, EST-based expression microarrays and mutant screens (Peters et al., 2008, Dittami et al., 2009; Cock et al., submitted; unpublished data). Ectocarpus was chosen as a model organism because it has several features that make it amenable to genetic approaches. These include its small size, its relatively short life cycle (three months), which can be completed under laboratory conditions, it's high fertility and because controlled genetic crosses can be carried out (Peters et al., 2004a). The haploid-diploid life cycle of Ectocarpus provides a means to directly assess the effects of genetic variations (such as mutations) in a haploid context, without the confounding effects of heterozygosity and dominance. Moreover, all the meiospores in a unilocular sporangium are derived from a single meiotic event (which is followed by several mitotic divisions), allowing analysis of the progeny of a single meiosis (Knight, 1931; Peters et al., 2008).
Here we describe the construction of a sequence-anchored genetic map for Ectocarpus. The genetic map was constructed for two reasons. The first objective was to create a tool for genetic analyses in this species, such as associating phenotypes with genetic loci, mapping genetic mutants and as a starting point for positional cloning projects. The
second objective was to create a large-scale assembly of the Ectocarpus genome sequence (a process that is also referred to as super-scaffolding). The genome has been sequenced to 10.5x coverage and the sequence data has been assembled into 1,565 supercontigs (i.e. chains of contiguous contigs separated by short sequence gaps, often also referred to as scaffolds). This assembly represents a high quality draft genome sequence but no information has been available about how these supercontigs are organised at the chromosome scale. In this study we have mapped microsatellite (or simple sequence repeat, SSR) markers derived from 325 of the longest supercontigs to anchor these sequences onto a genetic map. This has allowed 137 Mbp (70.1% of the genome) of DNA sequence to be associated with genetic linkage groups. The genetic map, therefore, both represents an important tool for future genetic analysis in Ectocarpus and provides a large-scale assembly of the genome sequence that will be invaluable for identifying genome-wide trends in Ectocarpus.
Materials and methods
Algal strains, culture conditions and DNA extraction
The segregating mapping population was generated by crossing Ectocarpus siliculosus strain Ec 32 (CCAP 1310/04; Peters et al., 2008) with strain Ec 568 (CCAP 1310/334), isolated from Arica, northern Chile (Peters et al., 2010). Production and raising of zygotes was performed by combining fertile gametophyte thalli of the two parental strains in a hanging drop preparation, as described (Peters et al., 2004b). Each of the 60 individuals of the segregating F2 population was derived from a different unilocular sporangium (i.e. from
separate meiotic events) on the same hybrid F1 sporophyte (strain Ec 569, CCAP 1310/335).
The progeny were maintained as haploid lines by cultivating asexual partheno-sporophyte progeny of the F2 population of gametophytes. Strains were cultivated at 13°C in white
fluorescent light of 10-30 mol m–2s–1photon fluence rate and a day length of 10 hours light: 14 hours dark in a walk-in culture room. The culture medium was half-strength, Provasoli-enriched (Starr & Zeikus, 1993), autoclaved seawater. DNA was extracted from about 800 mg of tissue that had been frozen at -80°C by grinding the material in liquid nitrogen and extracting using either a commercial kit (Macherey & Nagel, Germany), according to the manufacturer’s instructions, or a CTAB extraction protocol (Cock et al., submitted). The DNA was purified on a CsCl gradient using Hoechst bis-benzimide 33258 (Sigma-Aldrich,
Buchs, Switzerland) as the fluorescent stain. DNA yield and quality was assessed using a spectrophotometer (Nanodrop, Wilmington, USA) and by agarose gel electrophoresis.
AFLP analysis of polymorphism
AFLP analysis was carried out as described by Vos et al. (1995). A total of 250 ng of template DNA was digested with EcoRI and MseI before addition of adapters. In contrast to the original protocol, digested DNA was not diluted ten-fold before the ligation step. The digested and ligated DNA was then used for pre-selective amplification with EcoRI+A (GACTGCGTACCAATTCA) and MseI+C (GATGAGTCCTGAGTAAC) primers. Pre-selective amplification mixtures were diluted 50-fold with TE buffer and then used in selective amplification. Selective amplifications were carried out with +3 nucleotide EcoRI and MseI primers (Supplementary table S1). The EcoRI primers were labelled with a fluorescent dye (IRD 700 or IRD 800). AFLP PCR products were analysed on a Licor LongRead IR4200 DNA analyzer with a 5.5% polyacrylamide gel matrix (LI-COR Biosciences Ltd, Cambridge, UK) using a laboratory-made size ladder. The AFLP patterns of each parent strain were compared based on fragment sizes, and all polymorphic markers present in one parent and absent in the other were scored.
Development and analysis of SSR markers
SSR markers were designed using the SSRPrimer program (Jewell et al., 2006), which combines the algorithm Sputnik, to identify SSRs in the genome sequence, and Primer3, to design oligonucleotide primers to amplify the region corresponding to the SSR. For a particular sequence supercontig, the optimal SSR marker was selected based on the repeat type (di- and tri-nucleotide repeats were favoured), the number of repeats (over 20 repeats if possible) and the size of the PCR product (between 150 and 400 bp). Potential SSR markers were then tested by carrying out a simulated PCR against the complete genome sequence using the program e-PCR (Schuler, 1997). Primer pairs that were predicted to amplify more than one genomic region were eliminated and an alternative marker was selected for that supercontig.
PCR reactions for SSR genotyping were prepared on both Biomek NX (Beckman) and Star (Hamilton) liquid handling platforms. Adapting the method of Schuelke (2000), the 5 µl PCR reactions contained 12-15 ng of template DNA diluted in sterile Millipore water, 1 µl of
5x GoTaq reaction buffer, 0.25 µl of dimethyl sulphoxide, 10 nmol MgCl2, 0.5 nmol of each
dNTP, 0.2 pmol of the forward primer (which included a 19 nucleotide tail corresponding to a sequence of the M13 bacteriophage), 2 pmol of the reverse primer, 1.8 pmol of the fluorescence-marked M13 primer and 0.2 units of recombinant GoTaq-polymerase (Promega, Charbonnieres, France). The PCR reactions were carried out on a 384 well plate PTC-115 thermocycler (Bio-Rad). The PCR protocol comprised an initial denaturation step at 94ºC for 4 min, followed by 12 touch-down cycles involving denaturation at 94ºC for 30 seconds; annealing at 65-54ºC for 1 min (decreasing by 1°C with each cycle) and extension at 72ºC for 30 seconds, then 25 cycles of denaturation at 94ºC for 30 seconds, annealing at 53°C for 1 min and extension at 72ºC for 30 seconds, with a final extension step at 72°C for 10 min. Two or three 384-well PCR products were simultaneous pooled and diluted 1:50 to 1:90 in 70% formamide supplemented with GenScan-500 LIZ Size Standard (Applied Biosystems, Foster City, USA). Electrophoresis and allele detection was carried out on an ABI3130xl Genetic Analyser (Applied Biosystems) with 36 cm capillaries. Output was analysed with Genemapper version 4.0 (Applied Biosystems). All marker data were verified manually by visual inspection to eliminate any errors introduced by the automatic allele assignation.
Linkage map construction
The fit of marker-allele segregations to the expected 1:1 segregation ratio was tested by a χ2 -test (P = 0.05). Genotyping data were assembled in a unique file to elaborate the genetic linkage map. MAPMAKER/EXP 3.0 was used to build the genetic linkage map (Lander et al., 1987). A minimum logarithm of odds (LOD) score of 4.0 with a maximum genetic distance of 50 cM was first used to associate SSR loci into initial linkage groups. Then, the LOD score was reduced to bridge some intervals. To determine the correct marker order within the linkage groups, multipoint analysis was performed using ‘‘order’’, “try” and “map” commands for groups containing more than 5 loci and using “comp” for groups containing less than or equal to 5 loci. Genetic distances were calculated according to the Kosambi formula.
Orientation of supercontigs on the genetic linkage map
When more than one marker had been mapped for a single sequence supercontig, it was possible to orientate the supercontig relative to the genetic map, provided that there had been
recombination between the markers. The genes along each supercontig have been given locusID numbers that run sequentially (for the most part) along the supercontig. Supercontigs in which the genes with the lowest locusID numbers (i.e. at the "start" of the supercontig) were orientated towards the top of the linkage group (linkage group orientation as in Fig. 1) were defined as having a "+" orientation, whilst supercontigs with the opposite orientations were denoted by "-".
Results
Identification of compatible, polymorphic parental strains
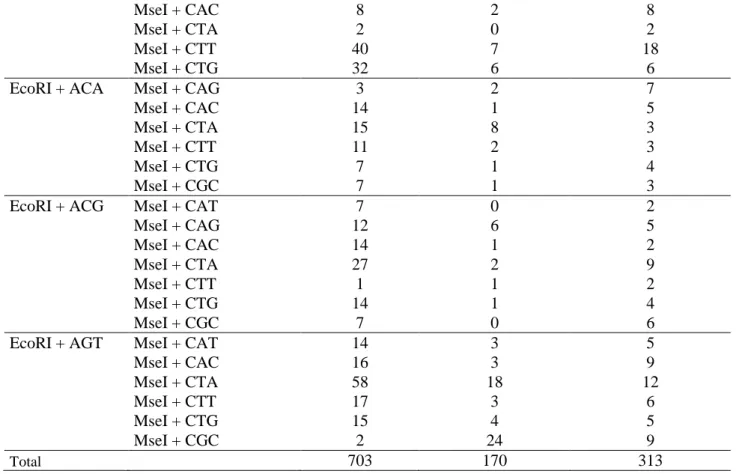
The Ectocarpus genome sequence was generated using the male strain Ec 32, a meiotic offspring of a field sporophyte from San Juan de Marcona, Peru (Peters et al., 2008). To identify a suitable female strain for the generation of the genetic map, 119 individuals were isolated from Peru and northern Chile and one of these strains, Ec 568, from Arica, Chile, was found to be fertile and compatible with Ec 32. The thalli raised from zygotes were capable of meiosis. Meiospores from one of these thalli (Ec 569) developed into female and male gametophytes confirming its heterozygosity. An amplified fragment length polymorphism (AFLP) analysis using 51 primer combinations was carried out on the two crossed strains to estimate the level of polymorphism between the two genomes. A total of 1,186 AFLP fragments were analysed. Of these, 703 fragments were amplified from both parents, indicating that these represented monomorphic regions of the genome, 170 were only amplified from Ec 32 and 313 only from Ec 368. This analysis indicated a high level of polymorphism (41%) between the two parental strains and these strains were therefore retained for the construction of the genetic map. There was a bias towards the detection of polymorphic fragments in the Ec 568 strain compared to Ec 32 (65% of the polymorphic fragments were found in the former).
Construction of a genetic map for Ectocarpus
One of the major aims of this project was to improve the large-scale assembly of the Ectocarpus genome by anchoring supercontigs onto linkage groups. To do this, the sequence of each supercontig was analysed using the SSRPrimer program (Jewell et al., 2006) to identify a set of candidate SSRs for each supercontig. A two-stage marker selection process
was then employed to maximise coverage of the longest supercontigs (i.e. to maximise the length of DNA sequence anchored per marker). In the first round 576 markers were selected from amongst the 624 longest supercontigs and tested for polymorphism. In the second round, an additional 576 markers were tested, including both alternative markers for supercontigs that did not produce usable markers in the first round and markers for additional supercontigs. The SSR markers to be tested were selected based on several criteria (see material and methods for details) and simulated PCRs were carried out against the complete genome sequence using the program e-PCR (Schuler, 1997) to determine whether each oligonucleotide pair could be expected to amplify a single region of the genome. Testing for polymorphism by PCR amplification was only carried out using oligonucleotide pairs that fulfilled this criterion. A total of 1,152 markers were genotyped using DNA from the two parental lines. Of these, 522 (45%) were found to be polymorphic but 115 of the polymorphic markers had to be excluded because they did not give signals of sufficiently strong intensity or because the oligonucleotides amplified non-specific products or multiple loci. The remaining 407 oligonucleotide pairs were then used to genotype a population of 60 haploid F2
progeny that had been generated by crossing the two parental lines.
To produce this segregating population, an F2 population of haploid gametophytes was
produced from the hybrid, diploid F1 sporophyte (Ec 569) created by crossing Ec 32 and Ec
568 (see above). This was done by first isolating individual unilocular sporangia from Ec 569 and then isolating single gametophytes that germinated from the meiospores released by the sporangia. Each individual of the F2 population was isolated from a different unilocular
sporangium to ensure that each member of the population was derived from a distinct meiotic event. In Ectocarpus, unfertilised gametes can germinate parthenogenetically to produce haploid partheno-sporophytes. These partheno-sporophytes can then reproduce asexually via mito-spores. By exploiting this phenomenon, we were able to maintain each haploid line in partheno-sporophyte form. In order to obtain good quality, reproducible SSR genotyping data, we found that it was necessary to use CsCl purified DNA.
During the genotyping of the 60 F2 progeny, one of the primer pairs amplified two
polymorphic regions, providing a second unlinked marker (M_00X, Fig. 1) in addition to the marker for which it was designed. This additional marker was not predicted by the PCR simulation, indicating that it corresponds to a region of the genome that has not been sequenced. In all, therefore, 408 SSR markers were mapped against the two parental lines and the 60 F2 progeny (Supplementary tables S2, S3). All the markers amplified fragments from
genotyped in 98.4% of the individuals of the population (i.e. the two parents plus the 60 F2
progeny).
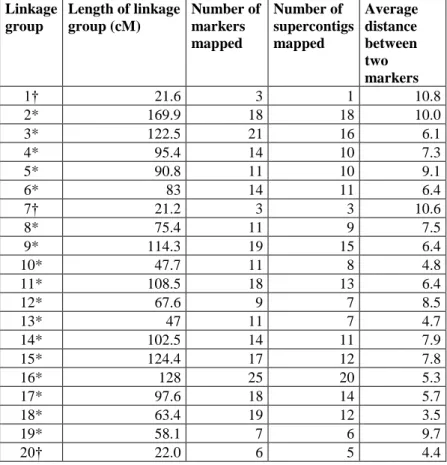
A minimum LOD score of 4.0 with a maximum genetic distance of 50 cM allowed us to obtain 35 linkage groups initially. We then used an LOD score of 3.5 to bridge some of the intervals. The final map consisted of 406 markers mapped to 34 linkage groups: 26 of which were between 47 and 170 cM long and 8 of which were between 2 and 23 cM long. Together, the 34 linkage groups span a total distance of 2,459.3 cM, with an average distance of 6.6 cM between adjacent markers (Fig. 1, Tables 1, 2). If twice the average marker spacing is added for each linkage group (to account for the regions beyond the terminal markers at each end of the linkage group) this gives a total genome length of 2,908.8 cM. The 26 longest linkage groups span 2,350.7 cM with an average distance between markers of 6.7 cM. The 8 short linkage groups span 108.6 cM with an average distance between markers of 4.9 cM.
Three hundred and twenty five supercontigs were positioned on the genetic map, representing a total of 137 Mbp (70.1% of the genome sequence). Fifty-nine of the supercontigs were mapped using more than one marker (between 2 and 4 markers per supercontig, 139 markers in all). In all cases, physically linked markers mapped to adjacent positions on the genetic map. The genetic map was therefore strongly supported by the physical data for these markers. Forty of the 59 supercontigs could be orientated relative to the adjacent supercontigs using the linkage data (Table 3). An additional four supercontigs were orientated by combining linkage data with the presence of a gene that spanned a pair of supecontigs (see below). Comparison of the genetic and physical distances between these markers indicated that one cM was equivalent to 53.9 kbp. However, it must be noted that this relationship was highly variable depending on the pair of markers that was analysed, giving values ranging between 3.3 and 178.5 kbp/cM when individual pairs of markers that exhibited recombination were analysed.
Three markers were mapped for the longest supercontig (sctg_0000) but this region was not linked to any other supercontigs. This may be because this supercontig represents a discrete linkage group, but it is also possible that the markers used were not close enough to the extremities of the sequence (the external markers were 1,233 and 2,000 kbp from each end of the supercontig, respectively).
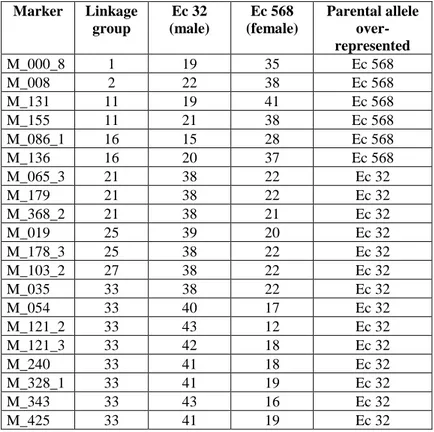
A small proportion of the loci showed segregation distortion (by a χ2-test, P≤0.05) in the segregating mapping population (20 loci on 8 linkage groups, representing 4.9% of the 406 mapped loci, Table 4). Most of these loci (60%) were widely distributed in the genome, being located on seven different linkage groups. However, eight of the loci with skewed segregation
were clustered, covering nearly half of linkage group 33. This cluster comprises loci exclusively favouring the alleles of the male parent, Ec 32. Considering the small number of such loci, we chose to keep them in the data set, since they would not have had a significant skewing effect on the map.
Three markers exhibited evidence of a mutation occurring within the microsatellite sequence during the decent from the parents to the progeny (Table 5). For markers M_467 and M_030_4 the new mutant allele was different to both parental alleles and it was possible to determine which parental allele had mutated based on the segregation ratios. For marker M_032_3 however, the allele of the male parent appears to have mutated to have the same sequence as the allele of the female parent. This marker could not be exploited. Note that an alternative hypothesis is that M_032_3 corresponded to a locus exhibiting particularly strong segregation distortion.
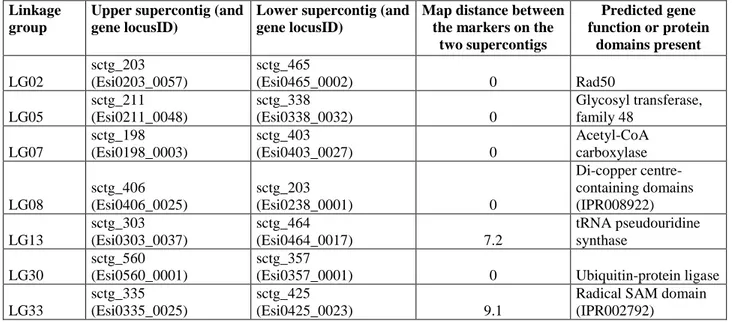
The extremities of supercontigs that had been mapped to adjacent sites on the genetic map were analysed for the presence of genes that spanned the two supercontigs. Seven split genes were found including, for example, the Ectocarpus Rad50 gene (Table 6). Identification of these seven supercontig-spanning genes allowed the 14 supercontigs carrying the fragments of the genes to be orientated with respect to each other. Two of the supercontig pairs, on linkage groups 14 and 33, could also be orientated with respect to their linkage groups by combining this information with mapping data.
Sequencing of the genome of strain Ec 32 identified an inserted viral genome (Cock et al. submitted), closely related to the Ectocarpus virus EsV-1 (Delaroque et al., 2001). Comparison of the inserted virus with EsV-1 indicated that a region of the genome surrounding the putative integrase gene EsV-1-213 had been deleted from the former. A homologue of EsV-1-213 was identified on a different supercontig suggesting either that this gene had integrated separately at a separate locus or that this region of the virus had transposed after integration into the host genome. Analysis of the genetic map indicated that these two fragments of the genome are in two different linkage groups, the majority of the viral genome in supercontig 0052 being located on linkage group 16 whilst the EsV-1-213 homologue on supercontig 0371 mapped to linkage group 23.
Discussion
In this study, we report the construction of a genetic map for the brown alga E. siliculosus, based on a cross between two highly polymorphic parental strains. Only a small number of
genetic maps have been generated for species outside the opisthokont and plantae lineages. Within the stramenopile (or heterokont) lineage, to which the brown algae belong, molecular-marker-based maps have been reported for the distantly related oomycetes (van der Lee et al., 1997; May et al., 2002; Sicard et al., 2003; van der Lee et al., 2004) and a tentative linkage map has recently been published for the kelp Laminaria japonica (Yang et al., 2009).
The Ectocarpus genetic map consists of 26 large linkage groups and eight smaller linkage groups. The smaller linkage groups may coalesce with the larger linkage groups if additional markers were to be added to the map, and this process could be facilitated by exploiting the existing data. For example, all eight of the small linkage groups have large supercontigs (i.e. 400 kbp or larger) at at least one end, suggesting that densification of markers within these supercontigs could allow them to be linked to the larger linkage groups.
The number of linkage groups agrees reasonably well with the estimated number of 25 chromosomes reported for E. siliculosus by Müller (1966, 1967). The genetic map integrated 406 (99.5%) of the 408 markers that were genotyped, indicating that it covers a large majority of the genome. There are however regions where additional markers would significantly improve the map. The SSR markers used were robust, each providing genotype information for nearly all the individuals of the segregating population. The use of 140 markers that were physically linked to at least one other marker allowed a rigorous evaluation of the map. No conflicts were identified between the physical and genetic information for any of these markers.
About 5% of the mapped loci showed a distorted segregation pattern. Most of the distorted loci were scattered around the genome but eight loci clustered together on linkage group 33. A small percentage of markers are expected to show distorted segregation ratios as a result of random fluctuations but in the majority of cases the distorted segregation patterns observed probably reflected real biases in the relative transmissibility of the two alleles. Production of meiospores in the unilocular sporangia of the sporophyte involves a single meiotic division followed by a series of mitotic divisions that give rise to about 100 meiospores in each sporangium. These spores are then released and germinate to give rise to the gametophyte generation. Distorted segregation patterns may have caused by alleles that caused a reduced rate of cell division within the unilocular sporangium or negative effects on meiospore germination or growth of the gametophyte. Presumably, such effects would have been due to epistatic interactions between alleles at more than one locus because the presence of a haploid generation in the life cycle should effectively select against deleterious factors due to single loci. Moreover, incompatible combinations of alleles at different loci might have
been expected in the mapping population, given the high level of polymorphism between the two parental strains (41% according to the AFLP analysis). Note that aberrant segregation patterns suggesting the occurrence of translocations and aneuploidy have been described in another stramenopile group, the oomycetes (Judelson, 1996; Carter et al., 1999; Judelson & Roberts, 1999; van der Lee et al., 2001, Dobrowolski et al., 2002, van der Lee et al., 2004).
Three of the markers used showed evidence of mutations occurring within the microsatellite region during the establishment of the mapping population. This represents a frequency of detectable mutations at each SSR of 0.37%.
The Ectocarpus genetic map, and the population of individuals that was used to generate it, represent important resources for future genetic analyses in this species. The map will allow new genetic mutations to be mapped to linkage groups, providing information about the positions of the corresponding genes in the genome and a starting point for positional cloning projects. In addition, the highly polymorphic mapping population could be exploited to screen directly for genetic factors that, for example, affect responses to environmental modifications. The haploid nature of the individuals permits direct screening for phenotypes associated with genetic polymorphisms without the confounding effects of dominance effects between alleles. Moreover, the sequence-tagged molecular markers allow phenotypic differences to be associated with specific regions of the sequenced genome. Another strong point of this system is that the population can be stably maintained in the haploid state so that phenotypic screens can be carried out at any time directly on an identical copy of the original mapping population.
The genetic map has also provided important information about the Ectocarpus genome, allowing 70.1% of the genome sequence (137 of the 214 Mbp) to be anchored onto linkage groups and, thereby, providing a large-scale view of the genome's structure. This information has been used to construct pseudochromosomes (by concatenating adjacent supercontigs) and to carry out broad analyses of genome composition including analyses of gene and transposable element densities and GC content (Cock et al., submitted). Analysis of the pseudochromosomes did not identify any clear, large-scale heterogeneity, although a small number of pseudochromosomes were either unusually rich in transposable elements (linkage groups 29 and 30) or had an unusually low density of genes (30 and 32; Cock et al., submitted).
Acknowledgements
This project was supported by grants to SH from the Conseil Générale de Finistère and to GYC from the Korean Research Foundation and by support from the GIS Europôle Mer, the Centre National de Recherche Scientifique, the European Union network of excellence Marine Genomics Europe, the Europole Mer and the University Pierre and Marie Curie. We would also like to acknowledge the help of Delphine Scornet, Sylvie Rousvoal, Laurence Dartevelle, Sarah Stewart, Morgan Perennou, Sarah Romac, Serinde J. van Wijk, Marie Laure Guillemin (all at the Station Biologique de Roscoff, France; SJvW is now at Bangor University, UK, MLG is now at the Pontificia Universidad Católica de Chile, Santiago, Chile) and Gwenn Verplancke (INRA, Le Rheu, France).
References
Bartsch I, Wiencke C, Bischof K, Buchholz CM, Buck BH, Eggert A, Feuerpfeil P, Hanelt D, Jacobsen S, Karez R, et al. 2008. The genus Laminaria sensu lato: recent insights and developments. European Journal of Phycology 43: 1-86.
Carter DA, Buck KW, Archer SA, van der Lee T, Shattock RC, et al. 1999. The detection of nonhybrid, trisomic, and triploid offspring in sexual progeny of a mating of Phytophthora infestans. Fungal Genetics and Biology 26: 198–208.
Charrier B, Coelho SM, Le Bail A, Tonon T, Michel G, Potin P, Kloareg B, Boyen C, Peters AF, Cock JM. 2008. Development and physiology of the brown alga Ectocarpus siliculosus: two centuries of research. New Phytologist 177: 319-332.
Cock JM, et al. 2009. The Ectocarpus genome and the independent evolution of multicellularity in the brown algae. Submitted
Coelho S, Peters AF, Charrier B, Roze D, Destombe C, Valero M, Cock JM. 2007. Complex life cycles of multicellular eukaryotes: new approaches based on the use of model organisms. Gene 406: 152-170.
Delaroque N, Müller DG, Bothe G, Pohl T, Knippers R, Boland W. 2001. The complete DNA sequence of the Ectocarpus-siliculosus-Virus Genome. Virology 287: 112-132. Dittami SM, Scornet D, Petit JL, Ségurens B, Da Silva C., Corre E, Dondrup M,
Glatting KH, König R, Sterck L, et al. 2009. Global expression analysis of the brown alga Ectocarpus siliculosus (Phaeophyceae) reveals large-scale reprogramming of the transcriptome in response to abiotic stress. Genome Biology 10: R66.
Dobrowolski MP, Tommerup IC, Blakeman HD, O’Brien PA. 2002. Non-Mendelian inheritance revealed in a genetic analysis of sexual progeny of Phytophthora cinnamomi with microsatellite markers. Fungal Genetics and Biology. 35: 197–212.
Jewell E, Robinson A, Savage D, Erwin T, Love CG, Lim GA, Li X, Batley J, Spangenberg GC, Edwards D. 2006. SSRPrimer and SSR Taxonomy Tree: Biome SSR discovery Nucleic Acids Research 34: W656-W659.
Judelson HS. 1996. Genetic and physical variability at the mating type locus of the oomycete, Phytophthora infestans. Genetics 144: 1005–1013.
Judelson HS, Roberts S. 1999. Multiple loci determining insensitivity to phenylamide fungicides in Phytophthora infestans. Phytopathology 89: 754–760.
Klarzynski O, Plesse B, Joubert J-M, Yvin J-C, Kopp M, Kloareg B, Fritig B. 2000. Linear -1,3 glucans are elicitors of defense responses in tobacco. Plant Physiology 124: 1027-1037.
Knight M. 1931. Studies in the Ectocarpaceae. II. The Life-History and Cytology of Ectocarpus siliculosus, Dillw. Proceedings of the Royal Society of Edinburgh 56: 47-70. Lander ES, Green P, Abrahamson J, Barlow A, Daly MJ, Lincoln SE, Newberg LA.
1987. MAPMAKER: an interactive computer package for constructing primary genetic linkage maps of experimental and natural populations. Genomics 1: 174-181.
May KJ, Whisson SC, Zwart RS, Searle IR, Irwin JAG, Maclean DJ, Carroll BJ, Drenth A. 2002. Inheritance and mapping of 11 avirulence genes in Phytophthora sojae. Fungal Genetics and Biology 37: 1-12.
Müller DG. 1966. Untersuchungen zur Entwicklungsgeschichte der Braunalge Ectocarpus siliculosus aus Neapel. Planta 68: 57-68.
Müller DG. 1967. Generationswechsel, Kernphasenwechsel und Sexualität der Braunalge Ectocarpus siliculosus im Kulturversuch. Planta 75: 39-54.
Peters AF, Mann AD, Córdova CA, Brodie J, Correa JA, Schroeder DC, Cock, JM. 2010. Diversity of Ectocarpus (Ectocarpales, Phaeophyceae) in Peru and northern Chile, the area of origin of the genome-sequenced strain. New Phytologist, submitted.
Peters AF, Marie D, Scornet D, Kloareg B, Cock JM. 2004a. Proposal of Ectocarpus siliculosus (Ectocarpales, Phaeophyceae) as a model organism for brown algal genetics and genomics. Journal of Phycology 40: 1079-1088.
Peters, AF, Scornet D, Müller, DG, Kloareg B, Cock JM. 2004b. Inheritance of organelles in artificial hybrids of the isogamous multicellular chromist alga Ectocarpus siliculosus (Phaeophyceae). European Journal of Phycology 39: 235-242.
Peters AF, Scornet D, Ratin M, Charrier B, Monnier A, Merrien Y, Corre E, Coelho SM, Cock JM. 2008. Life-cycle-generation-specific developmental processes are modified in the immediate upright mutant of the brown alga Ectocarpus siliculosus. Development 135: 1503-1512.
Schuler GD. 1997. Sequence Mapping by Electronic PCR. Genome Research 7: 541-550. Schuelke M. 2000. An economic method for the fluorescent labeling of PCR fragments.
Nature Biotechnology 19: 233-234.
Sicard D, Legg E, Brown S, Babu NK, Ochoa O, Sudarshana P, Michelmore RW. 2003. A genetic map of the lettuce downy mildew pathogen, Bremia lactucae, constructed from molecular markers and avirulence genes. Fungal Genetics and Biology 39: 16–30.
Starr RC, Zeikus JA. 1993. UTEX – The culture collection of algae at the University of Texas at Austin 1993 List of cultures. Journal of Phycology 29 (suppl.): 1-106.
van der Lee T, Witte De IJ, Drenth A, Alfonso C, Govers F. 1997. AFLP linkage map of the oomycete Phytophthora infestans. Fungal Genetics and Biology 21: 278–291.
van der Lee T, Testa A, van ‘t Klooster JW, van den Berg-Velthuis G, Govers F. 2001. Chromosomal deletion in isolates of Phytophthora infestans correlates with virulence on R3, R10 and R11 potato lines. Molecular Plant-Microbe Interactions 14: 1444–1452 van der Lee T, Testa A, Robold A, van't Klooster J, Govers F. 2004. High-density genetic
linkage maps of Phytophthora infestans reveal trisomic progeny and chromosomal rearrangements. Genetics 167, 1643-1661.
Vos P, Hogers R, Bleeker M, Reijans M, van de Lee T, Hornes M, Frijters A, Pot J, Peleman J, Kuiper M, Zabeau M. 1995. AFLP: a new technique for DNA fingerprinting. Nucleic Acids Research 23: 4407-4414.
Yang G, Sun Y, Shi Y, Zhang L, Guo S, Li B, Li X, Li Z, Cong Y, Zhao Y, Wang W. 2009. Construction and characterization of a tentative amplified fragment length polymorphism–simple sequence repeat linkage map of Laminaria (Laminariales, Phaeophyta). J. Phycol. 45: 873-878.
Tables
Table 1. General statistics for the E. siliculosus genetic linkage map.
All linkage groups 26 longest linkage groups 8 shortest linkage groups
Total length of map (cM) 2459.3 2350.7 108.6
Total length of map with correction for linkage group ends (cM) 2908.8
Mean spacing between markers (cM) 6.6 6.7 4.9
Maximum spacing between two markers (cM) 34.8 34.8 21.2
kbp/cM 53.9
Number of markers genotyped 408
Number of markers located on the map 406
Number of markers showing segregation distortion 24
Average % of individuals genotyped by each marker 98.4
Number of supercontigs mapped 325
Amount of sequence anchored on the map (bp) 137249116
Mean number of markers per supercontig 1.25
Number of markers that are on a supercontig with another marker 139
Number of supercontigs with more than one marker 59
Number of supercontigs that could be orientated 40
Table 2. Statistics for individual linkage groups of the E. siliculosus genetic linkage map.
Linkage group Length of linkage group (cM) Number of markers mapped Number of supercontigs mapped Average distance between two markers 1† 21.6 3 1 10.8 2* 169.9 18 18 10.0 3* 122.5 21 16 6.1 4* 95.4 14 10 7.3 5* 90.8 11 10 9.1 6* 83 14 11 6.4 7† 21.2 3 3 10.6 8* 75.4 11 9 7.5 9* 114.3 19 15 6.4 10* 47.7 11 8 4.8 11* 108.5 18 13 6.4 12* 67.6 9 7 8.5 13* 47 11 7 4.7 14* 102.5 14 11 7.9 15* 124.4 17 12 7.8 16* 128 25 20 5.3 17* 97.6 18 14 5.7 18* 63.4 19 12 3.5 19* 58.1 7 6 9.7 20† 22.0 6 5 4.4
21* 60.3 11 8 6.0 22* 53.8 7 5 9.0 23* 54.6 13 11 4.6 24* 59.7 10 10 6.6 25* 76.1 10 10 8.5 26* 135.6 22 18 6.5 27* 123.8 12 11 11.2 28† 8.7 5 4 2.2 29† 22.9 5 5 5.7 30* 95.4 20 17 5.0 31† 3.4 3 2 1.7 32† 1.8 3 2 0.9 33* 95.3 14 12 7.3 34† 7.0 2 2 7.0
All linkage groups
total 2459.3 406 325
mean 72.3 11.9 9.6
min 1.8 2 1
max 169.9 25 20
*26 longest linkage groups
total 2350.7 376 301
mean 90.4 14.5 11.6
min 47.0 7 5
max 169.9 25 20
†8 shortest linkage groups
total 108.6 30 24
mean 13.6 3.8 3.0
min 1.8 2 1
max 22.9 6 5
*Indicates the 26 longest linkage groups. †Indicates the eight shortest linkage groups.
Table 3. List of supercontigs that have been orientated on the genetic map. Linkage group Supercontig Orientation LG03 sctg_129 +* sctg_293 + LG04 sctg_6 - sctg_32 - LG05 sctg_268 - LG06 sctg_7 - sctg_214 - LG08 sctg_10 - sctg_23 - LG09 sctg_97 - sctg_27 + LG10 sctg_56 + LG11 sctg_25 + sctg_14 + LG12 sctg_16 - LG13 sctg_20 + sctg_199 + sctg_53 + LG14 sctg_171 - sctg_464 - sctg_303 + LG15 sctg_82 + sctg_24 - sctg_40 + LG16 sctg_62 - sctg_28 + sctg_86 + LG17 sctg_38 + sctg_29 - LG18 sctg_46 + sctg_327 - LG19 sctg_30 + LG20 sctg_122 + LG21 sctg_84 - LG22 sctg_98 - LG26 sctg_130 + LG28 sctg_244 + LG30 sctg_96 - sctg_105 - LG31 sctg_164 + LG33 sctg_121 + sctg_335 + sctg_425 - sctg_367 -
*Supercontig is orientated with the lowest LocusID numbers towards the top of the linkage group.
Table 4. Markers that showed distorted segregation. Marker Linkage group Ec 32 (male) Ec 568 (female) Parental allele over-represented M_000_8 1 19 35 Ec 568 M_008 2 22 38 Ec 568 M_131 11 19 41 Ec 568 M_155 11 21 38 Ec 568 M_086_1 16 15 28 Ec 568 M_136 16 20 37 Ec 568 M_065_3 21 38 22 Ec 32 M_179 21 38 22 Ec 32 M_368_2 21 38 21 Ec 32 M_019 25 39 20 Ec 32 M_178_3 25 38 22 Ec 32 M_103_2 27 38 22 Ec 32 M_035 33 38 22 Ec 32 M_054 33 40 17 Ec 32 M_121_2 33 43 12 Ec 32 M_121_3 33 42 18 Ec 32 M_240 33 41 18 Ec 32 M_328_1 33 41 19 Ec 32 M_343 33 43 16 Ec 32 M_425 33 41 19 Ec 32
Table 5. Markers that mutated during the establishment of the mapping population.
Marker Type 32M allele 568F allele mutant allele
M_467 tri 0 (16 repeats) 26 (15 repeats) 34 (14 repeats) M_030_4 di
31 (32
repeats) 8 (16 repeats) 20 (14 repeats) M_032_3 di 1 (35 repeats) 59 (36 repeats) (= 568F allele)
Table 6. List of genes that span two supercontigs, which were mapped next to each other on the genetic linkage map.
Linkage group
Upper supercontig (and gene locusID)
Lower supercontig (and gene locusID)
Map distance between the markers on the
two supercontigs Predicted gene function or protein domains present LG02 sctg_203 (Esi0203_0057) sctg_465 (Esi0465_0002) 0 Rad50 LG05 sctg_211 (Esi0211_0048) sctg_338 (Esi0338_0032) 0 Glycosyl transferase, family 48 LG07 sctg_198 (Esi0198_0003) sctg_403 (Esi0403_0027) 0 Acetyl-CoA carboxylase LG08 sctg_406 (Esi0406_0025) sctg_203 (Esi0238_0001) 0 Di-copper centre-containing domains (IPR008922) LG13 sctg_303 (Esi0303_0037) sctg_464 (Esi0464_0017) 7.2 tRNA pseudouridine synthase LG30 sctg_560 (Esi0560_0001) sctg_357
(Esi0357_0001) 0 Ubiquitin-protein ligase LG33
sctg_335 (Esi0335_0025)
sctg_425
(Esi0425_0023) 9.1
Radical SAM domain (IPR002792)
Supplementary table S1. Numbers of polymorphic and monomorphic bands detected with different primer combinations in the AFLP analysis of the two parental strains.
EcoRI primers MseI primers monomorphic polymorphic Es 32 polymorphic Es 568
EcoRI + AAA MseI + CAT 10 3 9
MseI + CAG 23 10 11 MseI + CAC 12 3 5 MseI + CTA 23 6 26 MseI + CTT 6 0 2 MseI + CTG 6 0 4 MseI + CGC 11 2 9
EcoRI + AAT MseI + CAT 12 7 3
MseI + CAG 19 1 4 MseI + CAC 17 2 7 MseI + CTA 6 1 1 MseI + CTT 11 1 7 MseI + CTG 15 0 6 MseI + CGC 20 2 13
EcoRI + ATA MseI + CAT 5 2 2
MseI + CAC 13 7 10
MseI + CTA 10 0 6
MseI + CTT 18 6 3
MseI + CTG 17 1 5
MseI + CGC 14 1 4
EcoRI + ATT MseI + CAT 9 1 5
MseI + CAG 6 1 0 MseI + CAC 15 1 0 MseI + CTA 21 2 16 MseI + CTT 16 9 11 MseI + CTG 8 2 8 MseI + CGC 9 2 1
MseI + CAC 8 2 8
MseI + CTA 2 0 2
MseI + CTT 40 7 18
MseI + CTG 32 6 6
EcoRI + ACA MseI + CAG 3 2 7
MseI + CAC 14 1 5
MseI + CTA 15 8 3
MseI + CTT 11 2 3
MseI + CTG 7 1 4
MseI + CGC 7 1 3
EcoRI + ACG MseI + CAT 7 0 2
MseI + CAG 12 6 5 MseI + CAC 14 1 2 MseI + CTA 27 2 9 MseI + CTT 1 1 2 MseI + CTG 14 1 4 MseI + CGC 7 0 6
EcoRI + AGT MseI + CAT 14 3 5
MseI + CAC 16 3 9 MseI + CTA 58 18 12 MseI + CTT 17 3 6 MseI + CTG 15 4 5 MseI + CGC 2 24 9 Total 703 170 313
Supplementary table S2. Information about the SSR markers. (see separate file)
Supplementary table S3. Results of the genotyping for the segregating population. (see separate file)
Figures
Fig. 1. Genetic linkage map of E. siliculosus. The map consists of 34 linkage groups. The positions of SSR markers are indicated to the right of each linkage group, with the prefix "M" for marker followed by the number of the supercontig that contains the SSR and finally, in some cases, a suffix to distinguish markers that originated from the same supercontig. Numbers to the left indicate the map distances, in cM, between the intervals given by the lines that cross the vertical bar. The cumulative distance between all the markers mapped to each linkage group is given in brackets. The 24 markers that exhibited segregation distortion are shown in bold. Note the cluster of eight of these markers on linkage group 33.