What is the impact of Private Equity Funds on the
LBO value creation?
Financial theory and Legrand case study analysis
François GRIMAUD
HEC Paris student - Master in International Finance
Patrick Legland
HEC Professor - Thesis supervisor June 2015
Abstract
This paper studies the role of Private Equity funds in LBO value creation. Our approach begins with a literature review, addressing how the Private Equity sponsors can intervene in the management and the financial optimization of their target. Then we propose a quantitative framework to measure the value creation in a LBO development, for the different stakeholders. We observe the importance of approaching the value creation through a multi-criteria analysis, taking into account the temporal aspect and a peers control sample for the company. We finally apply this framework to the Legrand case study, a French manufacturer of electrical products, acquired in 2002 by Wendel and KKR. For this case study, we conclude that value has been created for both the firm, the shareholders and the debtholders, notably thanks to an active and long-term involvement of the sponsor and the managers.
Acknowledgments
I sincerely thank Mr Patrick Legland for his valuable and active help throughout my research project. Not only has his reactivity always been highly appreciable, but also his willingness to make my work enjoyable and particularly instructive.
Table of contents
Introduction ... 4
Part I. The sources of value creation in LBOs: how can Private Equity funds intervene in their target to create value? ... 5
I.1. The LBO governance and the "discipline effect of the debt" ... 5
I.2. Operational & financial engineering ... 7
I.2.1. Operational engineering ... 7
I.2.2. Financial engineering ... 10
I.3. Market mispricing, cyclicality and negotiation capabilities? ... 11
I.4. Potential conflict of interests between the Private Equity fund and the company objectives ... 11
I.4.1. The leverage effect: the fund incentivized for risk shifting? ... 12
I.4.2. The timing horizon issue, the liquidity needs and the strong cash flows focus ... 13
I.4.3. The remaining agency costs ... 14
Part II. Measuring the value creation in LBOs for the different stakeholders ... 17
II.1. The firm ... 17
II.1.1. The total value creation at the firm’s level: ROCE - WACC ... 17
II.1.2. The underlying operating improvement for the firm ... 19
II.2. The shareholders ... 21
II.2.1. The total value creation at the fund’s level: ROE - COE ... 21
II.2.2. Two additional indicators: the IRR and Cash-on-Cash multiples ... 21
II.2.3.Methodologies to decompose the IRR ... 22
II.2.3. Digging into the value creation at the fund's level: the drivers of the ROE improvement ... 24
II.3. The debtholders: ROD - COD ... 25
II.4. Measuring the risk of the firm ... 25
Part III. The Legrand case study ... 28
III.1. Preliminary and pre-LBO analysis ... 28
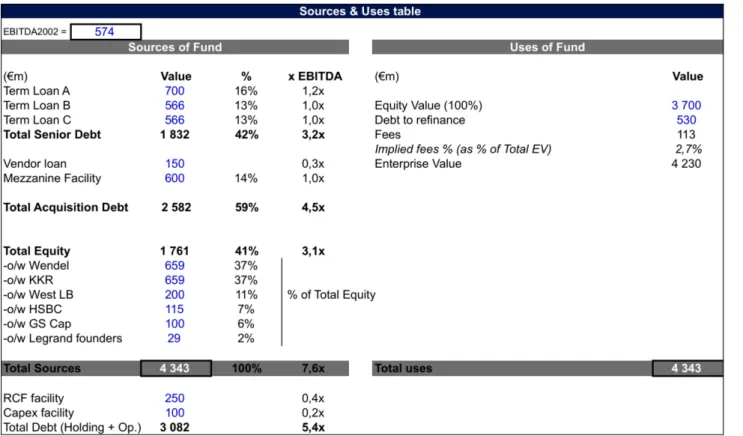
III.2. The delisting and the acquisition by Wendel and KKR (Dec-2002) ... 33
III.3. The overall value creation during the LBO period (2003-2006) ... 37
III.4. Digging into the value creation drivers ... 44
III.5. Analysis of the risk of the company ... 52
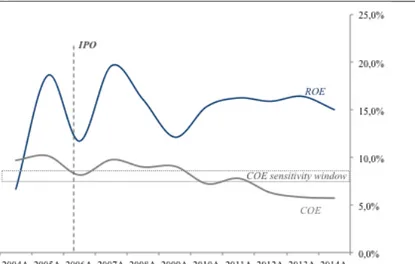
III.6. The IPO and the progressive exit by the consortium ... 54
III.7. Governance ... 64
Conclusion ... 67
References ... 69
Introduction
In the aftermath of the 2007 world financial crisis, numerous financial models have been questioned and criticized about their opaqueness and resulting excessive risk-taking specifications. Over the last decade, French LBOs have notably been subject to vehement criticism about the true purposes of their financial engineering and a value creation that would be only dedicated to the sponsor, at the expense of the company itself and its employees. As such, the flourishing literature review is in our view divided in two categories: papers qualitatively studying the drivers of LBO value creation (such as, as a reference, Kaplan (1989/2008)) and papers questioning, often by statistical analysis, whether Private Equity sponsors, from a general point of view, contribute or not to value creation (Thesmar (2011)). Our approach will be slightly different: admittedly, the first purpose of this paper is to investigate about the drivers, explaining how the Private Equity sponsors can intervene in their target and create value. This will be the point of the first section of this paper. But above all, this paper aims at addressing the three following issues, in the second section: (i) how to measure and to have a comprehensive analysis of value creation for each different stakeholder of the firm?; (ii) for whom does a LBO development create value and in which extent?; (iii) what are the sources of conflict between the different stakeholders? After having proposed a framework analysis, to approach the value creation, we will apply this framework to the Legrand case study, a French manufacturer of electrical products, acquired in 2002 by Wendel and KKR, and relisted from 2006. This case study approach is in our view crucial to validate, from a practical point of view, the analysis developed in the first two parts. As such, we will face interesting practical difficulties, supporting the fact that measuring the value creation in a LBO development is not straightforward.
Hence, despite the two first comprehensive theoretical sections, it is important for us to have also bottom-up approach, our case study analysis having significantly helped to build the theoretical framework analysis.
Eventually, we choose not to discuss in this paper about the basic definitions and general presentation of an LBO acquisition and its players. We believe many theoretical books (and much more didactic) are devoted to this purpose.
Part I. The sources of value creation in LBOs: how can Private Equity funds intervene in their target to create value?
The first part of this paper aims at identifying and analysing, from a qualitative point of view, the main drivers of value creation that can be employed by Private Equity funds in LBO acquisitions. While the common thinking, when speaking about LBO value creation comes up with the classical three levels of value creation for the Internal Rate of Return – IRR ([i] pricing multiple, [ii] operational improvement and [iii] use of financial leverage), we prefer in this part to adopt Kaplan & Strömberg value drivers classification: we will therefore study the changes in governance on one side, and the contribution in terms of operational and financial engineering, on the other hand. It enables us to look at the value creation for the entire firm, and not only from the shareholder point of view (when looking only at the IRR). After the analyse of those value creation drivers, as being, either financial changes, governance improvement or operational engineering, we will then focus on the sources of potential conflict between the PE fund and its target objectives in terms of value creation.
I.1. The LBO governance and the "discipline effect of the debt"
First of all, an LBO acquisition is always accompanied by a drastic change in its governance structure. The new installed governance mode is characterized by three drivers: a significant portion of debt put in the capital structure; a management that usually has personal investment in the company under LBO; and, a specific involvement of the PE sponsor in the day-to-day management of the LBO company.
The significant indebtedness of the LBO target is a first and crucial key component in the value creation. Kaplan (2008) explains that "leverage creates pressure on managers not to waste money, because they must make interest and principal payments." Vernimmen authors speak about a "carrot and stick policy", the stick designing a high debt level that put bankruptcy pressure on the management, who will try to generate a maximum of cash flows. Therefore, analysing the value creation in an LBO requires looking in detail at the cash-flow generation of the firm, and the sources of potential changes (improvement of sales, gross margin, administrative costs, working capital improvements).
The "carrot" designs a system in which the management has usually a significant interest in the sharing of the profit of the holding company, aligning the interests of the managers with those of the PE investors. As mentioned by Kaplan (2008), not only does the management has "a significant upside, but also a downside", due to direct individual
investment in the firm and on top of traditional stock options granted by the company. As such, referring to a survey conducted by Accuracy in 2008 towards French CEOs (listed and non-listed companies), Peter Harbula (2008) underlines that 98% of the CEOs believe that PE sponsors know better than industrials how to motivate and remunerate the managers, and most importantly, how to set up an efficient governance system.
The third governance tool used by PE funds is a closer accompaniment of the company, in terms of day-to-day management. As such, we can distinguish between two types of behaviour employed by the fund: either a fund can be deeply involved in the target management, or it can choose to be less participative and only present during the key transaction phases (entry, exit and key decisions in-between for the company): co-investors will typically that kind of management posture. Be it a light accompaniment model or, on the contrary, a very close and day-to-day backing of the company, there is no denying that the LBO structure supposes a closer involvement by the fund in the target management, compared with traditional shareholding. This allows both an advisory activity and a strong surveillance tool for deeply involved shareholders, reducing the usual information asymmetry. The advisory work of the fund will be further discussed in the operational engineering sub-part of this section (I.3.). Meanwhile, we will keep in mind, for our case study analysis, to look at the way the fund decides to manage its participation, and in particular, to take care about the weight of the participation in the overall funds portfolio.
Such changes in the governance mode can be viewed as a remedy to the traditional agency costs issue that arises from a classic capital structure. Thus, increasing the debt level and involving deeply the shareholders in the management help the company to reduce the agency costs: first, and already discussed, between the shareholders and the management (alignment of interests thanks to both incentives and a more efficient governance tool), and, second, between the debtholders and the management. Indeed, not only are the bank debtholders now the owners of the company (as being structurally placed shareholders at the holding level), but the high proportion of the debt and the resulting new covenant structure of a LBO lead to a closer monitoring by banks (e.g. more frequent and accurate reporting), helping to reduce the agency costs between the debtholders and the management. Four types of agency costs are explained by Herst & Hommelberg (2003): the contracting costs (arising from drawing up the contracts to align interests between shareholders and management), the monitoring costs (arising from supervising the management of the company by the shareholders), the bonding costs (arising from the efforts made by the management to convince their shareholders they act in their interest). The residual losses are the fourth cost
category, explained by all the other decisions taken by the management, not in line with the interest of the shareholders. LBO structures help to reduce the principal-agent problem between the shareholders and the agent. The example taken by the authors is the management of the cash flows, which has to be well supervised in LBOs, since the fund remuneration only comes from the cash-flow generation of the company. Hence the managers have to be well incentivized to invest in only positive NPV projects and to return the cash in all other cases.
The consequence of such a new type of governance is the important choice of the management team, that not only has to know how to deal with a "carrot and stick policy", but who must also be able to manage the company, from an operational point of view, must be cash-oriented and finally, that can afford to be individually involved in the company investments and returns. There is no denying that a highly motivated management team is therefore necessary, but it does not seem that the management is necessarily a new one, as we will see in the case study. Still, Acharya and Kehoe (2009) reported that one third of the CEOs in a LBO was replaced within the first 100 days, and two thirds within a 4-year period. As a consequence, in our case study analysis, as part of value creation analyse, it will be primordial to look at the management structure and its evolution over the LBO period.
As a conclusion about the governance value drivers in LBOs, one can mention the importance of the covenant structure, which we consider as the final agreement for the entire firm governance scheme, aiming at managing the rules between the firm and its stakeholders. Interestingly, Chen LIU (2013) reported that tighter covenants increase the firm's value. The paper also explains that the recent poor performance observed in LBOs (since 2007) is partly the result of less restrictive covenants, as opposed to recent covenant-lite structure.
I.2. Operational & financial engineering
We group in this section two other drivers used by PE sponsors, to increase their target value. While operating engineering refers most specifically to the management of capital employed (Fixed Assets + WCR), the financial engineering refers to the added value that a fund can bring in providing, optimizing and managing the invested capital (improving the capital structure, providing liquidity, financing or enabling the company to access to Debt and Equity Capital Markets).
I.2.1. Operational engineering
on the question whether LBO contribute to operating improvement at the firm level. Kaplan (2008) concludes positively to this question, showing for example that for LBOs in the 1980s, ratios of operating income to sales improved between 10 and 20%. He also shows that cash-flow ratios increase by c.40% in average for LBOs, and overall there is a significant increase in the firm value for LBO. For more recent and French LBOs, Thesmar (2011) concludes about a significant operating improvement, proving for French SME LBOs that they "have experienced very strong growth in sales, assets and employment, after the deal, in particular when they were previously more likely to be credit constrained." On the contrary, Guo and al (2007) found no significant increase in operating improvement, but only an increase in investor returns, for US Public-to-Private LBO transactions over the 1990-2006 period. Having a pragmatic and case study approach in this paper, we will try to investigate about all the drivers that help PE funds to increase the operational performance of their target. Basically, the operating improvement is done through: (i) the top line growth; (ii) the improvement of the cost structure and the margins, that has to translate into cash in the specific case of a LBO; and (iii) the improvement in the management of Capital Expenditures (Capex) and Working Capital Requirements (WCR).
First, the top line improvement can be conducted either internally or externally. The PE fund expertise will be helpful for the company on two key sides: first, the company will benefit from advices of the investment team (that often includes ex-consultants from advisory firms) to improve its top-line, be it internally or externally. Second, growing externally will be facilitated by both the extensive network of the PE firm (industrial coverage provided by the PE sponsor), but also easier access to financing and liquidity for potential acquisitions (thanks to the banking connections of the PE firm), and potential combinations with existing companies of the PE fund portfolio. Indeed the build-up strategy has been a recent trend since 2008, in response to reluctant financial markets, post crisis, and viewed as a new way to create long-term value, compete with industrial acquirers, and combine financial and industrial expertise, as underlined by Emmanuel Harle (2011).
The intervention of the fund can also be done via an improvement in the cost structure, be it at the gross margin level, the EBITDA improvement (SG&A, personnel costs, etc.) and the optimization in taxes and financial interests to pay. Here as well, it is interesting to notice that the build-up strategy appears as a good tool for the cost improvement strategy led by the fund: not only does it enable to gain on cost synergies by combining two participation of the same PE fund, but you can also increase the negotiation capabilities with the suppliers, as
mentioned by Arthur Millard (2014). It will therefore be important for us to deeply investigate at which level the fund tries to improve the cost structure of the company under LBO, and what are the consequences in terms of value creation, for both the company and the fund. But, we have to keep in mind that, because the fund is interested in the cash-flows transfer from the target to the holding company, it will only focus and prioritize the cost-cuttings that can directly be translated into cash-flow generation improvement.
Eventually, the operating improvement may also be achieved via the improvement in the use of capital employed: the Capex expenses and the optimization of the WCR needs. When evaluating the impact of LBO on operating performance (48 LBOs for the 1980-86 period), Kaplan (1989a) found a decrease of 26% in the Capex-to-sales ratio, during the LBO period. Indeed, it seems straightforward that the fund will focus on reducing useless Capex expenses, by first excluding the Capex of non-positive NPV projects, and second delaying the Capex needs after the fund exit date. This last point can be the source of potential value destruction and will be further discussed in the next section (I.4.). The WCR improvement is also a standard and well-known leverage that funds can use to improve their target operating performance, and is particularly interesting in a LBO situation, since it concerns directly the management of cash flows. Many levers can be activated for the WCR improvement: optimization of reporting systems, improvement of inventory turnover days, account payables/receivable turnover ratios, not withstanding the fact that banks and PE also provide tailored financing solutions for the WCR needs (RCF facilities). Again, a build-up strategy turns also to be a relevant way to improve the WCR needs of the companies under LBO, with for example the use of cash-pooling systems, as described by Arthur Millard (2014).
On top of all the previous operational improvement opportunities for the PE fund, we want to mention, at last, an additional lever, as much important as than the others, but undoubtedly far more difficult to capture and analyse on a stand alone basis: the fund can significantly help the company to enhance its visibility and reputation, towards both its suppliers, customers and fund providers. It can comes from both the access to the network of the PE sponsor (be it at a financial or operational network level), a developed marketing strategy or the simple benefit for the company to be accompanied by a well-know PE fund (more credit vis-à-vis the suppliers or the customers). Although it can be materialized by the goodwill part when selling the company at the LBO exit, we still think this added value may be difficult to extract from the pricing or negotiation capabilities of the fund at the time of the exit and the market conditions, that undeniably play a crucial role in the entry/exit prices.
I.2.2. Financial engineering
In this section, we design by financial engineering, all the possible levers the fund can employ at a financial level only: the leverage effect (and resulting tax shield), the access to financing and liquidities for the company, and the optimization of the capital structure or cost of capital. On the leverage effect (i.e. benefit from the tax shield), it seems largely agreed in the literature that the tax incentives in LBOs must not be underestimated, but that they are not the strongest driver of LBOs, as argued by Lowenstein (1985). Kaplan & Stromberg (2008) found that the tax shield has decreased when comparing the LBOs of the 1980s period with the more recent ones, due to a decline in leverage used. Still, they argue it should account for a 10-20% to the total firm value. Indeed, Vernimmen authors precise that leverage effect benefits are reduced by the bankruptcy costs (increasing with the leverage), and therefore that savings from tax gains are not enough to explain the success of LBOs. Therefore, both from the fund and the firm perspective, the use of leverage is at some point threatened by the risk of bankruptcy: Nikoskelainen et Wright (2005) conclude that the leverage level is not linearly correlated with the value creation (at the fund level), explaining that the IRR is lowered for LBOs too much levered. It is therefore of prime importance for us to analyse the leverage of the company for our case study, as compared to the industry average and to measure the contribution of leverage to the total IRR at the fund level.
More interestingly and less obvious, the financial help brought by the fund is not limited to the computation and definition of an optimal debt level: the fund is, first and foremost, a capital provider and a financial advisor. It helps designing and contributes to provide often tailored financing solutions, specifically adapted to LBO needs: RCF facilities and Capex lines, multi-tranches debts, access to liquidity through the fund bank network, additional funds to inject during the LBO life (if necessary with an ambitious external growth strategy for example...). As such, Thesmar (2011), studying a sample of 830 French LBO deals, concluded that LBOs serve as "substitute for weak capital markets", by alleviating capital constraints in France. We can therefore notice that the LBO structure enable the company to access new and other financing and capital markets, especially where the traditional financial markets are not efficient, like in France over the last couple of years, noticed by Thesmar. In our case study analysis, it will thus be interesting to look in detail at the financing structure (equity, hybrid and debt-related products) of the LBOs, and to understand such financial solutions brought by the funds, in view of the strategic/operational needs of the company.
I.3. Market mispricing, cyclicality and negotiation capabilities?
The following part deals with another prime driver helping the funds to generate returns through LBO acquisitions: the gain generated from the acquisition at a low price and the sale at a higher price, independently from the operational improvement contribution (that typically also contribute to sell at a higher multiple) and from the contribution of the leverage effect. In our view, it comes from 2 distinct drivers: (i) the fund abilities to identify mispricing opportunities and to take advantage, or on the contrary, to suffer from the market environment, and; (ii) the negotiation capabilities of the fund to buy low and sell high (especially if the exit is an IPO or a sale to an industrial). On the specific SBO segment, Bonini (2010) and Wang (2010) both come to the conclusion that one of the main drivers for SBOs turns out to be the favourable financing and market conditions, i.e. the low cost of debt, strong appetite from the equity capital market, and the need for the seller to get cash back. As such, the Legrand case will be a good illustration of that, since the funds managed to buy the company at a significant discount, following the merger refusal by anti-trust authorities. From a more general point of view, Kaplan & Strömberg (2008) conclude that PE investors are "taking advantage of market timing (and market mispricing) between debt and equity markets particularly in the public-to-private transactions of the last 15 years." As part of those market mispricing opportunities, we can also add one other LBO driving reason and explained by Brealey & Myers (2003): the fact that LBOs can be a financial response to the conglomerate discounts.
I.4. Potential conflict of interests between the Private Equity fund and the company objectives
While the literature is flourishing in exploring the drivers for value creation, described previously, it turns out to be more difficult to find the sources for potential conflict of interests between the fund and the LBO target's objectives. As part of the analysis of the value creation (and also destruction), it is important in our view to spend a section identifying and analysing all the divergence between the goals of company and the fund. It will help us in particular to answer the question: for who does a LBO deal create value? The company? The fund? Both? We have identified 3 categories of theoretical potential conflicts, between funds and LBO targets: (i) The leverage effect, boosting the ROE, from the ROCE, but at the expense of an increased risk for the company; (ii) The time horizon of the investments that can be significantly shorter than the necessary horizon for the firm's strategic decisions,
combined with the cash-flow generation objective of the PE fund, sometimes in contradiction with long term objectives of the firm; (iii) The agency costs remaining issues.
I.4.1. The leverage effect: the fund incentivized for risk shifting?
As already mentioned in a previous section (I.2.), the leverage effect is used by PE funds to boost their Return On Equity (ROE), at the expense of the increased financial risk of the company. As such, the leverage effect formula shows how you can artificially boost the ROE through increased financial debt, despite a constant Return on Capital Employed (ROCE), providing that the ROCE remains above the cost of debt after taxes:
𝑅𝑂𝐸 = 𝑅𝑂𝐶𝐸 +𝐷
𝐸 × (𝑅𝑂𝐶𝐸 − 𝑐𝑜𝑠𝑡 𝑜𝑓 𝑑𝑒𝑏𝑡 𝑎𝑓𝑡𝑒𝑟 𝑡𝑎𝑥𝑒𝑠)
Nevertheless, other key factors have to be taken into account when considering the leverage. First, even at the fund level, there is no interest in increasing the leverage too much: undeniably, the fund also bears the increased risk of financial distress induced by more leverage. The reputation of the PE fund is also another argument, preventing the fund from adopting a position of a too risky shareholder. All the more so that the fund works in close relationship with its network of banks for the financing of the deal, that will not accept a too high leverage. The structure of the shareholder loans, provided by the funds (despite their first and main objective to allow cash access for the shareholders without having to wait for dividends) enables to align the interest of the shareholders and debtholders, and prevent the funds to take too much risk. A key question is therefore: does the chosen leverage really maximize the value of the firm, by choosing a leverage in line with a minimum WACC, or on the contrary, is the chosen leverage significantly higher than the optimal one, so that the PE fund can maximize its ROE, and eventually its IRR? Indeed, it is very difficult to precisely answer this question, as knowing the optimal WACC level (or equivalently the optimal indebtedness level) is almost impossible. All the more so that, as we have seen in the previous section, the virtue of the debt in a LBO deal is far more than boosting ROE, but has a major role in being a motivation tool and “stick” for the management of the target. Still, in our case study, it will be interesting to evaluate the leverage of the LBO, compare it to sectorial benchmark levels, and analyse the IRR part explained by this leverage booster.
I.4.2. The timing horizon issue, the liquidity needs and the strong cash flows focus
Because most of the PE funds have limited investment time horizon, and with the LBO investment periods that have become shorter and shorter in the recent years (due to more secondary buy-outs, as explained by Kaplan (2008)), usually the funds keep their participation during a three to five years period. There no denying that the "strategic horizon" for a company depends on many factors (sector, maturity of the company in its sector, strategy of the company itself...), and therefore it is difficult to come up with an accurate and optimal timing horizon for the accompaniment of the firm by the fund, which should be done case by case. Meanwhile, recent critics about Private Equity have argued that the funds are being too much focused on short term returns and should, on the contrary, extend their detention period to a sustained time, adapted to the strategic and long term needs of the target, as underlined by Sousa (2010). There are two main reasons explaining why the funds tend to have short-term investment periods: their liquidity needs (they have to return cash to their investors) and their return that turn out to be better for short-term deals. As such, Lloyd (1997) emphasizes that "on averaged, buy-out firms performed better over the medium term (up to three years), but over the longer term (four to seven years) financial performance is worse than the industry average”.
In addition to the pure liquidity needs at the exit of the investment, the funds are also strongly focused on cash flow generation by firm. In many cases, improving the cash-flow generation of the company can be in line with the company's profitability improvement objective and therefore create value for both the fund and the company: e.g. improving the WCR, negotiating better raw-material conditions with suppliers, improving the supply chain with a build-up strategy, reducing the fixed and administrative costs, etc. But looking only at the cash-flow generation level can hamper the long-term company's profitability, especially when you consider the recent short investment periods of the PE funds. The big threat is to temporary reduce the asset base (e.g. Capex, R&D, WCR), non necessarily crucial for the short-term sustainability of the company but still key for the long-term profitability and competitiveness of the firm. Kaplan (1989) found that the ratio of cash- lows to sales increase by c.40%, while the ratio of Capex to sales decline, for US public to private deals in the 1980s. On the contrary, Thesmar (2011) statistically proved, on his French LBO sample (1994-2004), that the underlying asset growth was positive, equals to 11%.
Eventually, although it is more related to social value (rather than purely financial value), we can ask ourselves whether the LBO contribute to employment growth or, on the
contrary, results in workforce destruction. In the UK, from 1999 to 2004, Wright (2007) finds that LBO experience employment growth (similar vs. industry average) but slower wage growth. In France, over the 1994-2004 period, Thesmar (2011) finds an excess job growth of roughly 13% for LBO companies vs. peers (both employment and wage excess growth). Overall, as concluded by Kaplan & Strömberg (2008), those findings "are not consistent with concerns over job destruction, but neither are they consistent with the opposite position that firms owned by private industry experience especially strong employment growth (except, perhaps, in France)."
Be it to address the timing horizon, the cash-flow focus or the employment issues, it will be important in our case study, to evaluate the post-buyout performance (in particular for the ROCE evolution), so as to assess if the intervention of the PE fund is temporary or more long term oriented.
I.4.3. The remaining agency costs
We have discussed in the previous section about the positive implication of the debt to reduce the agency costs, i.e. align interests between the shareholders, the managers and the debtholders. However, as emphasized by Herst & Hommelberg (2003), the MBO (and more generally the LBO) may result in other agency costs, between employees and managers. Surely the managers have more aligned interests with the shareholders, but the employees have to be all the more convinced by the management to work accordingly to the LBO objective, not an easy thing especially if they do not have any potential upside (participation scheme for the employees) and are not used to work under pressure.
As a summary of this first section, we have seen the importance of a new governance mode induced by the high financial leverage inherent to LBO structures: the new debt on the one hand, and the participation given to the management, helping to reduce the agency costs thanks to “a carrot and stick policy”. The operational and financial engineering brought by the PE sponsor are two other important levers in the value creation of LBOs, resulting in the optimization of the financial management (capital structure, access to tailored financial products) and the improvement of the profitability of the firm. In the last sub-section, we have also identified reasons why objectives for the PE firm and the company may differ. First, the leverage effect that can excessively and only serves at boosting the ROE, at the expense of a higher risk. Second, the divergence in both the timing horizon and the cash flow focus, that
arises between the PE firm and the company itself. Finally, the risk of translating the agency costs to employees-managers, rather than managers-shareholders.
To conclude this part, we choose to reproduce1 the results of a study extracted from an article published by Peter Harbula (2008), summarizing the different sources of value creation and their rank of importance for European LBO transactions from 2000-2008, with a specific focus on 2005-2007 transactions. We conclude that, overall, the most important drivers appear to be the free cash flow effect induced by a discipline effect of the debt, the alignment of interests with the managers, the under-valuation of the target at the acquisition date and, to a slightly lesser extent, a closer monitoring and the operational improvement. During the 2005-2007 period, the drivers seem to move to a better WCR and Capex management, and a favourable market environment, allowing to sell at a higher price at exit. Eventually, for IPO exits in particular, the value creation is then mainly explained by an operating improvement and a successful build-up strategy.
Figure 1: Value creation drivers for LBO transactions between 2000 and 2008
Source: Peter Harbula (2008)
1 Extracted and translated from "Fonds d’investissement : bulle financière ? Leviers de création de valeur, endettement et
gouvernement d’entreprise", by Peter Harbula (2008)
As a second conclusion of this first section, and since we can not spend another whole section reviewing in details those criteria, the following diagram summarizes the key criteria to assess the quality of a future LBO company. We have decided to structure it into four different categories: the company itself, the industrial market in which the company evolves, the governance quality and the influence of other external financial factors. Not exhaustive, this chart is a summary of different paper of our bibliography, and can be completed on a case-by-case basis. It will help us in our case study analysis, when assessing about the quality of our LBO case study
Figure 2: Assessing the candidacy of a LBO company
Part II. Measuring the value creation in LBOs for the different stakeholders
In the previous section, we focused on reviewing the driver sources for LBO value creation. The following part will be devoted to set up a measuring toolbox, in order to answer one of the main issue raised in this paper: how can we measure, and quantify as much as possible, the value creation in LBO deals for the different stakeholders involved? Consequently we will divide our analysis into three distinct parts, evaluating the value creation for the firm on its whole first; then for the shareholders, i.e. the PE sponsor; and will try at the end to address the measure of value creation at the debt holding level. For each level, we will remind how one can define the financial value creation, and which metrics can be used to approach at best the value created for the different parties. The goal is to define a practical analysis framework, present in detail the metrics that will be further used in the case study, their advantages and limits.
There is no denying that there is no perfect metric to capture accurately the value creation. That is why our approach will be, as much as possible, to explore different measures and come up with a multi-criteria analysis, rather than electing only one way of measuring the value created for a LBO deal.
II.1. The firm
II.1.1. The total value creation at the firm’s level: ROCE - WACC
At the entire firm level, the total value created is defined by the spread between the Return on Capital Employed (ROCE) and the cost of capital (WACC) for the company. Basic finance rules tell that the firm only creates value when its return on invested capital is greater than its cost of capital, and destroy value otherwise. Hence, such a definition for the value creation at the company level. We choose to measure this spread by computing the ROCE and the WACC with:
𝑅𝑂𝐶𝐸 = 𝑁𝑂𝑃𝐴𝑇 𝐶𝑎𝑝𝑖𝑡𝑎𝑙 𝐸𝑚𝑝𝑙𝑜𝑦𝑒𝑑 (𝐹𝑖𝑥𝑒𝑑 𝐴𝑠𝑠𝑒𝑡𝑠 + 𝑊𝐶𝑅) 𝑊𝐴𝐶𝐶 = 𝑘! 𝐸 𝐷 + 𝐸 + 𝑘! 1 − 𝑡 𝐷 𝐷 + 𝐸
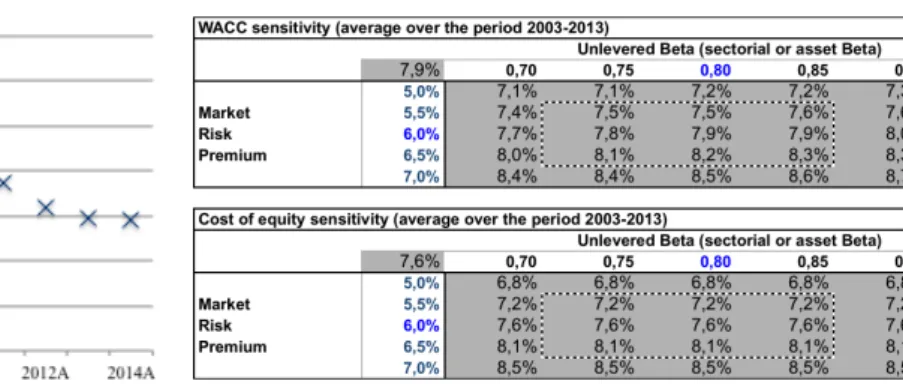
- 𝑘! is the cost of equity, estimated with the CAPM model: 𝑘! = 𝑟! + 𝛽(𝑟!− 𝑟!), with the Equity Risk Premium (𝑟!− 𝑟!) calculated for our case study as the difference between the CAC40 return and the risk-free rate (𝑟!), since our company is part of this index. The 𝑟! is estimated by the interest rate of the French government bonds, with a maturity closer to the duration of the LBO (5-y bonds will be preferred to 10-y bonds). A detailed discussion about the way we try to estimate the 𝛽 in our case study will be provided in the section II.4.
- 𝑘! is the cost of debt and will be taken as the effective net cost of debt, calculated for each year, post, over the entire LBO period. Another way of determining the cost of debt, ex-ante, would be to calculate it as the average of cost of debt, resulting from the debt package of the initial LBO, and accounting for the evolution of the cost of debt over the duration of the LBO (due to the debt amortization and debt restructuring). Unfortunately, the lack of public information about this cost of debt prevents us from having such an approach, which would be a good way to confront results.
- t is the effective tax rate owed by the company each year
- E and D are respectively the economic value of equity and of debt. Usually, because a LBO is a privately owned company, we are only able to have access to the nominal value of debt and equity. Nevertheless, we will detail in the precise situation of our case study, how to address this issue, and take into account proxy for market values.
In line with our multi-criteria analysis, and after having computed the WACC as explained before, it will be important nevertheless in our case study analysis to compare the WACC found with that of the listed peers, and if possible, with the WACC computed by equity brokers for the company, over a period as long as possible.
In our approach, we choose to measure the value creation at the firm level by the spread ROCE-WACC. Actually, when measuring the value created in a company, the literature often comes up with the EVA (Economic Value Added), with:
𝐸𝑉𝐴 = 𝑅𝑂𝐼𝐶 − 𝑊𝐴𝐶𝐶 . 𝐶𝑎𝑝𝑖𝑡𝑎𝑙 𝐸𝑚𝑝𝑙𝑜𝑦𝑒𝑑 and 𝑅𝑂𝐼𝐶 = !"#$%"& !"#$%&'(!"#$%
Evaluating the spread ROCE-WACC is obviously the same as computing the firm’s economic profit, by computing the EVA, the only difference lying in the choice to multiply or not by the Capital Employed.
We must remain careful about using the ROCE as a fully trustable value creation indicator: actually, as an accounting indicator, the ROCE can be artificially boosted. First, a decrease in the Capital Employed would mechanically result in an increase for the ROCE, that is not necessarily synonym of long-term value creation. As such, computing the evolution of the EVA for the company is a way to address this issue. Second, a decrease in the tax paid2 or a decrease in D&A would also result in the mechanical increase of the ROCE: we can not deny those two levers contribute to value creation at the firm level, but an accurate analysis requires to look at the post-buyout performance and see if those two levers are sustainable, i.e. if the value created is not only limited at the LBO period.
II.1.2. The underlying operating improvement for the firm
Computing the ROCE – WACC to assess the value creation at the firm’s level is necessary but not sufficient. Actually, the improvement of the ROCE may come from different drivers, which need to be analysed (pre-LBO level, during the detention period and post-buyout performance):
- First, as seen previously, we will particularly pay attention to the evolution of the Capital Employed. On the one hand, the Fixed Assets need to be analysed with the Capex evolution (as % of sales). Understanding the Capex policy of the company must also be done by looking at the external growth / acquisitions made by the company. Looking at the number of patents, as explained by Strömberg (2008), filed by a company would be an additional interesting way of investigating the Capex policy but is not necessarily adapted to all of the companies under LBO (especially when considering that LBO targets are typically cash-cows in mature markets…Hence, not prone to file many patents like typical R&D companies). On the other hand, as the second component of the Fixed Assets, we will monitor the WCR evolution: in
2 In our case study analysis, we will also take a normative tax rate, so that we can separate the tax effect in the
particular, we will look at the ratios of days of turnover, days of payables and receivables to see how the WCR needs of the company are managed and to evaluate the sustainability of such WCR-cuttings.
- Second, on the profitability side, i.e. looking more into details at the numerator of the ROCE, analysing the value creation requires to understand the evolution of the EBIT. Then, it will be interesting for us to separate the top-line effect from the cost-cutting improvements. On the top-line side, we propose to analyse the revenue growth (relatively to the sector, over the same period), and split it between internal growth and external growth. It allows us to have information about the degree of build-up strategy of the LBO. In our view, the cost improvement must also be split between the fixed costs and the variable costs. Here as well, it will be interesting to compare the EBITDA margin evolution of the company under LBO with its peers benchmark. Eventually, within the cost structure analysis, we will also pay attention to the employment (number of FTEs, as % of sales), to evaluate in what extent the cost-cutting does affect the employment, the total payroll or, on the contrary, if the LBO fosters employment and wage growth, as concluded by Thesmar (2011).
Overall, as it will be illustrated in the case study, we can decompose the ROCE improvement, between a EBIT effect and a Capital Employed effect, so that we may evaluate the contributions of those two drivers. Because the ROCE is a ratio, and we want to measure the contribution of the numerator on the one hand, and the denominator, on the other, we propose to use the logarithm function, and decompose it, as explained followed. Since the LN function is not linear, there is no denying that such a transformation will distort the initial contributions we want to measure, but this simple transformation can still give us a rough idea of how much the EBIT and the Capital Employed changes contribute relatively to each other. We notice that the Capital Employed contribution is mechanically negative as it represents the denominator of the ROCE (in the Figure 2, -25% contribution for a total change in the ROCE normalized at 100%):
Figure 3: LN(ROCE) decomposition - methodology
II.2. The shareholders
II.2.1. The total value creation at the fund’s level: ROE - COE
From a shareholder perspective, the fund creates value when its return on invested equity is greater than its cost of equity, and destroys value otherwise. Like we did for the firm, we choose here to measure the spread in return by computing the ROE (the Return on Equity at the firm level that will be a proxy for the return on equity invested by the fund) and the ke
(Cost of Equity, computed with the CAPM – defined in the previous section), with:
𝑅𝑂𝐸 = 𝑁𝑒𝑡 𝑃𝑟𝑜𝑓𝑖𝑡 𝐸𝑞𝑢𝑖𝑡𝑦
As already mentioned in a previous section (I.3.), it is important at this point to remind the leverage effect formula, showing the relation between the ROE and the ROCE: again, this formula shows how you can boost the ROE, by increasing financial debt, despite a constant Return on Capital Employed (ROCE), and considering that ROCE > cost of debt:
𝑅𝑂𝐸 = 𝑅𝑂𝐶𝐸 +𝐷
𝐸 × (𝑅𝑂𝐶𝐸 − 𝑐𝑜𝑠𝑡 𝑜𝑓 𝑑𝑒𝑏𝑡 𝑎𝑓𝑡𝑒𝑟 𝑡𝑎𝑥𝑒𝑠) II.2.2. Two additional indicators: the IRR and Cash-on-Cash multiples
An usual way to assess the attractiveness of an investment opportunity, or the performance of investment, ex-post, for a PE fund is by computing the Internal Rate of Return (IRR) and the Cash-on-Cash multiple (C/C). At the opposite of the ROE, which is an accounting ratio, those two metrics are cash flow focused: the IRR is the rate of return that equals the NPV of the total cash flows (inflows + outflows) to zero. The C/C multiple, that does not take into account the time-value of the investment simply evaluates the ratio of total inflows / outflows, from the fund perspective. For that reason, the C/C multiple cannot be retained as an indicator of value creation. The main reasons that exclude the IRR to be retained as an indicator of value creation, are: (i) the IRR may have different values and can result in conflicting results with the NPV criteria; (ii) the IRR does not take into account the cost of capital, and can not compare two projects with different durations; (iii) last but not least, the IRR implicitly assumes a unique discount rate for the project evaluated, which is not the case for a traditional LBO project: on the contrary, evaluating each year the spread (ROE
– COE) allows a time varying discount rate (consequently: time varying WACC, already discussed in the previous section). Nevertheless, as a supplementary criteria in our analysis, computing the IRR and the C/C multiple will be interesting for two reasons:
- Because they are widespread indicators and usually advertised by the fund or the bank, in any LBO deal. Therefore, finding an IRR significantly higher than the ROCE will suggest conflicting signals between the company’s value creation and the value creation at the fund level.
- Secondly, although we do not retain the IRR as a true value creation indicator, it is a good and easy way to analyse in detail the cash-flow generation by the PE fund. Therefore, the IRR decomposition can be helpful when understanding where the cash generation comes from.
II.2.3.Methodologies to decompose the IRR
Digging further into the analysis of the IRR, we choose two ways of decomposing the IRR: the "traditional method" and the "LN method". Both methods will be illustrated in our case study section.
The "traditional method":
This methodology is inspired by the method proposed by Engel (2012). We decompose the IRR into 3 factors: the leverage effect, the Free Cash Flow (FCF) effect, the EBITDA enhancement effect, and the EBITDA multiple effect:
- Leverage effect: it consists in separating the levered IRR and the unlevered IRR, as for any leveraged investment, according to the following formula (Acharya & Kehoe (2009)):
- FCF effect: it is measured by the adding all the FCF available for dividend payments and debt reimbursement. In our understanding, the sum of the FCF effect and the leverage effect must be equal to the so-called deleveraging of the "LN method".
- EBITDA effect: it measures the contribution to the IRR, due to the earning enhancement. It is measured by the change in EBITDA multiplied by the entry EBITDA multiple. The EBITDA effect can be split into a sales growth effect and a pure margin enhancement effect (see LN method).
IRRl
= IRRu+ (IRRu− rD) ×
D E
- Multiple effect: eventually, the multiple effect extracts the contribution of the EBITDA multiple increase (or decrease) in the total IRR. It is measured by the change in multiple multiplied by the entry EBITDA.
This multiple effect is partly referring to the section I.3., dealing with the ability of the fund (or, on the contrary difficulty…) to buy low and sell high its participation: it can be attributed to the market mispricing capabilities of the fund, favourable credit and market conditions (e.g. favourable demand at the exit time) or simply good negotiation capabilities for the fund. Nevertheless, the multiple effect is not only related to the previous factors, external to the firm. On the contrary, the fund capability of selling at a higher multiple than the entry multiple may be explained by numerous factors, inherent to the firm’s potential, such as an improved governance at the firm, better growth perspectives for the future, or a better recognition and reputation towards suppliers or customers (goodwill that could have been added by the fund, discussed in our section I). Therefore, in our view, the multiple effect is kind of a grey matter, encompassing many factors, that can be related to the firm’s growth perspectives, its reputation and quality of management or other external factors, not necessarily related to future or past value creation at the firm level. Nevertheless, one factor, contributing to the change in the multiple, can be monitored quite easily: the market multiple evolution. In fact, by looking at the competitors of the company, we can analyse the EV/EBITDA multiple of the sector, and its evolution over our LBO case study. It will then help us to extract from this multiple grey matter one specific factor that can be attributed to the market improvement or deterioration.
The "LN method":
Another way to decompose the IRR is proposed by Loos (2005)3: his “Value attribution” methodology is not so far from the approach we proposed to decompose the ROCE change and basically consists in splitting the logarithm of the capital gain between 4 factors: the deleveraging effect (or debt-repayment effect, but called by Loos (2005) the "leverage effect") the revenue effect, the margin effect and the multiple effect:
- Deleveraging effect: measured by the following ratio:
𝐶𝑎𝑝𝑖𝑡𝑎𝑙 𝑔𝑎𝑖𝑛 𝐸𝑉 − 𝑚𝑢𝑙𝑡𝑖𝑝𝑙𝑒 =
𝐶𝑎𝑠ℎ − 𝑒𝑥𝑖𝑡/𝐶𝑎𝑠ℎ − 𝑒𝑛𝑡𝑟𝑦 𝐸𝑉 − 𝑒𝑥𝑖𝑡/𝐸𝑉 − 𝑒𝑛𝑡𝑟𝑦
- Revenue effect: measured by the following ratio:
𝑆𝑎𝑙𝑒𝑠 − 𝑒𝑥𝑖𝑡 𝑆𝑎𝑙𝑒𝑠 − 𝑒𝑛𝑡𝑟𝑦
- Margin effect: measured by the following ratio:
𝐸𝐵𝐼𝑇𝐷𝐴 𝑚𝑎𝑟𝑔𝑖𝑛 − 𝑒𝑥𝑖𝑡 𝐸𝐵𝐼𝑇𝐷𝐴 𝑚𝑎𝑟𝑔𝑖𝑛 − 𝑒𝑛𝑡𝑟𝑦
- Multiple effect: measured by the following ratio:
𝐸𝐵𝐼𝑇𝐷𝐴 𝑚𝑢𝑙𝑡𝑖𝑝𝑙𝑒 − 𝑒𝑥𝑖𝑡 𝐸𝐵𝐼𝑇𝐷𝐴 𝑚𝑢𝑙𝑡𝑖𝑝𝑙𝑒 − 𝑒𝑛𝑡𝑟𝑦
The final IRR decomposition consists in computing the logarithm of the total (levered) capital gain and splitting it into the sum of the logarithm of the leverage effect, the revenue effect, the margin effect and the multiple effect.
II.2.3. Digging into the value creation at the fund's level: the drivers of the ROE improvement 𝑅𝑂𝐸 = 𝑁𝑒𝑡 𝑃𝑟𝑜𝑓𝑖𝑡 𝐸𝑞𝑢𝑖𝑡𝑦 = 𝑁𝑒𝑡 𝑃𝑟𝑜𝑓𝑖𝑡 𝑅𝑒𝑣𝑒𝑛𝑢𝑒𝑠 × 𝑅𝑒𝑣𝑒𝑛𝑢𝑒𝑠 𝑇𝑜𝑡𝑎𝑙 𝐴𝑠𝑠𝑒𝑡𝑠× 𝑇𝑜𝑡𝑎𝑙 𝐴𝑠𝑠𝑒𝑡𝑠 𝐸𝑞𝑢𝑖𝑡𝑦
The previous formula (DuPont formula) divides the ROE between 3 different parts, helping us to understand exactly where the value creation comes from:
- 𝑁𝑒𝑡 𝑝𝑟𝑜𝑓𝑖𝑡 / 𝑅𝑒𝑣𝑒𝑛𝑢𝑒𝑠 = net profit margin, measuring the operating efficiency. - 𝑅𝑒𝑣𝑒𝑛𝑢𝑒𝑠/ 𝑇𝑜𝑡𝑎𝑙 𝐴𝑠𝑠𝑒𝑡𝑠 = total asset turnover, measuring the asset use efficiency. - 𝑇𝑜𝑡𝑎𝑙 𝐴𝑠𝑠𝑒𝑡𝑠 / 𝐸𝑞𝑢𝑖𝑡𝑦 = equity multiplier, measuring the financial leverage.
Then, we can illustrate the ROE decomposition with the same method used in the ROCE decomposition, i.e. by relying on the logarithm function for studying the changes of each component. We notice that the leverage effect is expected to have a negative contribution, since it measures the deleveraging of the company over the LBO period. It is different from the leverage contribution we mentioned when previously analysing the IRR, that represents the part of the IRR, explained by the leverage. An illustration of this decomposition is given in the case study of this paper.
II.3. The debtholders: ROD - COD
Evaluating the valuation created at the debt level will be far more straightforward than for the two previous sections. Here as well, the value creation can be defined at the debt level by the difference between the return on the debt and the cost of debt, provided by the financiers of the deal.
First, the return on the debt (ROD) for the bank is actually equal to the cost of debt for the company, which is taken as the effective cost of gross debt, i.e. the financial expenses of the company over its gross debt.
Second, the cost of debt (COD) will be computed as the sum of the risk-free rate and the Credit Default Spread (CDS) of the sector of the company under LBO.
II.4. Measuring the risk of the firm
We will end up this section by discussing how to evaluate the risk of the target company. Undoubtedly, computing the spread (ROCE – WACC) of the company to assess its value creation appears for us to be only a partial view of the analysis, since we do not take into account the additional risk induced by the LBO structure. We propose a three-factor approach in evaluating the risk of a LBO: (i) the financial leverage; (ii) the operating leverage; (iii) the evaluation of the Beta of the company.
The first and direct consequence of a LBO is the increase in the financial leverage and the financial charges additional burden. Usual coverage ratios to monitor and analyse the leverage effect and sustainability of a LBO, in particular scrutinized by Leveraged Finance departments in investment banks are the following ones: (i) the Debt / Equity ratio; (ii) the Net Debt / EBITDA multiples (and Senior Debt / EBITDA multiples); (iii) the (EBITDA –
Capex) / Cash Interest ratio (iv) the DSCR ratio, i.e. the ratio of cash available for the debt service – principal, interests and lease payments. It is measured by:
𝐷𝑆𝐶𝑅 = 𝑁𝑒𝑡 𝑂𝑝𝑒𝑟𝑎𝑡𝑖𝑛𝑔 𝐼𝑛𝑐𝑜𝑚𝑒
𝐷𝑒𝑏𝑡 𝑃𝑟𝑖𝑛𝑐𝑖𝑝𝑎𝑙 + 𝐼𝑛𝑡𝑒𝑟𝑒𝑠𝑡𝑠 + 𝐿𝑒𝑎𝑠𝑒 𝑝𝑎𝑦𝑚𝑒𝑛𝑡𝑠
In our case study analysis, we will try to dig out those ratios as far as possible, when having sufficient financial data for it.
Nevertheless, analysing the risk of a LBO does not only encompass the financial risk, and it appears crucial for us not to forget the operating risk evaluation. We propose two simple and traditional ways to measure it: (i) first, by measuring the fixed charges over the total charges, which will be an indicator of how much the break-even point has been increased; (ii) another way of measuring the operational risk is by computing the Degree of Operating Leverage (DOL – Brigham (1995)), as given below:
𝐷𝑂𝐿 = % 𝑐ℎ𝑎𝑛𝑔𝑒 𝑖𝑛 𝐸𝐵𝐼𝑇 % 𝑐ℎ𝑎𝑛𝑔𝑒 𝑖𝑛 𝑆𝑎𝑙𝑒𝑠
It measures the effect of a given change in EBIT relatively to the Sales change. The higher the fixed costs are, the higher the DOL will be and then the riskier the company will be.
Eventually, to complete our LBO target risk assessment, we propose to compute both the unlevered Beta (i.e. asset Beta, or Beta of the company) and the levered Beta (i.e. Beta of the Equity). The first one can be obtained from the second thanks to the following formula (with the usual notations):
𝐵𝑒𝑡𝑎 !"#$%$&$' = 𝐵𝑒𝑡𝑎 !"#"$"% 1 + (1 – t) x 𝐷 𝐸
The equity Beta will be used to compute the cost of equity ke as described in the
section II.1. and the company Beta, as it reflects the asset volatility, will be used as one of our criteria when evaluating the risk of the company under LBO. Usually, it is inferred from a peers comparison analysis (average of quoted peers from which we will extract the unlevered Beta).
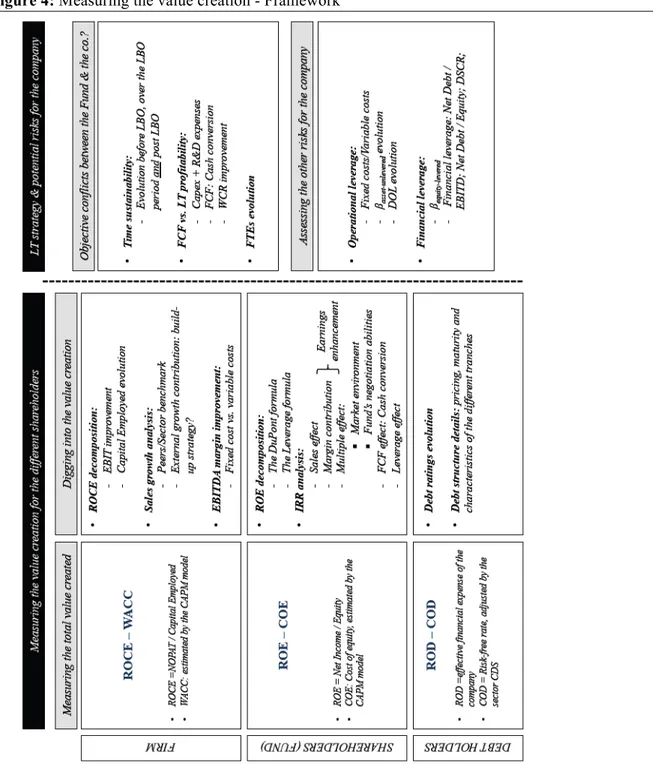
To conclude this second section, we summarize in the following table, the framework developed to measure the value creation for the different stakeholders of the firm:
Figure 4: Measuring the value creation - Framework
Part III. The Legrand case study
The third part of this paper will be devoted to working on the Legrand case study and analysing the value creation for this specific LBO development: studying what the main value creation drivers are, as discussed in our first section and applying the quantitative framework of the second section, to measure the value creation for the different stakeholders. We decided to choose that specific case study for several reasons. First, we wanted to analyse a major and well-known French LBO case study. Furthermore, since the company has been delisted at the acquisition and relisted at the exit, the Legrand case study allows us to have access to public information, at the opposite of many private LBO situations that do not display sufficient financial data for analysis. We nevertheless regret not to have enough time to study another case, in particular an example of a well-known LBO “failure” (at the opposite of Legrand), that could have been complementary to our analysis. Our approach will be, as far as possible, a comprehensive analysis of the deal, covering the pre-LBO assessment, the analysis of the main financial events during the LBO, and the assessment of the value creation, ex-post LBO. We choose to adopt a question and answer approach, as a practical way to address this case study.
III.1. Preliminary and pre-LBO analysis
Preliminary question: company presentation
Founded in 1926 and based in Limoges, Legrand manufactures a wide range of low-voltage electrical final products and systems, designed for homes, commercial and industrial buildings. They are used for electrical installations and communication networks. Still today, it is the global market leader for switches and sockets. As of 2002, the company mainly operates in France and Italy (combined 50% of sales) but is also present in other European countries and in the US (notably, with the Wiremold acquisition in 2000). It employs c.25k FTEs and Mr François Grappotte, CEO since 1983, manages it. Listed since 1970, Legrand is acquired by Schneider in 2000. Following the refusal of the EC about such a merger, Legrand is finally taken private by a consortium led by Wendel and KKR, through a LBO development between Dec-2002 and May-2006, then re-listed in May-2006.
Figure 5: Legrand sales (€m) and EBIT margin: evolution and breakdown
Sales (€m) and EBIT margin evolution Sales and EBIT geographical breakdown
Source: company information, own research
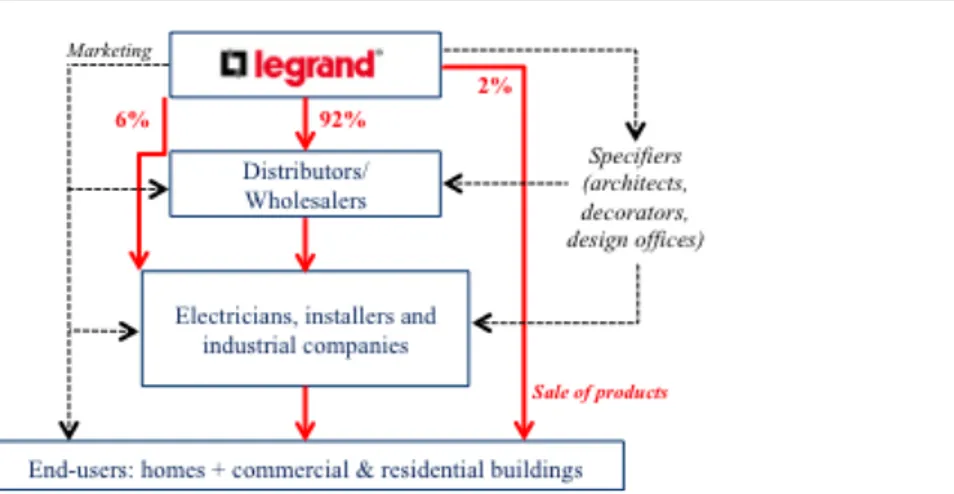
Legrand's products are distributed through a network of specialized wholesalers, selling themselves to a large and fragmented electrician customer base, as displayed in the Figure 5:
Figure 6: Distribution network
Source: Société Générale and Credit Suisse broker reports (initiation of coverage - Jun-2006)
The market of the company, explicitly comprised by "products and systems for low voltage electrical installations and data networks" has a global estimated size of 50bn€ (c.6% market share for Legrand). Legrand is the only global pure player, focused in low-voltage electrical equipment. As such, Legrand's competitors are either international large players (that only have a specific division devoted to low-voltage electrical equipment), or small local players, more specialized. While the first ones have financial strength and often strong R&D capabilities, the second ones benefit from a good knowledge of the market and a flexible organisational structure.
1. After having conducted a strategic and a short financial analysis, over the 2000-2002 period, does Legrand appear to be a good candidate for an LBO acquisition?4
Strategic analysis
The market of low-voltage electrical installations benefits from many advantages, when considering an LBO acquisition:
- First, it is a mature market with a limited end-market cyclicality, resulting in robust and predictable cash flows for Legrand. It is firstly due to the specific end-market demand: a fragmented customer base of electricians that often are very loyal to the brand, due to habits and reliability reasons. Furthermore, the demand is characterized by "a regular flow of low ticket items": indeed, the low-voltage electricity installation costs often represent a very small proportion of the total building costs and a major part of Legrand revenues comes from the renovation segment (60% as of 2005), that is undoubtedly less sensitive to deflationary economic cycles. This "flow nature of business" contributes to make the WCR less fluctuant, which is a key criteria in a LBO acquisition. On top of that, over the 1990-2000 period, Legrand has always managed to sustain an historical growth rate of c.5%, including annual price increases of 1-2%. This comes from low price-demand elasticity for the electricians, who can easily pass on price increases to the final customers and do not pay as much attention to the price as to the product reliability, its ease of installation or its availability.
- Second, Legrand's market has high barriers to entry, all the more so that the competitive position of Legrand is a specific one - only global pure player, specialized in low-voltage electrical equipment. The most important barriers to entry of Legrand's market and position are: (i) the strong relationship the company has with its distributors and electricians, and the resulting brand loyalty, towards products that have to be reliable, safe (security is a key selection criteria) and easily installable; (ii) the national regulations, specific to each country in which Legrand is implanted and that require, for a potential entrant, a deep market knowledge; (iii) the R&D capabilities: Legrand historically used to spend significant R&D expenses, as compared to its competitors (see question 13).
- Third, it is a "globally fragmented and locally concentrated" market, meaning that, on the one hand, the local competition is often less fierce; on the other, it gives a
4 The information provided in this question, as well as for the previous company presentation, largely refers to
significant scope for acquisitive growth. As such, external growth has been historically a clear strategy to sustain Legrand's growth. As such, in 2000, Legrand acquired Wiremold (US cable manufacturer) for c.770m$, strongly supporting its US growth.
Financial analysis
The main financials of the company are displayed in the Figure 7. The top-line growth over the 1997-2002 period proves to be sustained and resilient, notably thanks to an acquisitive growth strategy followed by the company, regular price increases (c.1-2% p.a.). Hence, the resulting CAGR over the 6-year period is above 8%, significantly outperforming the sectorial underlying growth rate of c.4%. Although Legrand used to be one of the most profitable company in its sector before 2000, the operating margin has been strongly deteriorated, notably due to the Wiremold acquisition in 2000, which worsened the group EBITDA and EBIT margins. As such, at the LBO acquisition, François Grappotte told in an interview5 that the return to a 15% margin level was expected, after having "absorbed" the acquisition of Wiremold. Hence, leaving out the negative impact of this acquisition, we can conclude about the high profitability of the company and, most importantly, about its stability. Likewise, the normalized cash-flow generation of the company is quite stable, at an historical level of c.50%, excluding the Wiremold impact.
On the investment side, in our view, the needs in terms of WCR and Fixed Assets seem to be both significant, as compared to the EBIT generation and to the sectorial comparison (see question 13). As such, there is definitely a significant scope for improvement in the asset turn for the LBO and, not surprisingly, we will find in our coming analysis, that the WCR and asset turn improvements largely contributed to the operating performance enhancement. Although significant (c.20% of sales), we also notice that the WCR needs are relatively stable and therefore predictable, in the context of an LBO acquisition.
As a result of both a deteriorating operating margin and a poor asset turn management, it is not surprising to find a low ROCE, even slightly below the cost of capital. Per se, over the 2000-2002 period, the company keeps destroying value. Nevertheless, it does not seem alarming in our view, since: (i) as explained in the question 6, our ROCE computation, for accounting reasons, may slightly underestimate the real profitability of the company; (ii) the ROCE deterioration is the direct consequence of the Wiremold acquisition, and should be improved after 2002. Again, it gives scope for improvement during the LBO.
5 Source: Reuters – 12/11/2002 – Legrand organise son avenir avec le consortium Wendel
On the debt side, the leverage and gearing levels are reasonable, as of 2002, giving here as well, a possibility for an LBO acquisition.
Figure 7: Pre-LBO financial network
Source: company information, own research Risks & Mitigants
The risks of Legrand, specifically from a LBO perspective, are more strategic than financial (considered the high profitability of the company and potential cash-flow generation). The only significant financial risks we can notice are that of currency translation (hedged) and price inflation for raw materials (representing a significant portion of the COGS, i.e. nearly 30% of sales). Meanwhile, historically, it has not posed a real threat for the company, which has always managed to pass through price increases on to final customers.