HAL Id: hal-01770934
https://hal.archives-ouvertes.fr/hal-01770934
Submitted on 19 Apr 2018
HAL is a multi-disciplinary open access
archive for the deposit and dissemination of sci-entific research documents, whether they are pub-lished or not. The documents may come from teaching and research institutions in France or abroad, or from public or private research centers.
L’archive ouverte pluridisciplinaire HAL, est destinée au dépôt et à la diffusion de documents scientifiques de niveau recherche, publiés ou non, émanant des établissements d’enseignement et de recherche français ou étrangers, des laboratoires publics ou privés.
Cathodoluminescence hyperspectral analysis of
whispering gallery modes in active semiconductor wedge
resonators
Pierre Guillemé, Julie Stervinou, Tony Rohel, Charles Cornet, David Gachet,
Stéphane Balac, Fabrice Mahé, Yannick Dumeige, Yoan Léger
To cite this version:
Pierre Guillemé, Julie Stervinou, Tony Rohel, Charles Cornet, David Gachet, et al.. Cathodolu-minescence hyperspectral analysis of whispering gallery modes in active semiconductor wedge res-onators. Optics Letters, Optical Society of America - OSA Publishing, 2018, 43 (8), pp.1766-1769. �10.1364/OL.43.001766�. �hal-01770934�
Cathodoluminescence hyperspectral analysis of
whispering gallery modes in active semiconductor
wedge resonators
PIERRE GUILLEMÉ1,2, JULIESTERVINOU1, TONY ROHEL1, CHARLES CORNET1, DAVID GACHET3,
STÉPHANE BALAC4, FABRICE MAHÉ4, YANNICK DUMEIGE1, ANDYOAN LÉGER1,*
1Univ Rennes, INSA Rennes, CNRS, Institut FOTON – UMR 6082, F-35000 Rennes, France
2Current address: Nanoscience Laboratory, Department of Physics, University of Trento, I-38123 Povo-Trento, Italy 3Attolight AG, EPFL Innovation Park, Building D, 1015 Lausanne, Switzerland
4IRMAR, CNRS UMR 6625, Université de Rennes 1, F-35042, Rennes, France *Corresponding author: yoan.leger@insa-rennes.fr
Compiled April 19, 2018
Whispering gallery mode resonators are key devices for integrated photonics. Despite their generalization in fun-damental and applied science, information on spatial confinement of light in these structures is mostly retrieved from purely spectral analysis. In this work, we present a detailed spectral and spatial characterization of whisper-ing gallery modes in active semiconductor microdisk resonators by use of hyperspectral cathodoluminescence. By comparing our experimental findings to finite element simulations, we demonstrate that the combination of spec-tral and spatial measurements enables unique identification of the modes and even reveals specific features of the microresonator geometry such as a wedge profile.
Hyperspectral cathodoluminescence (HCL) consists in the recording and processing of 4D datasets contain-ing the cathodoluminescence intensity spectrum of a sample for each pixel of the scanncontain-ing electron microscopy image [1]. This method has now become the ultimate characterization tool in many research fields [2–5], demonstrating its potential through advanced spectral processing [3] and/or the combination of spectral and spatial representations [2]. More precisely, in the field of photonics, HCL has recently been used to measure the local density of optical states (LDOS) in photonic crystal cavities [2]. Nanometer scale information on the density of optical states in photonic devices is a key asset for the developement of future on-chip photonic devices [6], from laser sources [7] to nonlinear devices [8].
Nevertheless, such a technique has rarely been used for whispering gallery mode (WGM) resonators, despite their ubiquity in current photonic research, from opto-mechanics [9] and quantum optics [10] to bio-physics [11]. Most demonstrations of WGM cathodoluminescence images have been demonstrated with wide band gap materials such as GaN [12] and ZnO [13] while recourse to HCL remains anecdotal [5]. Conversely, recent results using scanning near-field microscopy on InP-based microdisks [14] demonstrate the vivid interest in imaging WGMs at the sub-wavelength resolution.
In this work, we fill this gap by reporting an advanced hyperspectral characterization of whispering gallery modes in an active gallium phosphide-based microdisk using low temperature cathodoluminescence. Our measurements experimentally reveal the nanoscale differences between mode geometries, allowing us to identify the radial order n of the modes and even polarization states. Signature of the microdisk shape, namely a wedge rim, is also demonstrated unambiguously through the relative spatial distributions of Ez and Hz
polarized modes.
dielectric-(a) (c) (b) (d) GaPN QWs x5 GaP Hz mode profile (n=2, m=32) PL int. (arb. un its) 700 680 660 640 620 600 Wavelength (nm) 1 100 900 600 300K
Fig. 1.a) Scanning electron microscopy image of an active GaP microdisk on Al0.7GaP pedestal. b) Room
temperature photoluminescence of such disks; Emission from GaPN QWs is filtered by high Q (∼ 10000)
WGMs. The inset shows the logscale GaPN QW emission spectrum from the unprocessed sample, where a high wavelength exponential tail is clearly observed. c) Finite element mesh used to calculate the WGMs of the microdisks. d) Sketch presenting the overlap between the GaPN QWs and the(n = 2, m = 32, p = 1) WGM as extracted from the FEM calculation.
material photonic-crystal device, with the electron beam acting directly as a broadband dipole source, known as coherent excitation [15,16], our measurements should more likely originate from incoherent excitation consisting in the creation and relaxation of many electron-hole pairs down to the active material of the photonic structure, namely quantum wells (QWs)and subsequent radiative recombination [17]. In some cases coherent emission processes can also be observed above the semiconductor band gap emission [18] and photon correlation experiments then become necessary to identify the coherent and incoherent contributions to the signal [19]. In the present work, the spectral range of the CL signal lying precisely at the position of the QW radiative transition as discussed in the following, we will consider that the dominant excitation process is mainly incoherent. Beside good emission properties, the recourse to such an excitation scheme to retrieve information on the LDOS requires to validate the following criteria: i) the homogeneity of the material optical properties; ii) the weak influence of carrier relaxation and diffusion to maintain a spatial resolution as close as possible to the electron beam profile; iii) the minimization of photon reabsorption in the photonic structure, due to the localized excitation scheme. Finally, the ideal material should present a large emission spectrum to probe as many WGMs as possible.
These criteria are mostly satisfied with dillute-nitride GaP-based materials. As far as emission homogeneity is concerned, semiconductor microdisks, and especially suspended geometries such as the one presented in Figure1a) are often affected by surface recombination losses. This problem is partially circumvented by the use of nanostructured materials (i.e. quantum wells in the present work) so that only the disk rims can alter the emission. In the case of GaP-based devices, the surface recombination rate is low, typically one order of magnitude smaller than in GaAs [20], limiting the degradation of the material emission properties in the vicinity of the rims. Because of its indirect band gap, GaP is intrinsically a poor light emitter. The incoporation of nitrogen in GaP in the dillute regime (a few %) is associated with an important increase of the material emission properties because nitrogen states, strongly localizing electrons, get coupled with the GaPΓ band to form a pseudo-direct band gap material [21]. The GaPN0.02quantum wells (QWs) used in this work present
room temperature photoluminescence originating from the band-to-band pseudo-direct transition between 600 and 900nm, well below the GaP band gap (550nm), as shown in the inset of figure1b). At low temperature (10 K) where cathodoluminescence experiments are carried out, the Varshni band gap variation blueshifts the QW emission by 25 nm so that the PL/CL maximum lies around 615 nm. A strong localization character is
(a)
(b) (c)
(d) (e) (f)
Th.
Fig. 2.a) Sketch of the hyperspectral data cube: HCL provides the emission intensity spectrum for each
excitation point of an e-beam x−y scan. The raw emission (black spectrum) can be processed to remove the background contribution (dashed green spectrum) from the WGMs contribution (red spectrum). Panels b)
and c) show x−y slices in the HCL cube at wavelength λ = 584.5 nm where a WGM is observed, before
and after background filtering respectively. Panels d) and e) are λ−x slices of the HCL cube at y=0 before and after filtering as well. The data set presented throughout this article was obtained on a typical 4 µm-diameter microdisk. Panel f) shows the calculated λ−x slice of the Poynting vector magnitude in a wedge microdisk, obtained by limiting the mode Q factor to a fixed value close to the experimental one.
conserved as evidenced by the high-wavelength exponential tail in the photoluminescence spectrum. This is a great advantage in the present work since: it limits the carrier diffusion length to 100 nm [22]; it protects the carriers from non-radiative relaxation channels and it is responsible for a large inhomogeneous broadening of the spectrum. Last but not least, localization leads to a non-negligeable Stokes shift [23] which limits reabsorption mechanisms. All these features reinforce the fact that the hyperspectral cathodoluminescence measurements reported in this work provide accurate information on the microdisk LDOS.
The GaP suspended microdisks presented here were fabricated from epilayers grown by molecular beam epitaxy. The heterostructure consists of a 200-nm-thick GaP layer containing five 3-nm GaPN0.02QWs deposited
on top of a 1-micron-thick Al0.7GaP sacrificial layer, grown on a GaP substrate. E-beam lithography was used
to define the microdisk structures using SU8 resist and a SiNxhard mask. Chlorine-based dry etching and
lateral wet etching with hydrofluoric acid were then used to obtain the suspended geometries, a SEM view of which is presented in figure1a). A wedge profile of the disk of 50◦is obtained due to the lateral etching of the hard mask during the dry etching process. Room-temperature microphotoluminescence on these microdisks reveals WGMs with Q factors in the range of 104mainly limited by the rim roughness (10 nm RMS) as shown
in figure1b).
The HCL experiments were performed at low temperature (10 K) using an Attolight Allalin integrated cathodoluminescence microscope with a 100 nm spatial resolution and a spectral resolution of 0.1 nm on a 4
µm-diameter microdisk. The beam voltage was set to 3kV. Once the HCL data cube is recorded (see figure2a),
a data processing routine is used to separate the background emission, dominated by low-Q Fabry-Perot modes (dashed green plot) from the WGM contribution (red spectrum). This routine is performed independently from one spatial pixel to the other but does not impact the spatial integrity of the data as shown in the x−y
hyperspectral slices presented in figure2b) and c). These plots present the CL spatial distribution before and after filtering respectively on a WGM resonance at λ=584.5 nm. Even if noisier, the annular profile of the WGM at this wavelength is clearly conserved from b) to c) while the cross shape pattern at the center of the disk, induced by the square-base pedestal becomes less visible demonstrating the different origins of these emission structures. The effect of the background filtering is much more interesting along a λ−x slice of the HCL cube, as demonstrated in figure2d) and e). While the WGMs can only be barely observed before filtering (panel d), a structure is observed after filtering (panel e). Whispering gallery modes, lying along the rims of the microdisks (r> 1 µm), are clearly discriminated against emission in the central area, where high radial order WGMS and Fabry-Perot modes in the disk coexist. Different sets of WGMs can already be qualitatively identified through the analysis of their free spectral range (FSR) and radial extension. In the following, we quantitatively analyze these parameters to identify the different mode sets.
!" #!$ #!% #!& #! #!" '()*(+,-./*0*.1,2345 !"#$%&' !$#(%&' !(#)%&' !*#*%&' !!# %&' 67,*1081/*09,2(:;!,<1*0/5 #!"#! #!&#!%#!$ !" '()*(+,-./*0*.1,2345 ""#)%&' "(#+%&' "*#+%&' " #$%&' ",#,%&' #!= #!$ #!> #!% #!? #!& #!@ #! '()*(+,-./*0*.1,2345 %%" %&" % " %"" ?$" A(B8+81C0D,2145 2(5, 2;5, 2E5, 2(5, 2;5, FG-! 2)5, HD!,E9+! 285, HD!,I8)C8)
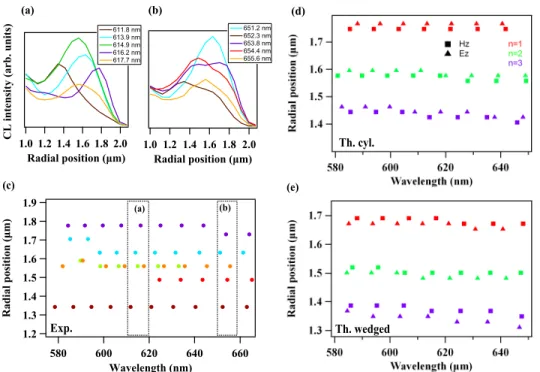
Fig. 3.a) and b) Spatial profiles of WGMs lying within two distinct wavelength ranges (610−620 nm and
650−660 nm respectively). The color code for the modes is the same as the one used in graph c), presenting the spatial position of the mode maximum versus the resonance wavelength. The FSR for the different mode sets, from the external one to the internal one, is : 6.85 THz (purple), 6.54 THz (cyan),7.24 THz (orange), 6.95 THz (green), 7.36 THz (red) and 7.34 THz (brown). Panels d) and e) are the theoretical counterparts of c) obtained for a cylindrical disk and a wedge disk respectively. In the simulations, the disks’ diameter is 4
µm in the two cases, with a wedge of 50◦for the second case. The FEM simulation allows to discriminate
between Ez and Hzpolarization as well as between the different radial orders n.
In figure3a) and b), we plot the spatial emission profiles of WGMs lying in two distinct wavelength ranges. In a) (610−620 nm range), five WGMs are spectrally separated. Their spatial profiles show very distinct signatures but surprinsigly, they all present only one maximum, in opposition with the expectation for WGMs with different radial orders. One mode has an intensity maximum very close to the disk rim (1.8 µm for the 616.2 nm mode) while the 611.8 nm resonance features an intensity maximum closer to the disk center, at 1.35
µm, with a long tail towards the microdisk rim. The three other resonances lie between these positions. We
will see in the following that despite the absence of multiple lobes, these different modes can be attributed to different radial orders and polarizations. In some cases, two WGMs overlap, both spectrally and spatially. The combined information of the λ−x slice is then of great advantage to differentiate the two modes. This is the case for the 653.8 and 654.4 nm modes presented in figure3b), the maxima of which respectively lie at 1.48
REFERENCES REFERENCES and 1.7 µm. For both intervals (a) and (b), the position of the maximum intensity for each mode is reported in figure3c) which was finally obtained by extending the previous spatial analysis to the whole emission spectrum. Six sets of WGMs can be identified from figure3c). Each set shows a distinct spatial position, except for the orange and green sets which both lie around 1.55 µm. The six sets also feature distinct FSRs (provided in the figure caption).
These experimental results are compared with eigenmode calculations obtained by the weak formulation of the finite element method (FEM) using Freefem++ [24]. A typical axi-symmetrical mesh, mimicking our GaP microdisks is presented in figure1c). From the eigenmode profiles, we extracted the magnitude of the Poynting vector at the height of the QWs, as shown in figure1d). This value is expected to be proportional to the ideal cathodoluminescence signal, for fully localized carriers and in the absence of optical loss and non-radiative carrier recombination. Two disk geometries have been studied: a 50◦wedge-shaped microdisk, the calculated λ−x slice of which is presented in figure2f) and a cylindrical disk. The WGM distributions for these two geometries are summarized in figures3d) and e). As pointed out in figure2, the experimental and calculated WGM distribution are at first sight qualitatively similar: WGMs with distinct spatial distributions allow to define six mode sets with FSR in the 10-nm range. In the simulations, WGMs show a number of lobes equal to their radial order, contrary to the experimental data. The secondary maxima for n = 2 and n=3 radial order modes show roughly half the intensity of the main peak and are only 60-80 nm large. Their disappearance in the experiments in favor of a smooth signal decay (e.g. 611.8 nm mode in figure3a) may come from a larger carrier diffusion and also from carrier trapping by surface states at the disk rims.
In the calculations, the mode intensity maxima lie in the same spatial range as the experiment, between 1.3 and 1.8 µm as shown in figures3d) and e). If the six mode sets observed experimentally spread quite homogeneously within this span, the theoretical modes are grouped by polarization pairs around three distinct radial positions. The main difference between the two microdisk geometries precisely comes from the ordering of these pairs. For the cylindrical disk (figure3d) ), the Ezpolarized modes are closer to the rims than the Hz
modes. The situation is reversed for the wedge microdisk (figure3e) ). The reader will notice that within a pair, the two polarization states present different FSRs: Ezmodes always feature a smaller one than Hz modes.
Back to the experimental results, we observe that the FSR alternance, from the more external modes to the more internal ones follows the one of a wedge disk (larger FSR, then smaller FSR and so on) in agreement with the SEM image of our structures. This, together with the spatial distribution of the mode sets allow us to characterize with good confidence the measured mode profiles: In figure3c), the purple and cyan mode sets are respectively the Hz and Ezmodes with n =1 radial order; the green and orange sets are attributed
to the n=2 Hzand Ezmode sets while the red and brown sets are attributed to the n=3 Hzand Ezmodes
respectively. The small deviations between the experimental mode distribution (figure3c) and the theoretical one (figure3 e) can be explained by the interplay between the wedge and pedestal influences, extremely dependent on geometry variations.
As a conclusion, we demonstrated that hyperspectral cathodoluminescence in active photonic devices such as microdisks can provide the blueprint of the confined optical modes. This method enables the iden-tification of WGM features such as radial order or polarization state. It also enlightens effects of geometry refinements such as a wedge profile on the mode distribution. Our results show the pertinence of hyperspectral cathodoluminescence as an ultimate characterization tool for advanced photonic engineering.
REFERENCES
1. J. Christen, J. Vac. Sci. & Technol. B: Microelectron. Nanometer Struct.9, 2358 (1991).
2. R. Sapienza, T. Coenen, J. Renger, M. Kuttge, N. F. van Hulst, and A. Polman, Nat Mater11, 781 (2012).
3. C. M. MacRae, N. C. Wilson, and A. Torpy, Min. Petrol107, 429 (2013).
4. P. R. Edwards, D. Sleith, A. W. Wark, and R. W. Martin, J. Phys. Chem. C115, 14031 (2011).
5. J. Bruckbauer, P. R. Edwards, T. Wang, and R. W. Martin, Appl. Phys. Lett.98, 141908 (2011).
6. A. W. Schell, P. Engel, J. F. M. Werra, C. Wolff, K. Busch, and O. Benson, Nano Lett.14, 2623 (2014).
7. G. Crosnier, D. Sanchez, S. Bouchoule, P. Monnier, G. Beaudoin, I. Sagnes, R. Raj, and F. Raineri, Nat. Photonics11, 297 (2017).
8. D. P. Lake, M. Mitchell, H. Jayakumar, L. F. dos Santos, D. Curic, and P. E. Barclay, Appl. Phys. Lett.108, 031109 (2016).
9. C. Baker, W. Hease, D.-T. Nguyen, A. Andronico, S. Ducci, G. Leo, and I. Favero, Opt. Express22, 14072 (2014).
10. E. Stock, F. Albert, C. Hopfmann, M. Lermer, C. Schneider, S. Höfling, A. Forchel, M. Kamp, and S. Reitzenstein, Adv. Mater.25, 707 (2013).
REFERENCES REFERENCES
12. C. Tessarek, M. Heilmann, and S. Christiansen, physica status solidi (c)11, 794 (2014).
13. S. Choi, C. Ton-That, M. R. Phillips, and I. Aharonovich, Appl. Phys. Lett.103, 171102 (2013).
14. A. V. Shelaev, A. M. Mintairov, P. S. Dorozhkin, and V. A. Bykov, J. Physics: Conf. Ser.741, 012132 (2016).
15. M. Kociak and L. F. Zagonel, Ultramicroscopy.176, 112 (2017).
16. F. J. García de Abajo and L. A. Blanco, Phys. Rev. B67, 125108 (2003).
17. S. Meuret, T. Coenen, H. Zeijlemaker, M. Latzel, S. Christiansen, S. Conesa-Boj, and A. Polman, Phys. Rev. B96, 035308 (2017).
18. L. H. G. Tizei, L. F. Zagonel, M. Tencé, O. Stéphan, M. Kociak, T. Chiaramonte, D. Ugarte, and M. A. Cotta, J. Physics: Condens. Matter25, 505303
(2013).
19. S. Meuret, L. Tizei, T. Cazimajou, R. Bourrellier, H. Chang, F. Treussart, and M. Kociak, Phys. Rev. Lett.114, 197401 (2015).
20. A. G. Baca and C. I. H. Ashby, Fabrication of GaAs devices, no. 6 in Processing series (Inst. of Electrical Engineers, 2005).
21. R. Kudrawiec, A. Luce, M. Gladysiewicz, M. Ting, Y. Kuang, C. Tu, O. Dubon, K. Yu, and W. Walukiewicz, Phys. Rev. Appl.1, 034007 (2014).
22. S. R. Kurtz, A. A. Allerman, C. H. Seager, R. M. Sieg, and E. D. Jones, Appl. Phys. Lett.77, 400 (2000).
23. S. Ilahi, S. Almosni, F. Chouchane, M. Perrin, K. Zelazna, N. Yacoubi, R. Kudrawiec, P. Râle, L. Lombez, J.-F. Guillemoles, O. Durand, and C. Cornet, Sol. Energy Mater. Sol. Cells141, 291 (2015).