HAL Id: hal-00506297
https://hal-mines-paristech.archives-ouvertes.fr/hal-00506297
Submitted on 27 Jul 2010
HAL is a multi-disciplinary open access
archive for the deposit and dissemination of
sci-entific research documents, whether they are
pub-lished or not. The documents may come from
teaching and research institutions in France or
abroad, or from public or private research centers.
L’archive ouverte pluridisciplinaire HAL, est
destinée au dépôt et à la diffusion de documents
scientifiques de niveau recherche, publiés ou non,
émanant des établissements d’enseignement et de
recherche français ou étrangers, des laboratoires
publics ou privés.
Comparison of Probabilistic Modelling Approaches
Jérémie Juban, Lionel Fugon, Georges Kariniotakis
To cite this version:
Jérémie Juban, Lionel Fugon, Georges Kariniotakis. Uncertainty estimation of wind power forecasts:
Comparison of Probabilistic Modelling Approaches. European Wind Energy Conference & Exhibition
EWEC 2008, Mar 2008, Brussels, Belgium. 10 p. - http://www.ewec2008proceedings.info/.
�hal-00506297�
Uncertainty Estimation of Wind Power Forecasts
Comparison of Probabilistic Modelling Approaches
J´er´emie Juban
*, Lionel Fugon and George Kariniotakis
**Center for Energy and Processes - ´Ecole des Mines de Paris B.P.207, F-06904 Sophia-Antipolis, France
Abstract—Short-term wind power forecasting tools providing “single-valued” (spot) predictions are nowadays widely used. However, end-users may re-quire to have additional information on the uncer-tainty associated to the future wind power produc-tion for performing more efficiently funcproduc-tions such as reserves estimation, unit commitment, trading in electricity markets, a.o. Several models for on-line uncertainty estimation have been proposed in the literature and new products from numerical weather prediction systems (ensemble predictions) have re-cently become available, which has increased the modelling possibilities. In order to provide efficient on-line uncertainty estimation, choices have to be made on which model and modelling architecture should be preferred. Towards this goal we proposes to classify different approaches and modelling architec-tures for probabilistic wind power forecasting. Then, a comparison is carried out on representatives models using real data from several wind farms.
I. INTRODUCTION
W
IND power has been undergoing a rapid development in recent years. Several coun-tries have already reached a high level of installed wind power capacity, such as Germany, Spain, and Denmark, while others follow with high rates of development. Such large-scale integration of wind power is challenging in terms of power system management because wind is a variable resource. Such variability may increase the overall costs of the produced energy and thus limiting the benefits of using such a renewable energy resource.forecasting tools permit to reducing the uncer-tainty associated to wind power production. Such tools are nowadays somewhat mature as their devel-opment has been ongoing for more than 15 years [1]. These tools are multi-step ahead forecasting models that provide information for several hori-zons i.e. look-ahead times. The majority of existing forecasting tools provide a single expected value for each forecast horizon, called deterministic, spot or
point forecast. The main drawback of “spot” pre-dictions is that no information is provided about the possible departures from the predicted values. This may limits the benefits of using such predictions
* jeremie.juban@ensmp.fr ** georges.kariniotakis@ensmp.fr
in decision-making applications, especially those based on stochastic optimization or risk assessment. The need for uncertainty estimation in wind power forecasts (WPFs) has motivated the devel-opment of several approaches in the literature. Moreover, new products from Numerical Weather Prediction (NWP) systems have become available i.e. ensemble predictions. Such inputs can be valu-able for on-line uncertainty estimation but their use increases the number of modelling possibilities. The aim of this paper is to classify and compare those different possibilities in order to derive best practices for use of the available information to-ward more efficient on-line uncertainty estimation. This paper provides a first contribution toward this goal. It focuses on on-line uncertainty estimation expressed in the frame of probability theory i.e. probabilistic forecasts.
In this paper, a classification of different mod-elling approaches for probabilistic forecasting is proposed. Then, based on such classification some models are selected for comparison purposes. The comparison is carried out in two stages. Firstly, a comparison of models based on “classic” NWPs is carried out. Such first comparison allows to select the subset of models to be used in the second stage. Secondly, ensemble weather predictions are used as inputs. The models selected in the first stage are integrated in the various modelling architectures se-lected in this paper. Common evaluation criteria are used for performing the various comparisons. The performance of the models is assessed using real-world data from French wind farms corresponding to different terrain complexities and climatic con-ditions.
II. ON-LINE UNCERTAINTY ESTIMATION
A. Uncertainty Estimation – An overview
In recent years, various studies have been carried out on the estimation of WPFs uncertainty [2], [3], [4], [5]. Such studies concentrate both on the characterisation of the sources of uncertainty and on the development of methods for on-line un-certainty estimation. The various characterisations
confirmed that the NWPs are the main sources of forecast uncertainty. The second source identified is the amplification and dampening effect of the non-linear relation between wind speed and corre-sponding wind power.
B. Models Inputs – Numerical Weather Predictions
As mentioned in the previous section, the main input of on-line uncertainty estimation of wind power production is the NWPs. The NWPs are classically provided as a single value for each forecast horizon. However, predictions incorporat-ing uncertainty information become available i.e. ensemble predictions.
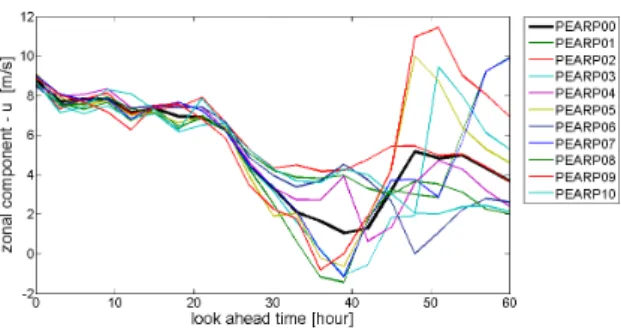
An ensemble prediction is basically a collection of “spot” predictions corresponding to various sce-narios for a given future time [6] and each indi-vidual scenario is called ensemble member. Such scenarios is presented in Figure 1. The dispersion of the ensemble members is expected to reflect the uncertainty in the NWPs.
Figure 1. Example of ensemble predictions of the zonal wind speed component (U).
Such scenarios can be obtained by two main approaches. Models that consist of different runs of a NWP systems which differ in the initial conditions and/or in the numerical representation of the atmosphere (stochastic physics). Examples of such ensembles are the EPS from the ECMWF, PEARP from Mto France or NCEP ensembles. The ensemble members are supposed to be statistically indistinguishable and equiprobable. Poor mans en-semble composed of output from different models and/or initial times, rather than a single model with perturbed initial conditions [7]. The ensemble members have generally different statistical prop-erties.
Ensemble predictions are still under investigation and development. However, interesting results have been reported. For example, the ensemble mem-bers mean generally outperforms the corresponding “spot” predictions. However, ensembles cannot be used directly for probabilistic estimation since they
generally does not possess good probabilistic prop-erties. A calibration step is generally necessary in order to obtain such properties.
C. Models Outputs – Probabilistic forecasts
In this paper, on-line uncertainty estimation ex-pressed as probabilistic forecasts is considered. Probabilistic forecasting consists in estimating the future uncertainty of a particular variable that can be directly expressed as a probability measure. This property permits a straightforward evaluation of performances and an objective comparison between different models. It can be easily integrated in var-ious applications since it has a clear interpretation and its form can be customized to the applications requirements.
The main forms to express probabilistic forecasts are:
• Discrete probabilities.
• Moments of distributions (mean, variance,
skewness, kurtosis,...)
• Quantiles and predictive intervals.
• Probability Density Functions (PDF) or
Cu-mulated Distribution Functions (CDF). In this paper, both quantiles and PDFs forecasts are provided by the models. PDFs is a generic form since it can be reduced to all the other forms. An example of such PDF forecast is shown in Figure 2.
Figure 2. Example of probability density function forecasts.
D. Examples of applications of probabilistic WPFs
Recently, various energy-related applications have shown the benefits of using probabilistic WPFs. Such forecasts may be used to estimate the optimal level of reserves that need to be al-located to compensate wind variability [8]. Such predictions can also be used advantageously for the combination of energy storage and wind power generation [9]. Energy bidding in a day-ahead electricity market is an emerging application. It has been shown that, when trading future production on an electricity market, the use of probabilistic WPFs can lead to higher benefits than those obtained with “spot” forecasts [5], [10].
III. CLASSIFICATION OF PROBABILISTICWPF
APPROACHES
A. Approaches based on spot NWPs
This section considers probabilistic WPFs ob-tained from “spot” NWPs as shown in Figure 3. Such forecasts can be obtained either by consider-ing the errors of a “spot” wind power forecastconsider-ing model or by computing the forecasts directly from the NWP inputs.
The first approach, i.e. considering the errors of a “spot” wind power forecasting model, allows to provide uncertainty estimation to existing “spot” wind power forecasting systems. Early approaches used global evaluation criteria (such as the standard deviation of forecast errors computed over sev-eral runs) as uncertainty estimates. However, this provides constant values for a given time period. Such approaches can be seen as measuring the “climatological” uncertainty instead of the “meteo-rological” uncertainty. A way to provide situation-dependent uncertainty assessment is to separate the errors into classes based on the explanatory variables of the forecasting problem. The standard deviation of prediction errors can be computed for predefined classes of predicted wind power [11] or depending on weather situations [2]. The main drawback of these methods is that they introduce discontinuities when changing from one class to the other. Moreover, determining the number of classes and their width can be difficult. A way to avoid dis-continuities is to use smoothing techniques. In [5] fuzzy set theory is used to overcome the problem of class discontinuity. In such work, the error dis-tributions are associated to different fuzzy sets. A conceptually different method, quantile regression based on cubic B-spline is described in [12], where quantiles of the prediction error are computed using various explanatory variables.
Concerning the second approach, i.e. computing the forecasts directly from the NWP inputs, several methods have also been proposed. A method for converting wind prediction errors into power output uncertainty based on the derivative of the power curve is proposed in [2]. Local quantile regression is used in [13] to compute specific quantiles of the power production. A comparison of three quantile approaches, namely local quantile regression, lo-cal Gaussian modelling and, the Nadaraya-Watson estimator, is performed in [14]. A comparison of GARCH modelling approaches is proposed in [15], using both Gaussian and empirical distributions.
B. Approaches based on ensemble NWPs
1) The filtering approach: A schematic repre-sentation of the filtering approach is depicted in Figure 4. In a first step, wind ensemble NWPs are converted into power ensembles by passing each ensemble member through a “spot” forecasting model. The two main options consist in either considering a unique conversion model or using different ones for each ensemble member. The resulting power ensembles only account for input uncertainty and not for model uncertainty. This leads to underestimating the global uncertainty. Moreover, the input power ensembles are generally not calibrated. To overcome this problems vari-ous post-processing methods are used to convert the uncalibrated power ensembles into probabilistic forecasts.
For the case of ensembles derived from per-turbation of a single NWP model, a unique con-version model is generally used because the en-semble members can be generally considered as indistinguishable. In [15] a unique power curve model is used to filter the 50 ECMWF ensemble members. Then, the wind power ensembles are calibrated using kernel density estimators. In [16], [17], [18], [19] a conditional parametric model is used for the conversion. Then, the power ensembles are converted into quantiles using a model based on cubic splines and local regression.
For the case of multi-model ensembles a cus-tomized model is generally fitted for each mem-ber. This is due to the fact that the members are issued from different models and therefore possess different statistical properties. In [20] a 75-member multi-model ensemble is filtered using a tailored power curve estimation method. The resulting power ensembles are then reduced to “spot” forecasts by computing a statistical “best guess”. Various, approaches for combining “spot” WPFs have also been considered and can be seen in most cases as the generation of multi-model power ensembles.
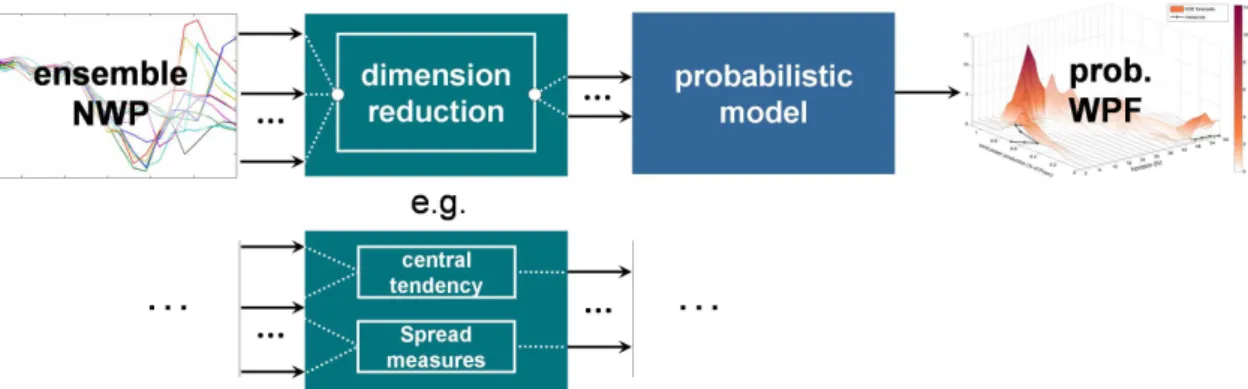
2) The dimension reduction approach: This ap-proach, depicted in Figure 5, consists in first re-ducing the input dimensionality and then feeding these reduced inputs to a probabilistic prediction model similar to approach 1. In [21] a principle component algorithm is applied to ECMWF fore-casts. Various studies have shown that there exist a relation between ensemble spread and prediction error e.g. [22]. This property can be used for reducing the ensembles to two values: an infor-mation of central tendency (e.g. the mean) and an information of spread (e.g. the variance). Another
Figure 3. The “spot-NWP” approach (1). Probabilistic wind power forecasts from “spot” NWPs. The two main approaches consist in either considering the errors of a “spot” wind power forecasting model or computing the prediction directly from the NWP inputs.
Figure 4. The “filtering” approach (2a). Wind ensemble NWPs are converted into power ensembles. The two main options consist in either considering a unique conversion model or using different conversion models for the different ensemble members. The resulting power ensembles are then converted into probabilistic wind power forecasts.
Figure 5. The “dimension reduction” approach (2b). Wind ensemble NWPs input are first reduced in dimensionality. For example, the ensembles members can be reduced to a central tendency (e.g. mean) and a spread information (e.g. standard deviation). Then, the reduced inputs feed a probabilistic prediction model similar to approach 1.
Figure 6. The “direct” approach (2c). Wind ensemble NWPs are directly input into a probabilistic model. The model should be able to consider high dimension inputs.
way to summarize the ensemble input information is by using risk indices. It has been shown that the probabilistic properties of ensemble forecasts are improved by spatial or temporal aggregation. An index called “meteo risk index” has been proposed in [23]. Such index has been used as input to adapt the size of prediction intervals [23] or as a direct input to a probabilistic forecasting model [12].
3) The direct approach: The direct approach consists in feeding wind ensemble NWPs directly input into a probabilistic model as presented in Figure 6. Most statistical models are sensitive to the “curse of dimensionality” i.e. by augmenting the number of input variables, the model complexity (i.e. number of parameters) dramatically increases without compensation through provision of more samples. Various strategies have been proposed in the literature to overcome this problem including input selection or dimension reduction as men-tioned in the previous section, regularisation tech-niques [24], or random input selection [25].
4) Hybrid approaches: In [26] an hybrid di-mension reduction/direct approach is used. The predicted distribution is modelled as a Gaussian one. The mean of the distribution is computed in a direct way simply by taking a linear combination of the ensemble members. The variance is com-puted using a dimension reduction approach, which consists in simply taking a linear combination of the ensemble spread. All the linear coefficient are chosen in order to minimize the Continuous Ranked Probability Score.
IV. COMPARISONMETHODOLOGY
A. Overview
The comparison has been carried out in two stages. In the first stage various probabilistic fore-casting models taking “spot” NWPs are compared. At a second stage, the different architectures pre-sented in subsection III-B are applied on a selection of model from stage one for comparison purposes. The selected models has been chosen among various non-parametric ones since this avoid too large modelling error due to the choice of a par-ticular family of distribution. Then, among the non-parametric models, various types of methods are considered including, quantile regression, local regression and classification trees. A simple linear quantile regression is used as reference probabilis-tic model.
The compared probabilistic models are (stage 1):
• Linear Quantile Regression (ref) • Spline Quantile Regression (SQR) • Quantile Regression Forest (QRF) • Kernel Density Estimation (KDE)
The selected approaches are both dimension reduction (2b) and direct approaches (2c). The filtering approach (2a) is not considered here and will be addressed in further communications. For reduction dimension, the mean and variance, or median and Median Absolute Deviation (MAD) of the ensemble members is fed into the selected probabilistic forecasting models. For the direct approach, two solutions to avoid the “curse of dimensionality” has been considered here. First, the fact that the input ensembles members are indistinguishable permits to constraint the model to having the same parameter values for all ensemble members. This has the advantage of levelling the number of parameters with the “spot” case. A spe-cific implementation of Kernel Density Estimation (presented in [27]) has been developed to include this property. Second, Quantile Regression Forest (presented in [28]) include a random input selection phase and is specially designed to manage large input dimensionality.
The compared architectures are (stage 2):
• Mean/Variance approach (2b) • Median/MAD approach (2b) • Direct approach (2c)
B. Probabilistic forecasts considered
The probabilistic forecasts considered in this pa-per are predictive intervals with nominal coverage rates ranging from 10 % to 90 % with 10 % increments. They are computed from the quantiles or predictive densities generated by the different model. The choice of the 10 % increment is made to render the evaluation of such intervals consistent with the results reported in the relevant literature.
C. Selected models overview
1) Simple Reference Models: For the “spot” forecasts the “persistence” reference model has been used. For the probabilistic forecasts a linear quantile regression model has been used as refer-ence.
2) B-Spline Quantile Regression: The B-Spline
Quantile Regressionis used here as a third bench-mark model following the formulation recently proposed in the wind power forecasting literature [12]. In [12], an additive model is used instead of a simple linear combination. This approach models the relationship between the quantile and the explanatory variables as a linear combination of known basis functions (e.g. B-spline basis).
3) Quantile regression forests approach: This model has been proposed by ARMINES/Ecole des Mines de Paris [28] for probabilistic WPF. Quantile regression forests used in this paper is an extension
of Random Forests, which rely on classification and regression trees (CARTs) [29]. Random forest has been design to overcome the instability problem of CARTs by using bagging and random input
selection. When used for regression, random for-est compute a weighted mean over the response variable of the various classification trees. Quantile regression forests utilise the fact that the weighted observations also deliver an approximation to the full conditional distribution [30].
4) Kernel density estimation approach: This model has also been proposed by ARMINES/Ecole des Mines de Paris [28], [27] for probabilistic WPF. The principle is to directly estimates the future conditional probability density functions of the variable to be predicted based on a kernel den-sity estimator. Such estimator computes a smooth density estimation from data samples by placing on a each sample point a function representing its contribution to the density. The distribution is obtained by summing all these contributions. The model is presented in detail in [28].
V. EVALUATION FRAMEWORK
The evaluation of the performance of the proba-bilistic approaches is carried out in two steps.
Firstly, it is assessed that the probabilistic models perform similarly to equivalent “spot” prediction models when reduced to “spot” predictions. The criteria used to evaluate the “spot” prediction fol-lows the protocol described in [31]. Here, only results on the Normalized Mean Absolute Error criteria are presented.
Secondly, the probabilistic predictions are di-rectly evaluated. The probabilistic evaluation is decomposed into two main properties: reliability and sharpness.
The reliability represents the ability of the prob-abilistic forecasting model to match the observation frequencies. For example, an 85 % predictive inter-val should contain 85 % of the observed inter-values in the long run [32]. In this paper, the reliability of the predictive intervals is measured by estimating the proportion of observation actually falling in each interval.
The sharpness represents the capacity of the forecasting model to forecast extreme probabili-ties (0 or 1 probabiliprobabili-ties versus 0.5). This crite-rion evaluates the predictions independently of the observations. It gives an indication of the level of usefulness of the predictions. For example, a system that only provides uniformly distributed predictions is useless for decision making under uncertainty. Conversely, predictions having perfect sharpness are discrete predictions with probability one (deterministic predictions). In this paper the
sharpness of the predictive intervals is measured by the average interval size.
Other probabilistic evaluation criteria have also been computed, such as, resolution or skill scores (Interval Score, CRPS,...). However, results are not presented here for reasons of simplicity.
VI. CASE-STUDIES
Three French wind farms are considered for the comparison. They are representative of various ter-rain and climate conditions. However, for simplicity purposes only results of the wind farm located on the more complex terrain is presented here. Hourly average power production time-series are considered spanning a period of 18 months from July 2004 to December 2005.
For the same period, NWPs by the
ARPEGE/PEARP model of Meteo France
and ECMWF/EPS of ECMWF are used. ARPEGE is a spot NWP system and PEARP is a 10-member ensemble prediction system. The Meteo France forecasts are provided once a day for horizons 0 to 60 hours ahead, with a 3-hour resolution. ECMWF/EPS is also a spot/ensemble NWP system. EPS is a 50 members ensemble prediction system. The ECMWF forecasts are provided twice a day for horizon ranging from 0 to 240 hours ahead, with a 6-hour resolution.
The meteorological variables considered in this study are the ones selected using a mutual informa-tion criteria. Namely 50 meter above ground level wind speed and direction are used.
The horizons of power predictions are the same as that of the NWPs. The available dataset is divided into a learning-set and a testing-set com-prising 8 months (July to February) and 4 months (September to December) respectively.
VII. RESULTS(STAGE1)
A. Evaluation of the deterministic sub-product
The aim of this section is to evaluate the “spot” performance of the proposed models. The proba-bility density function forecasts (or quantiles) are converted into “spot” forecasts by taking the mean of the distributions. This correspond to the min-imum functionality that should be expected by a probabilistic model. Forecasts based on the mean of a probabilistic model should be expected to perform at least as well as state-of-the-art deterministic models. A comparison of the results is shown in Figure 7.
All the models represent significant improve-ments over the persistence. As expected, the sim-ple probabilistic reference model, linear quantile regression, performs worse than the more advanced
Figure 7. Comparison of the “spot” performance of various probabilistic models.
probabilistic models. This result remains consistent when considering other criteria such as Root Mean Square Error or Bias.
B. Evaluation of the probabilistic predictions
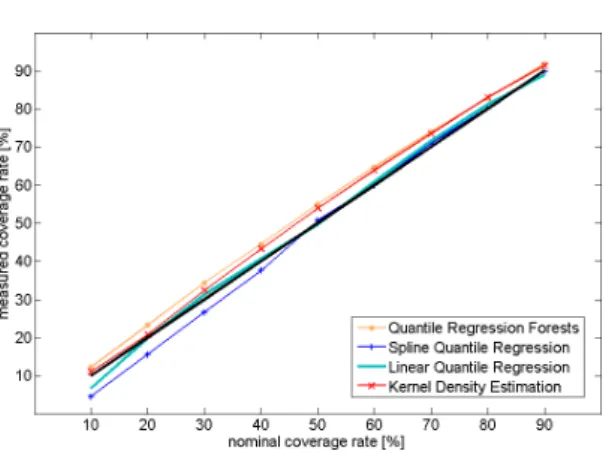
The reliability of the different methods is pre-sented in Figure 8.
Figure 8. Intervals reliability comparison for various proba-bilistic models based on “spot” NWP inputs.
All the models have a deviation in reliability bellow 5 %, which is equivalent to the state of the art. The methods QRF and KDE present the same behaviour. The intervals provided by these two methods are slightly underconfident which is pref-ered to overconfidence in most applications since this implies that, for instance, at least 80 % of the observations falls into an 80 % predictive interval. The spline quantile regression model shown good reliability performance for intervals with nominal coverage greater than 50 % and is slightly over-confident below that value. Finally, it is important to highlight that the simple probabilistic reference model presented the best overall reliability which
Figure 9. Intervals sharpness comparison for various proba-bilistic models based on “spot” NWP inputs.
is often the case for reference probabilistic models (like climatological distribution in meteorology).
The sharpness of the different methods is pre-sented in Figure 9.
The sharpness is equivalent for the four models taken into account when considering intervals with small nominal coverage rate (10 % to 50 %). In contrast, for coverage rates above 50 %, some difference between the models is observed. In that range, the reference model tends to produce large intervals (bad sharpness). Such reference model is not designed to “take risks”. Hence, by discrimi-nating a limited quantity of situations, it tends to produce large intervals with high reliability. The underconfidence of QRF and KDE naturally leads to produce slightly larger intervals. Spline quantile regression reaches a good overall performance for intervals of high coverage rate.
C. Conclusions of stage one
An overall evaluation of the probabilistic per-formances of the models has been carried out. A deeper analysis of reliability and sharpness as well as other criteria (e.g. resolution) for various hori-zons showed that the three models QRF, KDE and SQR have similar performances and improve over the simple reference models. Hence, for the second stage, i.e. forecasting from ensemble NWPs, two models are selected to be coupled with the various architectures. The selected models are based on Quantile Regression Forests and Kernel Density Estimation.
VIII. RESULTS(STAGE2)
A. Evaluation of the “spot” sub-products
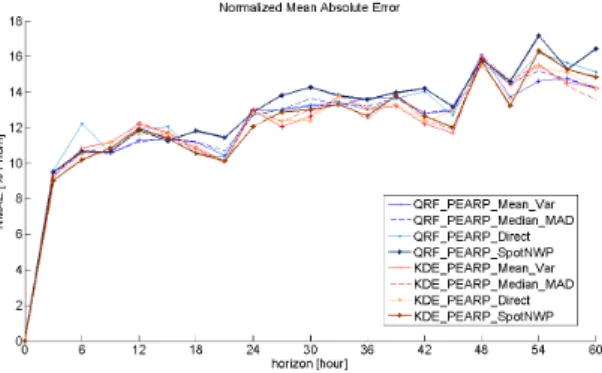
The comparison of the results from various archi-tectures when the obtained predictions are reduced to “spot” forecasts is presented in Figure 10.
Figure 10. Comparison of the “spot” performances of various probabilistic models.
Concerning the QRF model, the use of ensem-ble NWPs leads to a slight overall improvement. Using the couple mean/variance performs slightly better than the median/MAD. However, using all ensemble members in a direct way leads to more in-stability, for example a peak is observed at horizon +6 h. This can be explained by the fact that QRF tries to discriminate ensemble members, which are, by nature undistinguishable. Consequently, even if QRF is globally “resistant” to dimensionality increases, as shown by its overall performances, the performances are reduced because of not taking into account this information. Concerning KDE, the discrimination among the different approaches is difficult to assess because the performances of the different architectures are very similar.
As a conclusion, the spot performances of the various architectures are globally similar. Regard-ing spot performance, incorporatRegard-ing the mean of the ensemble leads to a small improvement.
B. Evaluation of the probabilistic predictions
The results for interval reliability and sharpness are shown in Figure 11 and Figure 12 respectively. In order to get a better insight of the results, the reliability and sharpness have been computed for horizons +6 h, +24 h and +48 h.
When considering horizon +6 h, the KDE model presented a better reliability than QRF. This is due to structural differences between those two models. QRF has been optimised for the overall reliability and sharpness as evaluated in subsec-tion VII-B, whereas KDE has been optimised for each horizon. It is interesting to notice that this influence is limited to the first horizons for which the statistical properties are different due to the persistence phenomenon. The selection of what criteria should be optimised constitutes another ex-ample of the importance of the modelling choices. Except for this difference, the reliability remains
constant throughout the horizons. However, the prediction intervals gets wider (worst sharpness) as the horizon increases. For example, the mean size of the 90 % interval is 50 % of nominal power at +6 h and close to 60 % at +48 h. This is simply due to the natural increase in uncertainty as we try to predict further.
Considering reliability, the approaches based on ensembles seem to provide better results ob-tained with the predictions used in stage 1. The mean/variance and median/MAD approaches seems to provide a better overall reliability. However, when considering sharpness, the conclusion is not evident and the differences observed depending on the horizon. The results of the different approaches are similar, though.
IX. CONCLUSIONS
Recently, several probabilistic approaches for wind power forecasting appeared due to their in-terest for optimal decision making when it comes to large-scale wind power integration. In the mean-time, new types of inputs called weather ensem-bles become available from weather services. The aim of this paper was to classify and compare the different modelling options available today for probabilistic forecasting.
The proposed classification considered both ap-proaches based on standard NWPs (spot) and en-sembles input. The comparison is based on repre-sentative models drawn from that classification.
In the case studies considered the use of ensem-ble NWPs has provided a relatively small improve-ment when compared to spot NWPs. The same im-provement seemed to be attainable by simply using the ensemble mean instead of using all the members as input. The results of the different approaches were similar despite the different approaches used. However, when passing to the next step which is that of evaluating probabilistic forecasts, it becomes a more cumbersome task. The results obtained through the different approaches revealed that a trade-off has to be accepted between reliability and sharpness. More precisely, improving the reliability will generally degrade the sharpness and vice-versa. This implies that choosing among various models for probabilistic forecasting, or even the optimi-sation criteria of the models, is a multi-criteria
decision problem.
This paper constitutes a first step towards a complete evaluation of the proposed classification. This comparison will be extended by using ad-ditional probabilistic forecasting approaches and cases studies in future work.
Figure 11. Comparison of intervals reliability for various probabilistic models based on ensemble NWP inputs for horizons +6 h, +24 h and +48 h.
Figure 12. Comparison of intervals sharpness for various probabilistic models based on ensemble NWP inputs for horizons +6 h, +24 h and +48 h.
ACKNOWLEDGEMENTS
The authors would like to thank EDF and M´et´eo France for providing the data for the various case studies. This work was performed in the frame of project ENSEOLE, funded in part by ADEME, the French Environment and Energy Management Agency. The authors would also like to thank L. M. Costa for his useful comments and suggestions.
REFERENCES
[1] G. Giebel, G. Kariniotakis, and R. Brownsword, “the state of the art in short-term prediction of wind power – from a danish perspective,” in Proceedings of the
4th International Workshop on Large-Scale Integration of Wind Power and Transmission Networks for Offshore Wind farms, Billund, Denmark, October 20-21 2003.
[2] M. Lange, “Analysis of the uncertainty of wind power predictions,” Ph.D. dissertation, Carl von Ossietzky Old-enburg University, 2003.
[3] ——, “On the uncertainty of wind power predictions – analysis of the forecast accuracy and statistical distribution of errors,” Journal of Solar Energy Engineering, vol. 127, no. 2, pp. 177–184, May 2005.
[4] C. Mohrlen, “Uncertainty in wind energy forecasting,” PhD Dissertation, University College Cork, National Uni-versity of Ireland, 2004.
[5] P. Pinson, “Estimation of the uncertainty in wind power forecasting,” Ph.D. dissertation, ´Ecole des Mines de Paris, 2006.
[6] J. K. Sivillo, J. E. Ahlquist, and Z. Toth, “An ensemble forecasting primer,” Weather and Forecasting, vol. 12, no. 4, pp. 809–818, Dec. 1997.
[7] E. E. Ebert, “Ability of a poor man’s ensemble to predict the probability and distribution of precipitation,” Monthly
Weather Review, vol. 129, no. 10, pp. 2461–2480, Oct. 2001.
[8] R. Doherty and M. O’Malley, “A new approach to quantify reserve demand in systems with significant installed wind capacity,” IEEE Transactions on Power Systems, vol. 20, no. 2, pp. 587–595, 2005.
[9] L. M. Costa, F. Bourry, and G. Kariniotakis, “Stochastic optimization techniques for the optimal combination of wind power generation and energy storage in a market environment,” in proceedings of the european wind energy
conference, Brussels, Belgium, 31 march - 3 april 2008. [10] F. Bourry, J. Juban, L. M. Costa, and G. Kariniotakis,
“Advanced strategies for wind power trading in short-term electricity markets,” in proceedings of the european wind
energy conference, Brussels, Belgium, 31 march - 3 april 2008.
[11] A. Luig, S. Bofinger, and H. G. Beyer, “Analysis of confidence intervals for the prediction of the regional wind power output,” in Proceedings of the European Wind
Energy Conference, Copenhagen, 2001.
[12] H. A. Nielsen, H. Madsen, and T. S. Nielsen, “Using quantile regression to extend an existing wind power fore-casting system with probabilistic forecasts,” Wind Energy, vol. 9, no. 1-2, pp. 95–108, 2006.
[13] J. B. Bremnes, “Probabilistic wind power forecasts using local quantile regression,” Wind Energy, vol. 7, no. 1, pp. 47–54, 2004.
[14] ——, “A comparison of a few statistical models for mak-ing quantile wind power forecasts,” Wind Energy, vol. 9, no. 1-2, pp. 3–11, 2006.
[15] J. Taylor, P. McSharry, and R. Buizza, “Wind power density forecasting using wind ensemble predictions and time series models,” 2006, forthcoming.
[16] G. Giebel, L. Landberg, J. Badger, K. Sattler, H. Fed-dersen, T. Nielsen, H. Nielsen, and H. Madsen, “Using ensemble forecasting for wind power,” in Proceedings
of the European wind energy conference and exhibition, Madrid, Spain, 16-19 Jun 2003.
[17] G. Giebel, J. Badger, L. Landberg, H. A. Nielsen, H. Mad-sen, K. Sattler, and H. FedderMad-sen, “Wind power forecasting using ensembles,” in Proceedings of the 2004 Global
Windpower Conference and Exhibition, Chicago, Illinois, USA, 2004.
[18] H. A. Nielsen, H. Madsen, T. S. Nielsen, J. Badger, G. Giebel, L. Landberg, K. Sattler, and H. Feddersen, “Wind power ensemble forecasting,” in Proceedings of
the 2004 Global Windpower Conference and Exhibition, Chicago, Illinois, USA, 2004.
[19] H. A. Nielsen, T. S. Nielsen, H. Madsen, G. Giebel, J. Bad-ger, L. Landberg, K. Sattler, L. Voulund, and J. Tøfting, “From wind ensembles to probabilistic information about future wind power production – results from an actual application,” in Prooceedings of the 9th International
Conference on Probabilistic Methods Applied to Power Systems, 27 February - 2 March 2006, invited paper. [20] S. Lang, C. Mhrlen, J. J. B. . Gallachir, and E. McKeogh,
“Application of a multi-scheme ensemble prediction sys-tem for wind power forecasting in ireland and comparison with validation results from denmark and germany,” in
Proceedings of the European Wind Energy Conference, Athens, Greece, March 2006.
[21] L. von Bremen, R. Hagedorn, and T. Peroliagis, “Towards probabilistic wind power forecasting based on ensemble prediction techniques,” Presentation in the 7th European Meteorological Society Annual Meeting, October 2007. [22] L. von Bremen, “Combination of deterministic and
proba-bilistic meteorological models to enhance wind farm power forecasts,” Journal of Physics: Conference Series, vol. 75, p. 012050 (8pp), 2007.
[23] P. Pinson and G. Kariniotakis, “On-line assessment of prediction risk for wind power production forecasts,” Wind
Energy, vol. 7, no. 2, pp. 119–132, 2004.
[24] V. N. Vapnik, The Nature of Statistical Learning Theory, 2nd ed., ser. Statistics for Engineering and Information Science. New York: Springer, 2000.
[25] L. Breiman, “Random forests,” Machine Learning, vol. 45, no. 1, pp. 5–32, Oct. 2001.
[26] T. Gneiting, A. E. Raftery, A. H. Westveld, and T. Gold-man, “Calibrated probabilistic forecasting using ensemble model output statistics and minimum crps estimation,”
Monthly Weather Review, vol. 133, no. 5, pp. 1098–1118, 2005.
[27] J. Juban, N. Siebert, and G. N. Kariniotakis, “Probabilistic short-term wind power forecasting for the optimal man-agement of wind generation,” in Proceedings of the IEEE
PowerTech Conference, Lausanne, Switzerland, 1-5 July 2007.
[28] J. Juban, L. Fugon, and G. Kariniotakis, “Probabilistic short-term wind power forecasting based on kernel density estimators,” in Proceedings of the European Wind Energy
Conference, Milan, Italy, 7-10 May 2007.
[29] L. Breiman, J. Friedman, C. J. Stone, and R. Olshen,
Clas-sification and Regression Trees. Chapman & Hall/CRC, 1984.
[30] N. Meinshausen, “Quantile regression forests,” Journal of
Machine Learning Research, vol. 7, pp. 983–999, June 2006.
[31] H. Madsen, P. Pinson, G. Kariniotakis, H. A. Nielsen, and T. S. Nielsen, “Standardizing the performance evaluation of shortterm wind power prediction models,” Wind
Engi-neering, vol. 29, pp. 475–489(15), 2005.
[32] I. T. Jolliffe and D. B. Stephenson, Forecast Verification: A
Practitioner’s Guide in Atmospheric Science. New York: Wiley, 2003.