HAL Id: hal-00663138
https://hal.archives-ouvertes.fr/hal-00663138
Submitted on 28 Mar 2014
HAL is a multi-disciplinary open access archive for the deposit and dissemination of sci-entific research documents, whether they are pub-lished or not. The documents may come from teaching and research institutions in France or abroad, or from public or private research centers.
L’archive ouverte pluridisciplinaire HAL, est destinée au dépôt et à la diffusion de documents scientifiques de niveau recherche, publiés ou non, émanant des établissements d’enseignement et de recherche français ou étrangers, des laboratoires publics ou privés.
amplifier
Per Lunnemann, Sara Ek, Kresten Yvind, Rozenn Piron, Jesper Mørk
To cite this version:
Per Lunnemann, Sara Ek, Kresten Yvind, Rozenn Piron, Jesper Mørk. Nonlinear carrier dynamics in a quantum dash optical amplifier. New Journal of Physics, Institute of Physics: Open Access Journals, 2012, 14, pp.013042. �10.1088/1367-2630/14/1/013042�. �hal-00663138�
T h e o p e n – a c c e s s j o u r n a l f o r p h y s i c s
New Journal of Physics
Nonlinear carrier dynamics in a quantum dash
optical amplifier
Per Lunnemann1,3, Sara Ek1, Kresten Yvind1, Rozenn Piron2 and Jesper Mørk1,3
1Department of Photonics Engineering, Technical University of Denmark,
DK-2800 Kgs Lyngby, Denmark
2FOTON, INSA-Rennes, 20 avenue des buttes de C¨oesmes, 35043 Rennes,
France
E-mail:[email protected]@fotonik.dtu.dk New Journal of Physics14 (2012) 013042 (17pp)
Received 11 November 2011 Published 23 January 2012 Online athttp://www.njp.org/
doi:10.1088/1367-2630/14/1/013042
Abstract. The results of experimental pump–probe spectroscopy of a quantum dash optical amplifier biased at transparency are presented. Using strong pump pulses we observe competition between free carrier absorption and two-photon-induced stimulated emission that can have drastic effects on the transmission dynamics. Thus, both an enhancement as well as a suppression of the transmission can be observed even when the amplifier is biased at transparency. A simple theoretical model taking into account two-photon absorption and free carrier absorption is presented that shows good agreement with the measurements.
3Author to whom any correspondence should be addressed.
Contents
1. Introduction 2
2. Experiment 3
2.1. Device and setup . . . 3
2.2. Experimental results . . . 4 3. Theoretical model 7 3.1. Gain . . . 8 3.2. Refractive index . . . 8 3.3. Propagation equation . . . 9 3.4. Numerical results . . . 10 4. Discussion 12 4.1. Comparison . . . 12 4.2. Alternative mechanisms . . . 14 5. Conclusion 16 Acknowledgment 16 References 16 1. Introduction
The interest in using semiconductor optical amplifiers (SOAs) and optical switches within optical communication has led to extensive research on the ultra-fast carrier dynamics of such devices. Recently, low-dimensional structures, such as quantum dashes (QDashes) [1–4] and quantum dots (QDs) [5, 6], have demonstrated enhanced optical performance compared to similar bulk and quantum well devices. Owing to their large differential gain, ∂g/∂ N [7], and large inhomogeneously broadened spectrum, enhanced features such as a small linewidth enhancement factor, a low threshold current density [4, 8, 9], a large saturation power [7, 10] and ultra-fast gain recovery times [11–16] have been demonstrated. For the latter, pump–probe spectroscopy using short optical pulses [17,18] has served as an efficient tool for simultaneous measurement of the ultra-fast temporal gain and refractive index dynamics [19].
Typically, most pump–probe experiments are carried out in the linear regime, allowing a relatively straightforward extraction of time constants by fitting [19, 20] to the theoretical response [21] of the active medium, including the effects of carrier depletion, spectral holeburning, carrier heating and two-photon absorption (TPA). For the interpretation of such linear pump–probe measurements, the influence of free carrier absorption (FCA) is usually neglected, except for its contribution to loss and carrier heating, the latter being significant in particular around the transparency point [22]. FCA involves the excitation of a carrier to a higher-energy state by the absorption of a photon and simultaneous interaction with a phonon and scales with the total carrier density [23].
Recently, the excitation of carriers was utilized for compact, low-power all-optical switching based on photonic crystal cavity structures [24–26]. Here, a fast switching is demonstrated by shifting the cavity resonance via a carrier-induced change of refractive index. In particular, an FCA-induced change of refractive index has proven efficient for achieving low-power optical switching [24, 25]. A basic understanding of the nonlinear response from
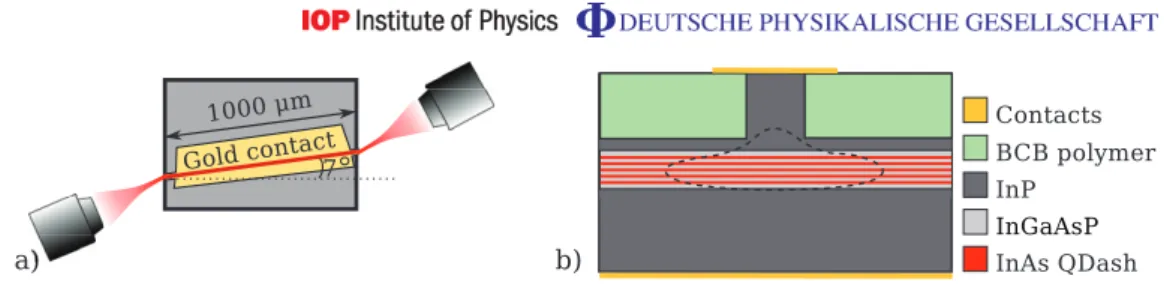
Figure 1.Illustration of the investigated device (not to scale). (a) Top view of the sample with the laser beams (red) free space coupled in and out of the waveguide by aspheric lenses. (b) Epitaxial material composition. The dashed line illustrates the optical mode.
these structures is complicated, however, since the observed dynamics are a combination of the waveguide/cavity dispersion and material response that are difficult to separate.
Moreover, with the need for SOAs operating at ever higher data rates and higher power, ultra-fast and nonlinear absorption processes such as TPA become increasingly important. The effects manifest themselves not only in the dynamical response but also in pulse propagation, where they can lead to strong pulse distortion [27]. Short intense optical fields may lead to a significant change of the carrier density generated by TPA, which further results in FCA. Thus, a detailed understanding of the dynamics of the interplay between TPA and FCA is important.
In this paper, we investigate the dynamical effects of FCA and show that for short intense pulses, FCA in combination with TPA is important for, and in some cases even dominates, the transmission dynamics. The experiment is carried out using pump–probe spectroscopy on a simple ridge waveguide structure with an active layer of QDashes. In order to separate the effects arising from stimulated absorption and emission, we shall concentrate on a particular configuration where the waveguide is electrically biased for transparency. In this regime, stimulated absorption and emission are balanced, and the pump-pulse therefore does not create any carriers other than via TPA [22]. This simplifies effects caused by TPA since spectral hole burning and its induced carrier heating may be neglected [19].
2. Experiment 2.1. Device and setup
The sample investigated is a 1 mm long single-mode ridge waveguide with five layers of InAs QDashes on an InGaAsP compound that is lattice matched to InP; see figure1.
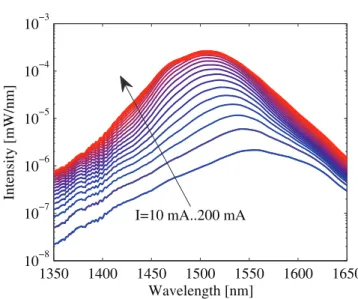
The QDash layers are sandwiched in a p–i–n configuration with gold contacts evaporated onto the p and n material to allow for electrical carrier injection. Amplified spontaneous emission measurements show an emission frequency centered near 1530 nm; see figure 2. To avoid back reflections, the waveguide is angled by 7◦, while the facets are AR coated. The
transverse optical mode area is approximately 3µm2 and the coupling coefficient from free space was measured to be 0.45. The sample is bonded to a copper mount that is temperature stabilized to 18◦C using Peltier elements.
The pump–probe measurements were performed using a degenerate heterodyne pump–probe setup using near transform limited Gaussian pulses with durations of ∼200 fs and a repetition rate of 280 kHz. The pump power was controlled electronically using an
1350 1400 1450 1500 1550 1600 1650 10−8 10−7 10−6 10−5 10−4 10−3 Wavelength [nm] Intensity [mW/nm] I=10 mA..200 mA
Figure 2. Measured amplified spontaneous emission spectra for currents of 10–200 mA in steps of 10 mA.
acousto-optic modulator (AOM). A second AOM was used to spatially and spectrally separate the probe and reference beam. The probe transmission and phase were measured based on a lock-in detection at a beating frequency between the probe and reference. The pump-induced changes in transmission and phase were extracted by insertion of a mechanical chopper that modulates the pump at a low frequency of 15 Hz. For further setup and detection details, see [21,28].
2.2. Experimental results
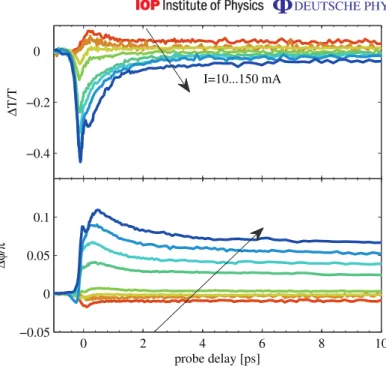
Pump–probe measurements are typically carried out for sufficiently weak pump pulses that the changes in transmission and phase scale linearly with the pump power. An example of such measurements is given in figure3, showing the differential transmission (top) and phase change (bottom) as a function of probe delay for different applied currents. The differential transmission is defined as(Tw− Tw.o)/Tw.o, where Tw(Tw.o) is the transmission with (without) the pump. The
phase change is defined as the spectrally averaged measured change of phase φw− φw.o. The
uncoupled pump and probe pulse energies were estimated to be 110 and 80 fJ, respectively, with both pulses being within the linear regime. In agreement with earlier reports [11,12,29–31], we observe that, for the lowest currents, the probe experiences an increase in transmission as a result of carriers generated by the absorption of pump photons. Similarly, for the highest currents, a decrease in transmission results from carrier depletion due to the stimulated emission induced by the pump. As a consequence of the Kramers–Kronig relation between the real and imaginary parts of the susceptibility, removal (excitation) of carriers leads to a positive (negative) phase change of the probe signal [19]. At the transparency current Itr, where stimulated emission and
absorption processes are balanced, only TPA processes involving the simultaneous absorption of a pump and a probe photon lead to a small decrease near zero delay [32], while at long delays the differential transmission is vanishing. In the following, we shall consider pump–probe measurements with a strong pump-pulse energy carried out at the transparency current. The transparency current, Itr, was measured by detecting the differential transmission at 10 ps as
−0.4 −0.2 probe delay [ps] Δ T/T 0 2 4 6 8 10 −0.05 0 0.05 0.1 probe delay [ps] Δφ /π I=10...150 mA
Figure 3. Examples of the differential transmission (top) and phase change (bottom) for a weak pump energy carried out at 1525 nm. Applied currents, as indicated by the arrow, are 0.37Itr, 0.56Itr, 0.93Itr, 1.11Itr, 1.85Itr, 2.78Itr, 3.70Itr
and 5.56Itr, where Itr= 27 mA, corresponding to 10–150 mA.
a function of current for a weak pump. Itr is then defined as the crossing-point where the
transmission change goes from negative to positive; see figure 3. We emphasize that this definition determines the point where stimulated absorption and emission are balanced. Thus, coupling losses, waveguide losses and FCA still lead to a small attenuation of the probe transmission at the transparency current.
For strong pump pulses, TPA processes involving two pump photons start becoming important [33]. Highly energetic carriers are generated that, through carrier–carrier and carrier–phonon scattering, relax to the spectral region of the probe. In figure4, measurements of the differential transmission and phase change at the transparency current are plotted as a function of probe delay for various pump pulse energies. Looking at the transmission near zero delay, it is seen that the probe transmission monotonically decreases for increasing pump pulse energies. Focusing on delays>3 ps, the transmission is initially seen to increase for increasing pulse energies. However, increasing the pulse energy beyond 100 pJ the transmission is seen to drop, becoming almost fully suppressed for the highest pulse energy. This change of sign, however, is not reflected in the phase change, which shows a monotonic decrease for increasing energy.
We interpret the monotonic decrease in transmission near 0 ps delay as due to TPA processes involving the absorption of a pump and a probe photon. As the pump becomes stronger, TPA processes involving two pump photons become important. In this process, highly energetic carriers are generated that, within a few ps, relax into the spectral region of the probe. The additional carriers are accordingly monitored as an increase in probe transmission at longer time delays [33]. This interpretation is in agreement with the measurements in figure 4 for pulse energies below 100 pJ. The observed drastic reduction in transmission for pulse energies
−1 −0.5 0 0.5 delay [ps] Δ T/T −2 0 2 4 6 8 10 −4 −3 −2 −1 0 probe delay [ps] Δφ /π 0.7 pJ...680 pJ
Figure 4.Differential transmission (top) and phase change (bottom) at 1525 nm for uncoupled pump pulse energies of 0.7, 3, 11, 38, 77, 153, 306 and 580 pJ. above 100 pJ cannot be explained by TPA-induced carrier filling alone. As discussed earlier, the monotonic decreasing value of the phase change suggests that an ever increasing number of excited carriers are generated when the pulse energy is increased, despite the decreasing transmission.
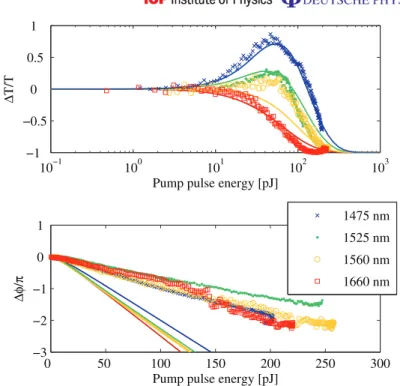
In figure5, measurements of the transmission and phase change are presented as a function of pump energy performed at a fixed delay of 7 ps for various wavelengths. All measurement series were carried out at their respective transparency current, except for 1660 nm where no absorption/gain change was detectable in the linear regime for any current. This implies, in agreement with figure 2, that the wavelength 1660 nm is below the lowest QDash transition; hence no current was applied for this series. Focusing on 1475 nm, it is seen that the transmission increases for increasing energy with a maximum differential transmission of 0.8 near 60 pJ. Beyond 60 pJ, the transmission is seen to decrease drastically for increasing pulse energy. A similar trend is seen for the shorter wavelengths, 1525 and 1560 nm, while the peak transmission is less pronounced. At 1660 nm, no increase in transmission is observed for increasing pump energy; rather, it decreases monotonically and is strongly suppressed for pulse energies above 100 pJ.
We suggest that the combination of TPA and FCA is responsible for this drastic suppression of the probe transmission. A simple interpretation is the following: the pump initially excites a large number of carriers through TPA. Within the first 1–3 ps, the carriers redistribute energetically toward a quasi Fermi distribution through carrier–carrier scattering and carrier–phonon interactions with relaxation times typically measured to 0.05–0.5 and 0.5–2 ps, respectively [11, 12, 30]. Finally, the initial carrier distribution is recovered via spontaneous emission and electrical carrier injection on a typical time scale of 100 ps–1 ns. The trailing probe experiences two sources of amplification/absorption: one is the increasing gain as a result of TPA-induced band filling, whereas the other is the increase of FCA due to the larger carrier density. The former eventually saturates for increasing pump power, whereas FCA grows linearly with the carrier density.
0 50 100 150 200 250 300 −3 −2 −1 0 1
Pump pulse energy [pJ]
Δφ /π 1475 nm 1525 nm 1560 nm 1660 nm 10−1 100 101 102 103 −1 −0.5 0 0.5
Pump pulse energy [pJ]
Δ
T/T
Figure 5. Measured differential transmission (top) and the phase change (bottom) at a probe delay of 7 ps as a function of uncoupled pump-pulse energy. The measurements series were carried out at their respective transparency current apart from 1660 nm that was carried out with no applied current. Solid lines represent theoretical calculations, at the corresponding wavelengths, based on a model presented in section3. Chosen parameters are presented in table1. In the following we shall formulate a simple model including the above-mentioned processes and compare its predictions with figure5. Later we shall discuss other possible effects that may be responsible for the observations.
3. Theoretical model
The following model is based on rate equation descriptions of the carrier dynamics [33] in combination with a one-dimensional (1D) propagation equation for the field within the slowly varying envelope approximation [32].
Assuming charge neutrality, the evolution of the total carrier density N , excited by the pump photon density Sp(t), may be written as
dN(z, t)
dt = ξ + γsN − vgg(z, t)Sp(z, t) + vgβ2Sp(z, t)
2, (1)
whereγs,vg, g,β2 andξ are the spontaneous decay rate, group velocity, gain coefficient, TPA
coefficient and electrical carrier injection rate, respectively. In the case of a material initially biased at transparency we may neglect the third term in (1), since stimulated emission and absorption are balanced. While TPA would change g(t) via the TPA-excited carrier density, this contribution is assumed negligible throughout the short duration of the pump pulse (∼100 fs) since the relaxation time of the energetic two-photon absorbed carriers is >1 ps. Furthermore, considering (1) at times much longer than the carrier–carrier and carrier–phonon scattering rate
but much shorter than the carrier injection ξ and spontaneous decay rate γs, we may further
simplify (1) by neglecting the termsγsN andξ. Equation (1) is then solved as N(z) ≈ vgβ2
Z ∞
−∞
Sp(z, t)2dt + Ninit(z), (2)
where Ninit(z) is the initial carrier density before the pump pulse enters. 3.1. Gain
The material gain experienced by the probe at the optical frequencyω and at a point z along the waveguide is written as [20]
g(z, ω) =aN vg
(nc(z, ω) + nv(z, ω) − N0(ω)), (3)
where nc (nv) is the local electron (hole) density, aN is the gain cross section determined by
the material constants as aN= vg(ωµ2)/(c¯hγ2ε0n0), where µ is the dipole moment and γ2 is
the homogeneous linewidth, ε0 is the vacuum permittivity and n0 is the background refractive
index. Finally, N0is the density of optically coupled states calculated as N0(ω) = Z ∞ −∞ B(ω − ω00) dω00 Z ∞ −∞ L(ω00− ω0)ρ(ω0) dω0, (4)
whereρ is the unbroadened density of states (DOS) function, L is the lineshape function, here evaluated as a Lorentzian of width γ2, and B is the inhomogeneous broadening distribution
function that is modeled as a Gaussian function. Assuming that the carrier population relaxes to a quasi Fermi distribution, one needs to evaluate the corresponding Fermi energy εf and
temperature T in order to evaluate the local carrier density. However, since the delay time of the probe relative to the pump is assumed much longer than the carrier–carrier scattering and carrier heating relaxation time, we may set the temperature to equal the lattice temperature TL.
Thus, we find that
ni(ω) ≈ hnii = N0f(ω; εf,i, TL), (5)
where i = c, v denote conduction and valence bands, respectively. The Fermi energies of the electrons and holes are found by solving the equation
N =
Z ∞
0
hρi(ω)i f (ω; εf, T ) dω (6)
for εf, where hρii ≡R B(ω0)ρ(ω − ω0) dω0 is the inhomogeneously broadened DOS. Similarly
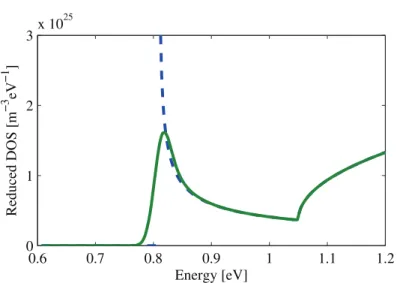
to [34], the DOS is calculated assuming parabolic bands with a quantum wire (2D) confining potential. For simplicity, we assume only a single electron and hole state with a transition that is inhomogeneously broadened by a Gaussian distribution function [34]. With an InGaAsP separation layer between the QDash layers with a thickness of 22 nm we used a bulk-like DOS for energies larger than the bandgap of InGaAsP; see figure6.
3.2. Refractive index
Changes in absorption imply changes in the refractive index via the Kramers–Kronig relation [35]. Here, we treat two sources separately that lead to refractive index changes: contributions from band-filling effects, 1nBFand FCA effects, 1nFCA. The former arises from
0.6 0.7 0.8 0.9 1 1.1 1.2 0 1 2 Energy [eV] Reduced DOS [m −3 eV −1 ]
Figure 6. Reduced DOS used for the calculations. The dashed (solid) line is the unbroadened (inhomogeneous broadened) DOS. Material parameters are presented in table1.
the filling of carriers due to TPA and is calculated using the Kramers–Kronig relation from the calculated gain in (3). The latter is the refractive index counterpart of FCA that arises from absorption due to excitation of electrons (holes) within the conduction (valence) band and is calculated based on the Drude model [23,35]. We obtain
1nBF(z, ω) = 2c e2P Z ∞ 0 −1g(z, ω0) ω02− ω2 dω 0, (7) 1nFCA(z, ω) = − e2 2n0ε0mr 1N(z) ω2 , (8)
where P denotes the principal part, 1g denotes the pump-induced gain difference calculated using equation (3) and1N(z) is the change of carrier density calculated using (2).
3.3. Propagation equation
For the device biased at transparency, the wave equation for the pump envelope, Sp(z, t), in the
frame moving at the group velocity of the pulse, is approximated as [22] ∂ Sp(z, t)
∂z = −αintSp(z, t) − β2Sp(z, t)2, (9)
where αint accounts for waveguide losses. Furthermore, we included TPA only as a source of
loss. Thus, changes of g(z), originating from the TPA-excited carriers, were assumed negligible throughout the duration of the pump pulse. Furthermore, for simplicity FCA absorption and dispersive effects [32] were neglected. Equation (9) has the analytical solution
Sp(z, t) = S0,p(t)αint ezαintα
int− S0,p(t)β2+ ezαintS0,p(t)β2
where S0,p(t) is the initial injected pump envelope. With the probe pulse being temporally well
separated from the pump, the propagation equations for the probe envelope S(z, t) and phase change1φ(z) are given as
∂ S(z, t) ∂z = (0g(z, ω) − 0iσ N(z) − αint)S(z, t), (11) ∂1φ(z) ∂z = ω c(01nBF(z, ω) + 0i1nFCA(z, ω)), (12)
where g(z) denotes the pump-induced material gain term and FCA was included through the term σ N(z). Furthermore, since the probe is assumed weak and temporally separated from the pump, we neglected TPA as opposed to the propagation equation for the pump. 0 denotes the optical confinement factor of the QDashes, while 0i denotes the confinement factor of the
intrinsic region, i.e. the region consisting of InAs and InGaAsP. The choice of these confinement factors is discussed in section4. For the following discussion, we denote by the terms0g(z, ω) and 0iσ N the modal gain and modal FCA, respectively. Equations (11) and (12) are solved
numerically using (2), (3), (7), (8) and (10). Finally, we define the relative probe transmission change 1T T (z) ≡ R∞ −∞(S(z, t; Ep) − S(z, t; 0)) dt R∞ −∞S(z, t; 0) dt , (13)
where S(z, t; Ep) denotes the probe pulse envelope at time t having propagated a distance z
with a preceeding pump pulse of energy Ep. 3.4. Numerical results
The relevant parameters used in all the simulations are shown in table1. We note that the chosen value of the TPA coefficientβ2and the waveguide loss coefficientαintis a result of transmission
measurements of the pump pulse at transparency as a function of pulse energy with a subsequent fitting using equation (9). The measurements were carried out at 1660 nm, and the extracted values ofβ2andαintwere assumed to be equal for all wavelengths in the simulations.
In figure 5 the calculated (solid) and measured (symbols) differential transmission and phase changes are plotted as a function of input pulse energy for the same wavelengths as the experiment. The simulations are seen to be in good qualitative agreement with the measurements, particularly for the differential transmission. We shall discuss this further in section4.
In figure 7, the calculated differential transmission and phase changes are plotted as a function of input pulse energy for a range of different photon energies relative to the QDash center transition. For wavelengths far below the QDash transition, the probe transmission gradually decreases for increasing pump power. At wavelengths close to the transition, the transmission initially increases due to the increased gain arising from the TPA carriers having relaxed to the QDash quantized state. As the pump energy is further increased, the probe transmission eventually drops to zero since the modal FCA dominates over the modal gain.
It is seen that the largest increase in transmission is found for photon energies slightly above the QDash center transition energy. As noted by Dery et al [34], the peak of the DOS is shifted toward higher frequencies due to the asymmetric nature of the DOS of the quantum wire in combination with the Gaussian inhomogeneous broadening distribution function.
Parameter Description Value Unit
mc Conduction band mass (QDash) 0.024 me
mv Valence band mass (QDash) 0.333 me
e
mc Conduction band mass (InGaAsP) 0.057 me
e
mv Valence band mass (InGaAsP) 0.406 me
Eq Quantized transition energy 0.808 eV
Eg Bandgap QDash 0.58 eV
eEg Bandgap (InGaAsP) 1.05 eV
ng Group index 3.62
µ Transition dipole moment 5.0 eÅ
γ2 Homogeneous linewidth 6.6 meV
σIHB FWHM inhomogeneous broadening 30 meV
T Lattice temperature 300 K
β2 TPA coefficient (measured) 1.10 ×10⁻²¹m2
σc= σv FCA cross section 1.2 ×10⁻²⁰m2
αint Waveguide loss coefficient (measured) 4.0 cm−1
0i Confinement factor intrinsic region 0.38
0 Confinement factor (QDash) 0.030
A Modal area 2.2 µm2 10−1 100 101 102 103 −1 −0.5 0 0.5 1 Δ T/T 0 50 100 150 200 250 300 −10 −8 −6 −4 −2 0 φ/ π
Pump pulse energy [pJ]
¯hω /Eq 0.9 0.94 0.98 1.02 1.06 1.1
Figure 7. Calculated differential transmission (top) and phase change (bottom) as a function of input pump pulse energy for various photon energies. Photon energies indicated on the legend are normalized to the QDash transition energy of 0.808 eV.
For photon energies ¯hω/Eq> 1.02, the peak transmission is seen to decrease for increasing
photon energies. This is caused by a combination of two effects. Firstly, the DOS decreases for increasing photon energies above the transition energy; hence the maximum achievable gain
Distance [mm]
Pump pulse energy [pJ]
0 0.5 1 100 101 102 103 Distance [mm]
Pump pulse energy [pJ]
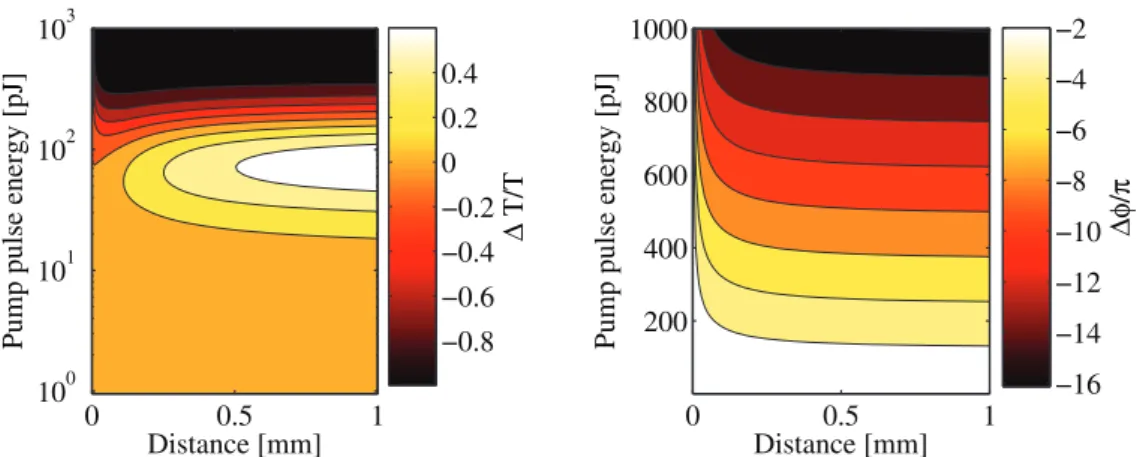
0 0.5 1 200 400 600 800 1000 Δ T/T −0.8 −0.6 −0.4 −0.2 0 0.2 0.4 Δφ /π −16 −14 −12 −10 −8 −6 −4 −2
Figure 8.Calculated differential transmission (left) and phase change (right) as a function of input pump pulse energy and propagation distance. The photon energy is equal to 1.02Eq.
also decreases. Secondly, in order to reach the maximum gain, more carriers are required at large photon energies compared to smaller photon energies. As a result, the modal FCA becomes increasingly important for large photon energies, and is eventually comparable with the modal gain.
Since the absorption of pump photons depends quadratically on the intensity, the observed suppression of transmission is mainly taking place in the first part of the waveguide, as the pump is rapidly attenuated by TPA. This is also seen in figure8, showing the calculated1T/T (z) and 1φ(z) as a function of pump pulse energy and propagation distance. For energies >200 pJ, it is seen that 1T/T drops close to −1 within the first 100 µm. In the remaining part of the waveguide, the transmission of the probe pulse slowly recovers since here the modal gain dominates over the modal FCA. For the phase this results in a rapid change within the first 100µm, while a slight gradual decrease occurs for the remaining part, where the band-filling-induced change of the refractive index dominates. The balance between FCA and gain is clearly seen in figure 9, where the sum of the modal gain and modal FCA, i.e. 0g(z) − 0iσ N(z), is
plotted as a function of the position and pump energy.
4. Discussion
Despite the simplicity of the model, good qualitative agreement with the measurements is seen. Deviations that do appear between experimental and modeling results are analyzed in the following, where the possible role of processes not included in the model are discussed. 4.1. Comparison
Comparing experimental and simulated data in figure5it is seen that deviations occur especially at the wavelength of 1560 nm. We emphasize, however, that only the FCA cross section σi, modal area A and QDash transition energy Eq were fitted. All other parameters are based on
experimental and theoretical estimates (see table 1). As such, better agreement could possibly be achieved by allowing to fit more parameters.
Distance [mm]
Pump pulse energy [pJ]
0.01 0.1 1 100 101 102 Δ G [cm −1 ] −20 −10 0 10
Figure 9.Calculated total modal gain change, i.e. 1G = 01g − 0iσ1N, as a
function of input pump pulse energy and propagation distance at a photon energy of 1.02Eq. For clarity, values below −25 cm−1are not presented in the plot (green
color in the upper left corner).
As discussed previously, the simulations presented in figure7show that for photon energies above the quantized transition energy, the maximum transmission decreases with increasing photon energy. This behavior is not clearly resolved in the experimental data in figure 5. As confirmed by the fits, this is due to the limited wavelength span or too few chosen wavelengths within the span. Moreover, the existence of an additional QDash transition would lead to a further increase in the maximum transmission when tuning to shorter wavelengths. Indeed, the ASE spectra in figure 2for large carrier injection rates indicate a possible additional transition near 1420 nm.
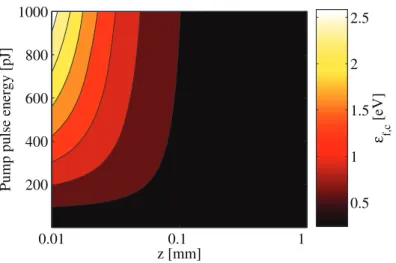
Concerning the phase, when comparing experimental and simulated data in figure 5, the model seems to overestimate the pump-induced phase change. In the model, the confinement factor used for FCA processes is the confinement factor of the intrinsic region, i.e. the fraction of the field overlap with both the buffer layers (InGaAsP) and QDash (InAs) material. Clearly, for low carrier densities (low pump powers), most carriers reside in the confining potential of the QDash. In this regime, a confinement factor of the QDash material should be used as commonly seen in the literature [19, 36]. For large carrier densities, however, a substantial fraction of the carriers resides at energies above the InGaAsP bandgap and are thus not confined to the QDash. In figure 10, the conduction band Fermi energy is plotted as a function of propagation distance and pump-pulse energy. Noting that the bandgap of the InGaAsP material was designed to 1.05 eV, it is seen that in the first part of the waveguide, the Fermi energy exceeds the bandgap energy for pump energies above ∼200 pJ, but quickly decreases below the bandgap energy within the first 0.1 mm. Based on this, the confinement factor would effectively be smaller than the chosen value reflecting the intrinsic region, i.e.0i. From equation (12), this would lead to a
smaller phase change than shown in figure7.
One may ponder why the phase change seems to depend linearly on the pump energy since the change of carrier density 1N depends quadratically on the pulse energy. By the inspection of (12), (7) and (8), we can neglect the band-filling term01nBFin (12) at large pump energies
z [mm]
Pump pulse energy [pJ]
0.01 0.1 1 200 400 600 800 1000 ε f,c [eV] 0.5 1 1.5 2 2.5
Figure 10.Calculated Fermi energy level for the conduction band as a function of input pump pulse energy and propagation distance. The photon energy is equal to 1.02Eq.
Ep. Thus, for large pump energies, the total phase change is seen to scale as 1φ(z) ∝Z z
0
1N(˜z) d˜z. (14)
However, the total number of excited electron–hole pairs, ϒ(z) ≡ A R0z1N(˜z) d˜z, where A is an effective mode area, naturally cannot exceed the total number of injected photons in a pulse, Ep/(¯hω) = vgA
R∞
−∞S(0, t) dt. Thus, ϒ(z) → Ep/(¯hω) for zβ2
R∞
−∞S(0, t) dt 1 and
using (14) we therefore find that
1φ(z) ∝ ϒ(z) ∝ Ep for zβ2
Z ∞
−∞
S(0, t) dt 1, (15)
in agreement with the measurements in figure5. 4.2. Alternative mechanisms
Despite the good qualitative agreement between the model and experiment, several simplifications were made that are expected to be improper at the highest pump intensities. Thus, we did not take into account any dependences of the FCA cross section and TPA coefficient, such as on the material, wavelength or carrier density. Incorporation of such dependencies are not expected to change the results qualitatively, though. Furthermore, we neglected many-body and thermal effects, although the calculated carrier densities reached very high values for the largest pump powers.
Considering heating effects: When using the strongest pulses, one could expect the entire crystal to heat up, thereby changing the material characteristics. To investigate this, we measured the change of transmission and phase as a function of probe delay for long delay scans. The results are shown in figure 11. It is seen that the transmission at 1475 nm is suppressed initially, but gradually increases with time. Near 30 ps, the differential transmission crosses zero and becomes positive. The time scale of this process (100 ps) suggests that it is not related to heating effects of the crystal, since thermal relaxation times for this process are
−1 0 1 delay [ps] Δ T/T 0 20 40 60 80 100 120 140 160 −2 −1 0 delay [ps] Δφ /π λ=1475 nm λ=1660 nm λ=1475 nm λ=1660 nm
Figure 11. Measured differential transmission (top) and the phase change (bottom) for the wavelengths of 1660 and 1475 nm. The pump pulse energy is ∼200 pJ.
of the order of microseconds [37]. Rather, we interpret the initial span 0< t < 30 ps, where the differential transmission is negative, as the regime where FCA dominates over the TPA-induced gain. With time, the carrier density gradually decreases due to spontaneous emission and carrier diffusion, thereby decreasing the FCA. Near 30 ps, the FCA- and TPA-induced gain are balanced, while at later times, t > 30 ps, the TPA-induced gain dominates, giving a positive differential transmission. For t > 100 ps, the TPA gain is no longer saturated and the differential transmission starts decreasing due to the continuous loss of excited carriers through spontaneous relaxation.
Another effect that may affect the gain dynamics at large carrier densities is bandgap renormalization (BGR). Exchange-correlation contributions to the energy of the free carries lead to a lowering of the bandgap for increasing carrier density. Such a lowering of the bandgap could potentially shift the transmission from gain to absorption. The influence of BGR, however, is known to be reduced for confined carriers. Compared to bulk, BGR is reduced for quantum-well-based confinement [38–40], while for wire- and dot-based confinement, a further reduced [41–43] or no BGR at all has been reported [44, 45]. Secondly, recalling that the wavelength of 1660 nm is below the QDash transition energy, we would anticipate an increasing transmission from BGR; that is, TPA gradually fills up the lower QDash state that is simultaneously shifted toward shorter energies, thus resulting in gain. This is in contrast to measurements at 1660 nm presented in figure5, where we observe a monotonic decrease of transmission with increasing pump energy. Hence, we do not expect BGR to be responsible for the observed effects.
While the observed effects are pronounced for the presented structure, the required field intensity is rather high and may therefore not be relevant for typical applications using standard ridge waveguide SOAs. On the other hand, we expect it to be of importance for SOA devices using photonic crystal waveguides [46–48] where a tailored waveguide dispersion enables
a large group index ng∼ 10–100. The associated linear χ1-processes, i.e. gain and phase
changes, scale linearly with the group index, while the nonlinear χ3-processes, such as TPA,
scale as n2g [49–51]. The former would lead to enhanced contrast between the enhancement and suppression of transmission as seen in figure 5, whereas the latter would lead to a drastic reduction of the required pump intensity for observing significant suppression of the transmission.
5. Conclusion
We have performed a detailed investigation of the gain and index dynamics in quantum dash waveguides under strong pulse excitation by the use of heterodyne pump–probe spectroscopy. We showed that for strong pulses the combination of TPA and FCA strongly affects the dynamics of the device. In the analysis we concentrated on the transmission and refractive index dynamics for strong pump pulses with the device biased at transparency. With an increase in pump-pulse energy, the transmission initially increases, followed by a drastic decrease. A simple phenomenological model was presented that accounts for the interplay between the TPA of the pump and the stimulated emission and FCA of the probe. Qualitative agreement with the experiment was achieved, and the limitations and deviations of the model were discussed.
Acknowledgment
This work was supported by the Danish Research Councils in the framework of QUEST and by the Villum Foundation via the VKR centre of excellence NATEC.
References
[1] Lelarge F et al 2007 IEEE J. Sel. Top. Quantum Electron.13 111–24 [2] Reithmaier J, Eisenstein G and Forchel A 2007 Proc. IEEE95 1779–90
[3] Zhou D, Piron R, Grillot F, Dehaese O, Homeyer E, Dontabactouny M, Batte T, Tavernier K, Even J and Loualiche S 2008 Appl. Phys. Lett.93 161104
[4] Zhou D, Piron R, Dontabactouny M, Dehaese O, Grillot F, Batte T, Tavernier K, Even J and Loualiche S 2009
Electron. Lett.45 50
[5] Michler P 2003 Single Quantum Dots: Fundamentals, Applications, and New Concepts (Topics in Applied
Physicsvol 90) ed P Michler (Berlin: Springer)
[6] Nakata Y, Sugiyama Y and Sugawara M 1999 Self-assembled InGaAs/GaAs Quantum Dots (Semiconductors
and Semimetalsvol 60) ed R K Willardson and E R Weber (New York: Academic)
[7] Berg T and Mørk J 2004 IEEE J. Quantum Electron.40 1527–39
[8] Eliseev P, Li H, Liu T, Newell T, Lester L and Malloy K 2001 IEEE J. Sel. Top. Quantum Electron.7 135–42 [9] Sellers I, Liu H, Groom K, Childs D, Robbins D, Badcock T, Hopkinson M, Mowbray D and Skolnick M
2004 Electron. Lett.40 1412
[10] Akiyama T, Ekawa M, Sugawara M, Kawaguchi K, Kuramata A, Ebe H and Arakawa Y 2005 IEEE Photonics
Technol. Lett.17 1614–6
[11] Borri P, Langbein W, Hvam J M, Heinrichsdorff F, Mao M H and Bimberg D 2000 IEEE J. Sel. Top. Quantum
Electron.6 544–51
[12] van der Poel M and Hvam J M 2007 J. Mater. Sci.: Mater. Electron.18 51–5
[13] Schneider S, Borri P, Langbein W, Woggon U, Sellin R, Ouyang D and Bimberg D 2005 IEEE Photonics
[15] Dommers S, Temnov V V, Woggon U, Gomis-Bresco J, Martinez-Pastor J, Laemmlin M, Bimberg D and Gomis J 2007 Appl. Phys. Lett.90 033508
[16] Capua A, Eisenstein G and Reithmaier J P 2010 Appl. Phys. Lett.97 131108
[17] Shah J 1999 Ultrafast Spectroscopy of Semiconductors and Semiconductor Nanostructures 2nd edn (Springer: Berlin)
[18] Hall K L, Lenz G, Ippen E P and Raybon G 1992 Opt. Lett.17 874
[19] Hall K L, Thoen E R and Ippen E P 1998 Nonlinear Optics in Semiconductors II (Semiconductors and
Semimetalsvol 59) ed E Garmire and A Kost (Amsterdam: Elsevier) chapter 2, pp 83–160
[20] Mark J and Mørk J 1992 Appl. Phys. Lett.61 2281–3 [21] Mecozzi A and Mørk J 1996 J. Opt. Soc. Am. B13 2437–52
[22] Mørk J, Mecozzi A and Hultgren C 1996 Appl. Phys. Lett.68 449–51
[23] Bennett B, Soref R and Del Alamo J 1990 IEEE J. Quantum Electron.26 113–22
[24] Fushman I, Waks E, Englund D, Stoltz N, Petroff P and Vuckovic J 2007 Appl. Phys. Lett.90 091118 [25] Husko C, De Rossi A, Combrie S, Tran Q V, Raineri F and Wong C W 2009 Appl. Phys. Lett.94 021111 [26] Jin C Y, Kojima O, Kita T, Wada O, Hopkinson M and Akahane K 2009 Appl. Phys. Lett.95 021109 [27] Romstad F, Borri P, Langbein W, Mork J and Hvam J 2000 IEEE Photonics Technol. Lett.12 1674–6 [28] Borri P, Langbein W, Mørk J and Hvam J M 1999 Opt. Commun.169 317–24
[29] Hall K L, Darwish A M, Ippen E P, Koren U and Raybon G 1993 Appl. Phys. Lett.62 1320–2
[30] van Der Poel M, Mørk J, Somers A, Forchel A, Reithmaier J P and Eisenstein G 2006 Appl. Phys. Lett.89
81102
[31] Zilkie A et al 2007 IEEE J. Quantum Electron.43 982–91 [32] Mørk J and Mecozzi A 1996 J. Opt. Soc. Am. B13 1803–16 [33] Mørk J, Mark J and Seltzer C P 1994 Appl. Phys. Lett.64 2206–8
[34] Dery H, Benisty E, Epstein A, Alizon R, Mikhelashvili V, Eisenstein G, Schwertberger R, Gold D, Reithmaier J P and Forchel A 2004 J. Appl. Phys.95 6103
[35] Jackson J D 1998 Classical Electrodynamics 3rd edn (New York: Wiley) [36] Hegarty S, Corbett B, McInerney J and Huyet G 2005 Electron. Lett.41 416 [37] Scheibenzuber W G and Schwarz U T 2011 Appl. Phys. Lett.98 181110 [38] Kleinman D and Miller R 1985 Phys. Rev. B32 2266–72
[39] Park S H, Shim J I, Kudo K, Asada M and Arai S 1992 J. Appl. Phys.72 279
[40] Tr¨ankle G, Leier H, Forchel A, Haug H, Ell C and Weimann G 1987 Phys. Rev. Lett.58 419–22 [41] Rinaldi R, Coli G, Passaseo A and Cingolani R 1999 Phys. Rev. B59 2230–3
[42] Nowak A, Gallardo E, van der Meulen H, Calleja J, Ripalda J, Gonz´alez L and Gonz´alez Y 2011 Phys. Rev. B 83 1–5
[43] Heitz R, Guffarth F, Mukhametzhanov I, Grundmann M, Madhukar A and Bimberg D 2000 Phys. Rev. B62
16881
[44] Wegscheider W, Pfeiffer L, Dignam M, Pinczuk A, West K, McCall S and Hull R 1993 Phys. Rev. Lett.71
4071–4
[45] Ambigapathy R, Bar-Joseph I, Oberli D, Haacke S, Brasil M, Reinhardt F, Kapon E and Deveaud B 1997
Phys. Rev. Lett.78 3579–82
[46] Cao T, Ho Y L D, Heard P J, Barry L P, Kelly A E and Cryan M J 2009 J. Opt. Soc. Am. B26 768 [47] Mizuta E, Watanabe H and Baba T 2006 Japan. J. Appl. Phys.45 6116–20
[48] Ek S, Lunnemann P, Semenova E S and Yvind K 2011 CLEO/QELS Pacific Rim (Sidney) pp 1–3 [49] Hamachi Y, Kubo S and Baba T 2009 Opt. Lett.34 1072–4
[50] Corcoran B, Monat C, Grillet C, Moss D J, Eggleton B J, White T P, O’Faolain L and Krauss T F 2009 Nat.
Photonics3 206–10
[51] Monat C, Corcoran B, Ebnali-Heidari M, Grillet C, Eggleton B J, White T P, O’Faolain L and Krauss T F 2009 Opt. Express17 2944–53